Start KakaoCloud CI/CD pipelines with Codeflow and Deployflow

· 7 min read
Dev Tools Release

Deploying applications is no longer a simple task of copying source code to a server and running it. Code changes need to go through review, build outputs need to be managed as images, and deployment manifests must continuously stay aligned with the actual cluster state. In production environments, teams often need to validate a new version first, complete an approval process if required, and then shift traffic instead of exposing the new version immediately.

This process is familiar to both development and operations teams, but when it is spread across multiple tools and consoles, even tracking a small change requires a lot of context. It becomes difficult to follow which commit was built into which image, which manifest reflected that image, and which version is actually deployed to the cluster.

KakaoCloud has launched Codeflow and Deployflow to connect this development-to-deployment process more efficiently. When used together, the two services let you configure a CI/CD pipeline within KakaoCloud, from code changes and image builds to manifest updates and Kubernetes cluster deployment.

In this post, we follow how a single code change becomes an actual deployment and look at the role each service plays.

Why Codeflow and Deployflow

Many teams already operate CI/CD by combining Git repositories, CI tools, image repositories, and deployment tools. However, as cloud environments grow, simply connecting tools is not enough. Teams need to track code changes and deployment results with the same context, and naturally include pre-deployment review and approval processes.

Codeflow and Deployflow are especially useful in the following cases.

  • You want to connect source management, builds, image storage, and Kubernetes deployment within KakaoCloud.
  • You want a clear record of how a code change leads to an image and manifest.
  • You need to review changes and complete an approval process before deployment.
  • You want to expose new versions gradually with deployment strategies such as Blue/Green or Canary.

In other words, the core value of Codeflow and Deployflow is not just automating builds and deployments. It is about creating a traceable and reviewable structure from code changes to production rollout.

From code changes to deployment in one flow

Suppose you make a small change, such as updating the color of an application screen. Previously, you might have needed to check the code repository, build tool, image repository, and deployment tool separately. With Codeflow and Deployflow, you can view this process in three broad steps.

Code change
└─ Review and automation in Codeflow
└─ Deployment status check and cluster sync in Deployflow

Developers can check code changes and workflow execution results in Codeflow, while operators can review deployment targets and synchronization status in Deployflow. This makes it easier to consistently follow the process between "the code changed" and "the change was applied to production."

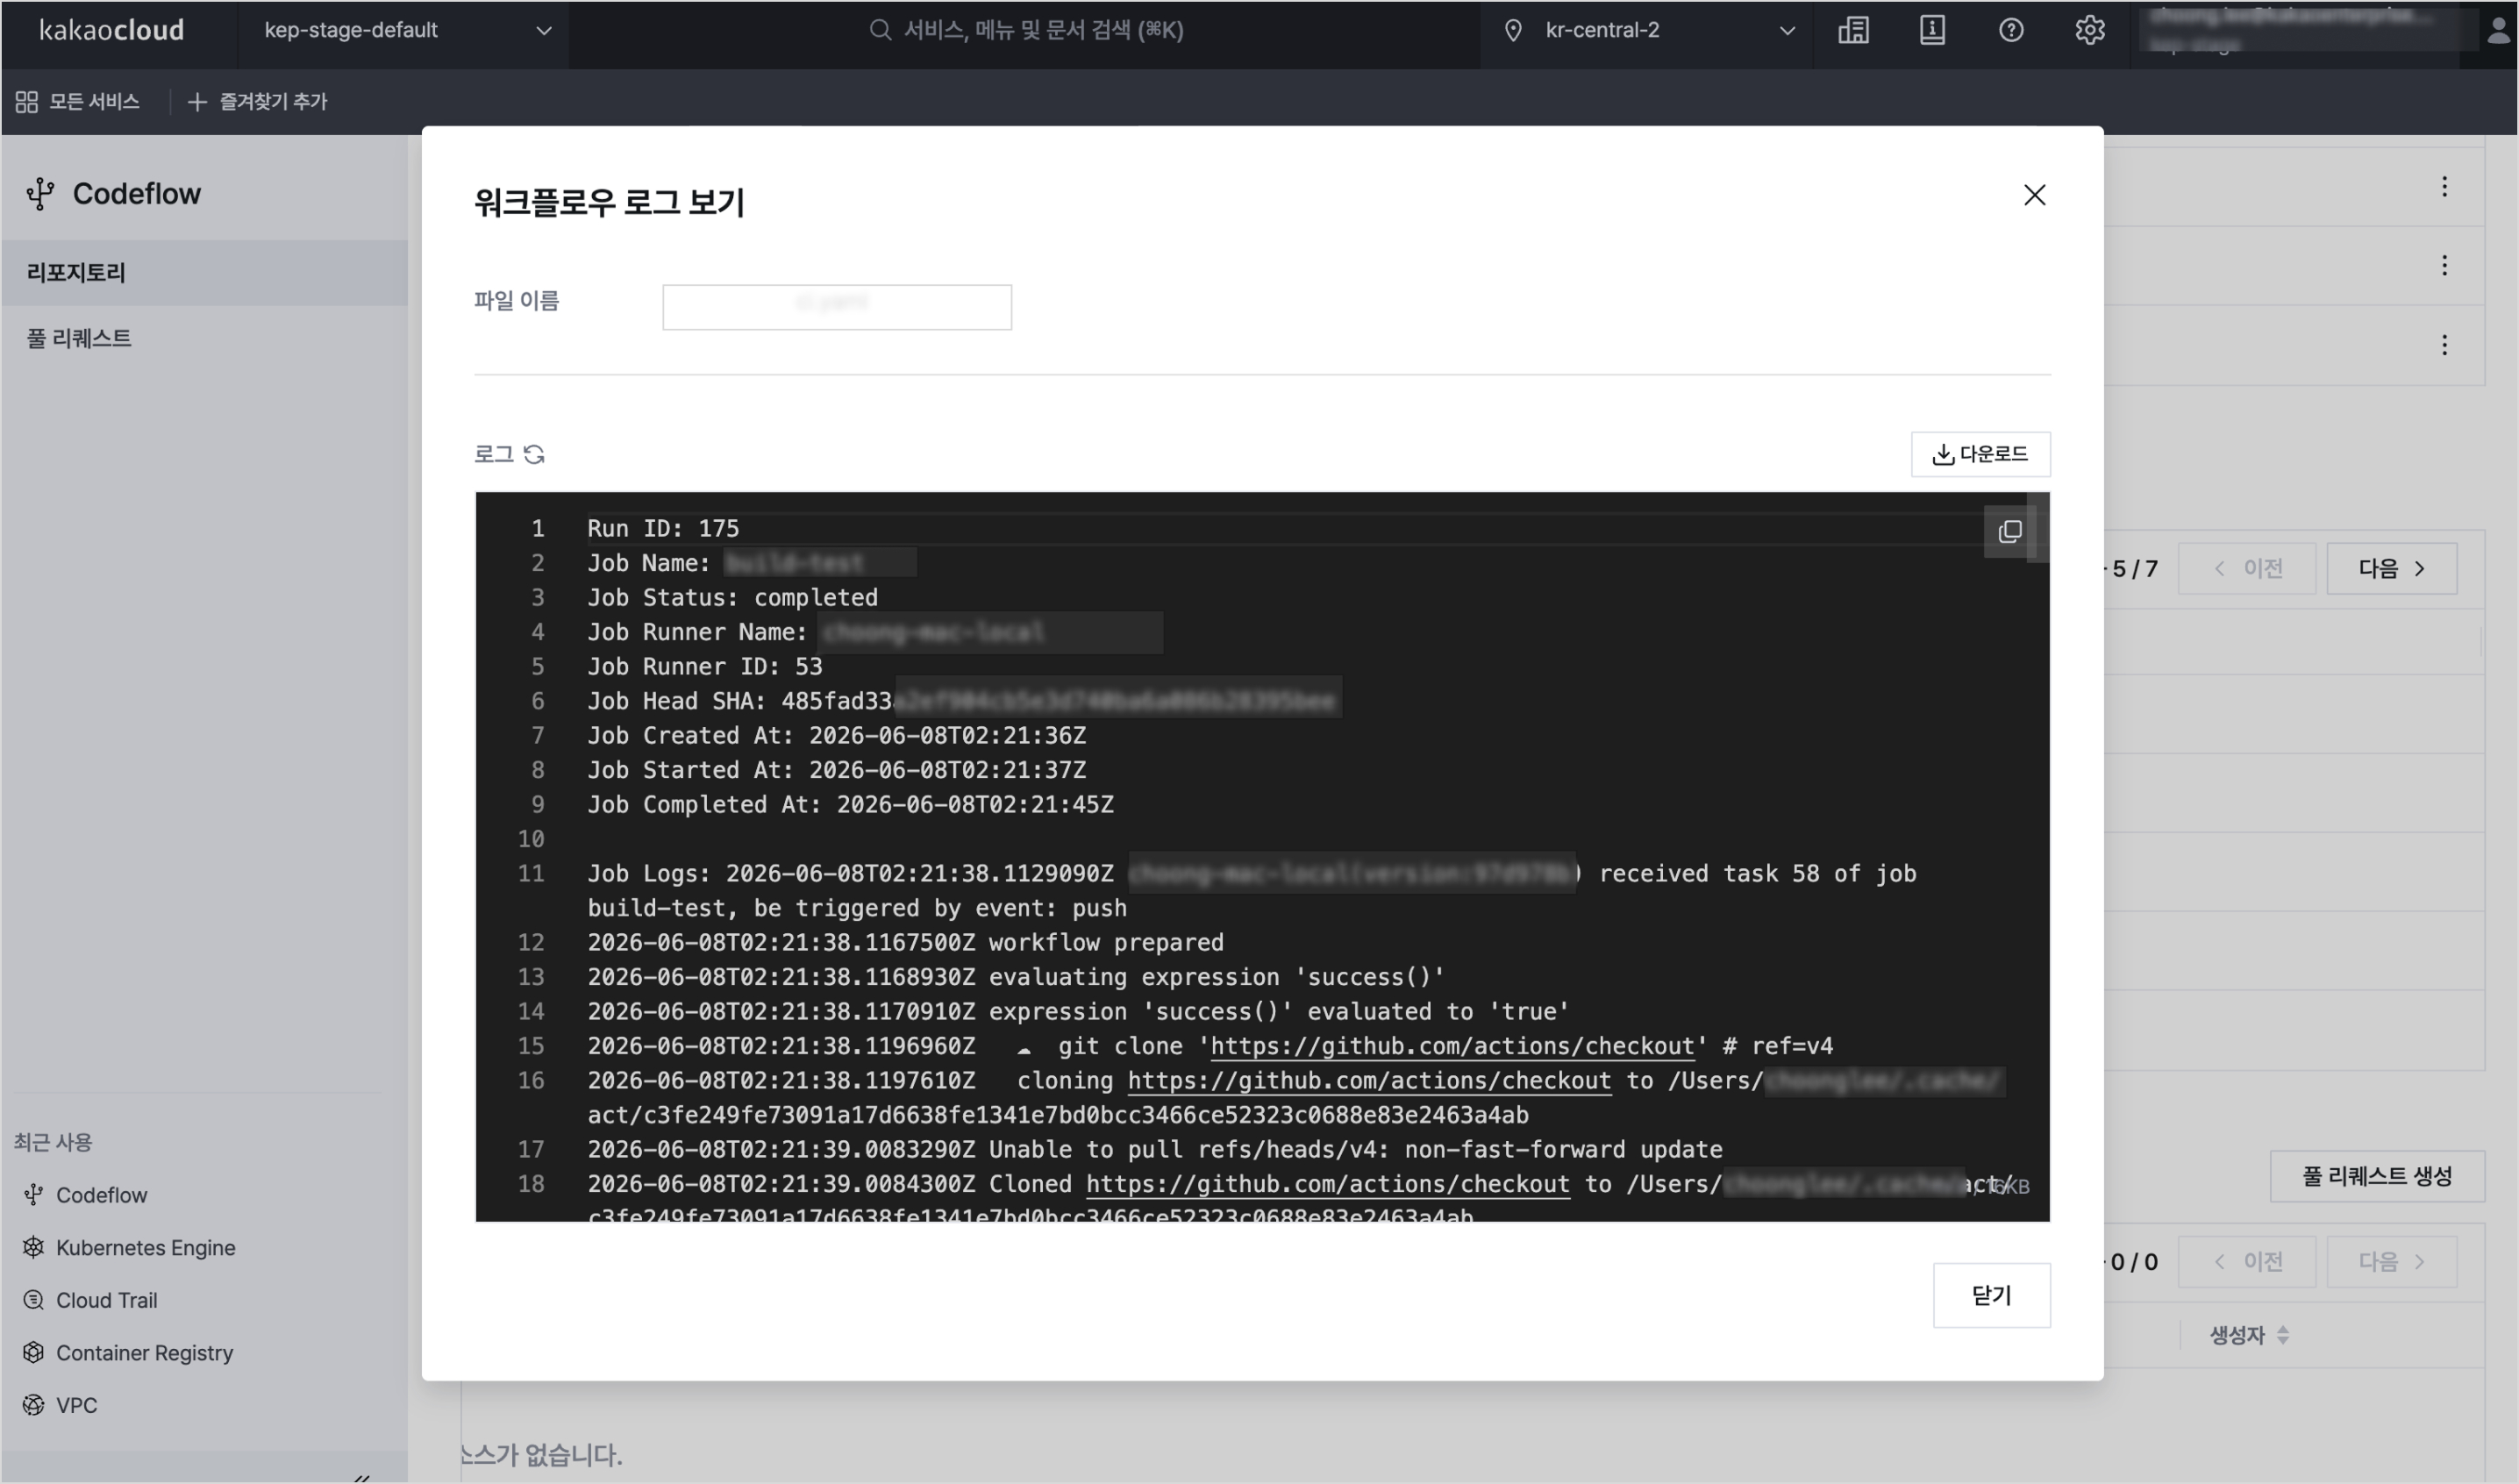
1 Example of Codeflow workflow run logs

Codeflow: Code management and automation

Codeflow is where source code management and development automation begin. You can manage source code and configuration files in repositories, separate change scopes with branches and tags, and operate review and merge processes through pull requests.

You can also automate repeated tasks using workflows and self-hosted runners. Workflow files are defined in YAML format under the .codeflow/workflows path in a repository, and runners execute jobs in an environment prepared by the user. You can use them to automate tasks required before and after deployment, such as builds, tests, image creation, and manifest updates.

In this way, Codeflow goes beyond the role of a code repository and helps connect automation tasks required after code changes into a single process.

Deployflow: Deployment status and strategy management

Deployflow is the center of deployment operations. Based on applications, you can manage deployment target clusters, namespaces, source repositories, deployment methods, and approval settings. It supports Kubernetes standard configuration methods such as Raw Manifest, Kustomize, and Helm charts, and you can connect manifests stored in a Codeflow repository as a deployment source.

After a deployment is executed, you can review synchronization status and resource status. If the target manifest and current cluster state differ, you can compare and apply changes. When an approval process is configured, reviewers can inspect changes before sync or rollback execution.

Deployflow also manages deployment strategies and history. You can use strategies such as Blue/Green and Canary to roll out a new version gradually, and check resource relationships, revisions, failure reasons, and previous deployment records in the topology and history views.

Deployflow is designed to cover not only deployment execution, but also pre-deployment review, in-progress status checks, and post-deployment history management from an operations perspective.

Build it yourself with tutorials

CI/CD is much easier to understand by connecting the pieces yourself. Along with this release, KakaoCloud has prepared hands-on tutorials for configuring a basic pipeline.

The Build a CI/CD pipeline with Codeflow and Deployflow tutorial connects a Codeflow repository, Codeflow workflows, a self-hosted runner, Container Registry, and Deployflow Raw Manifest deployment.

The tutorial starts by pushing an example application to a Codeflow repository. Then you configure a workflow and self-hosted runner to build a container image, store the built image in Container Registry, and finally connect the repository's manifest path as the deployment source in a Deployflow application. This lets you follow the full path from code change to cluster deployment.

📦 Prepare the example application
└─ Push code and manifests to a Codeflow repository
└─ ⚙️ Configure workflows and a self-hosted runner
└─ 🏗️ Build an image and push it to Container Registry
└─ 🚀 Deploy to a Kubernetes Engine cluster with Deployflow

After completing the tutorial, you can directly confirm how a change that starts in Codeflow is applied to a Kubernetes Engine cluster through Deployflow. If you are connecting the two services for the first time, we recommend starting with this tutorial.

Up to the 🔵Blue / 🟢Green deployment strategy

After configuring a basic CI/CD pipeline, the next step is to learn how to deploy new versions more safely. In production environments, you may need a strategy that prepares a new version separately, validates its status, and then shifts traffic instead of sending all traffic to the new version immediately.

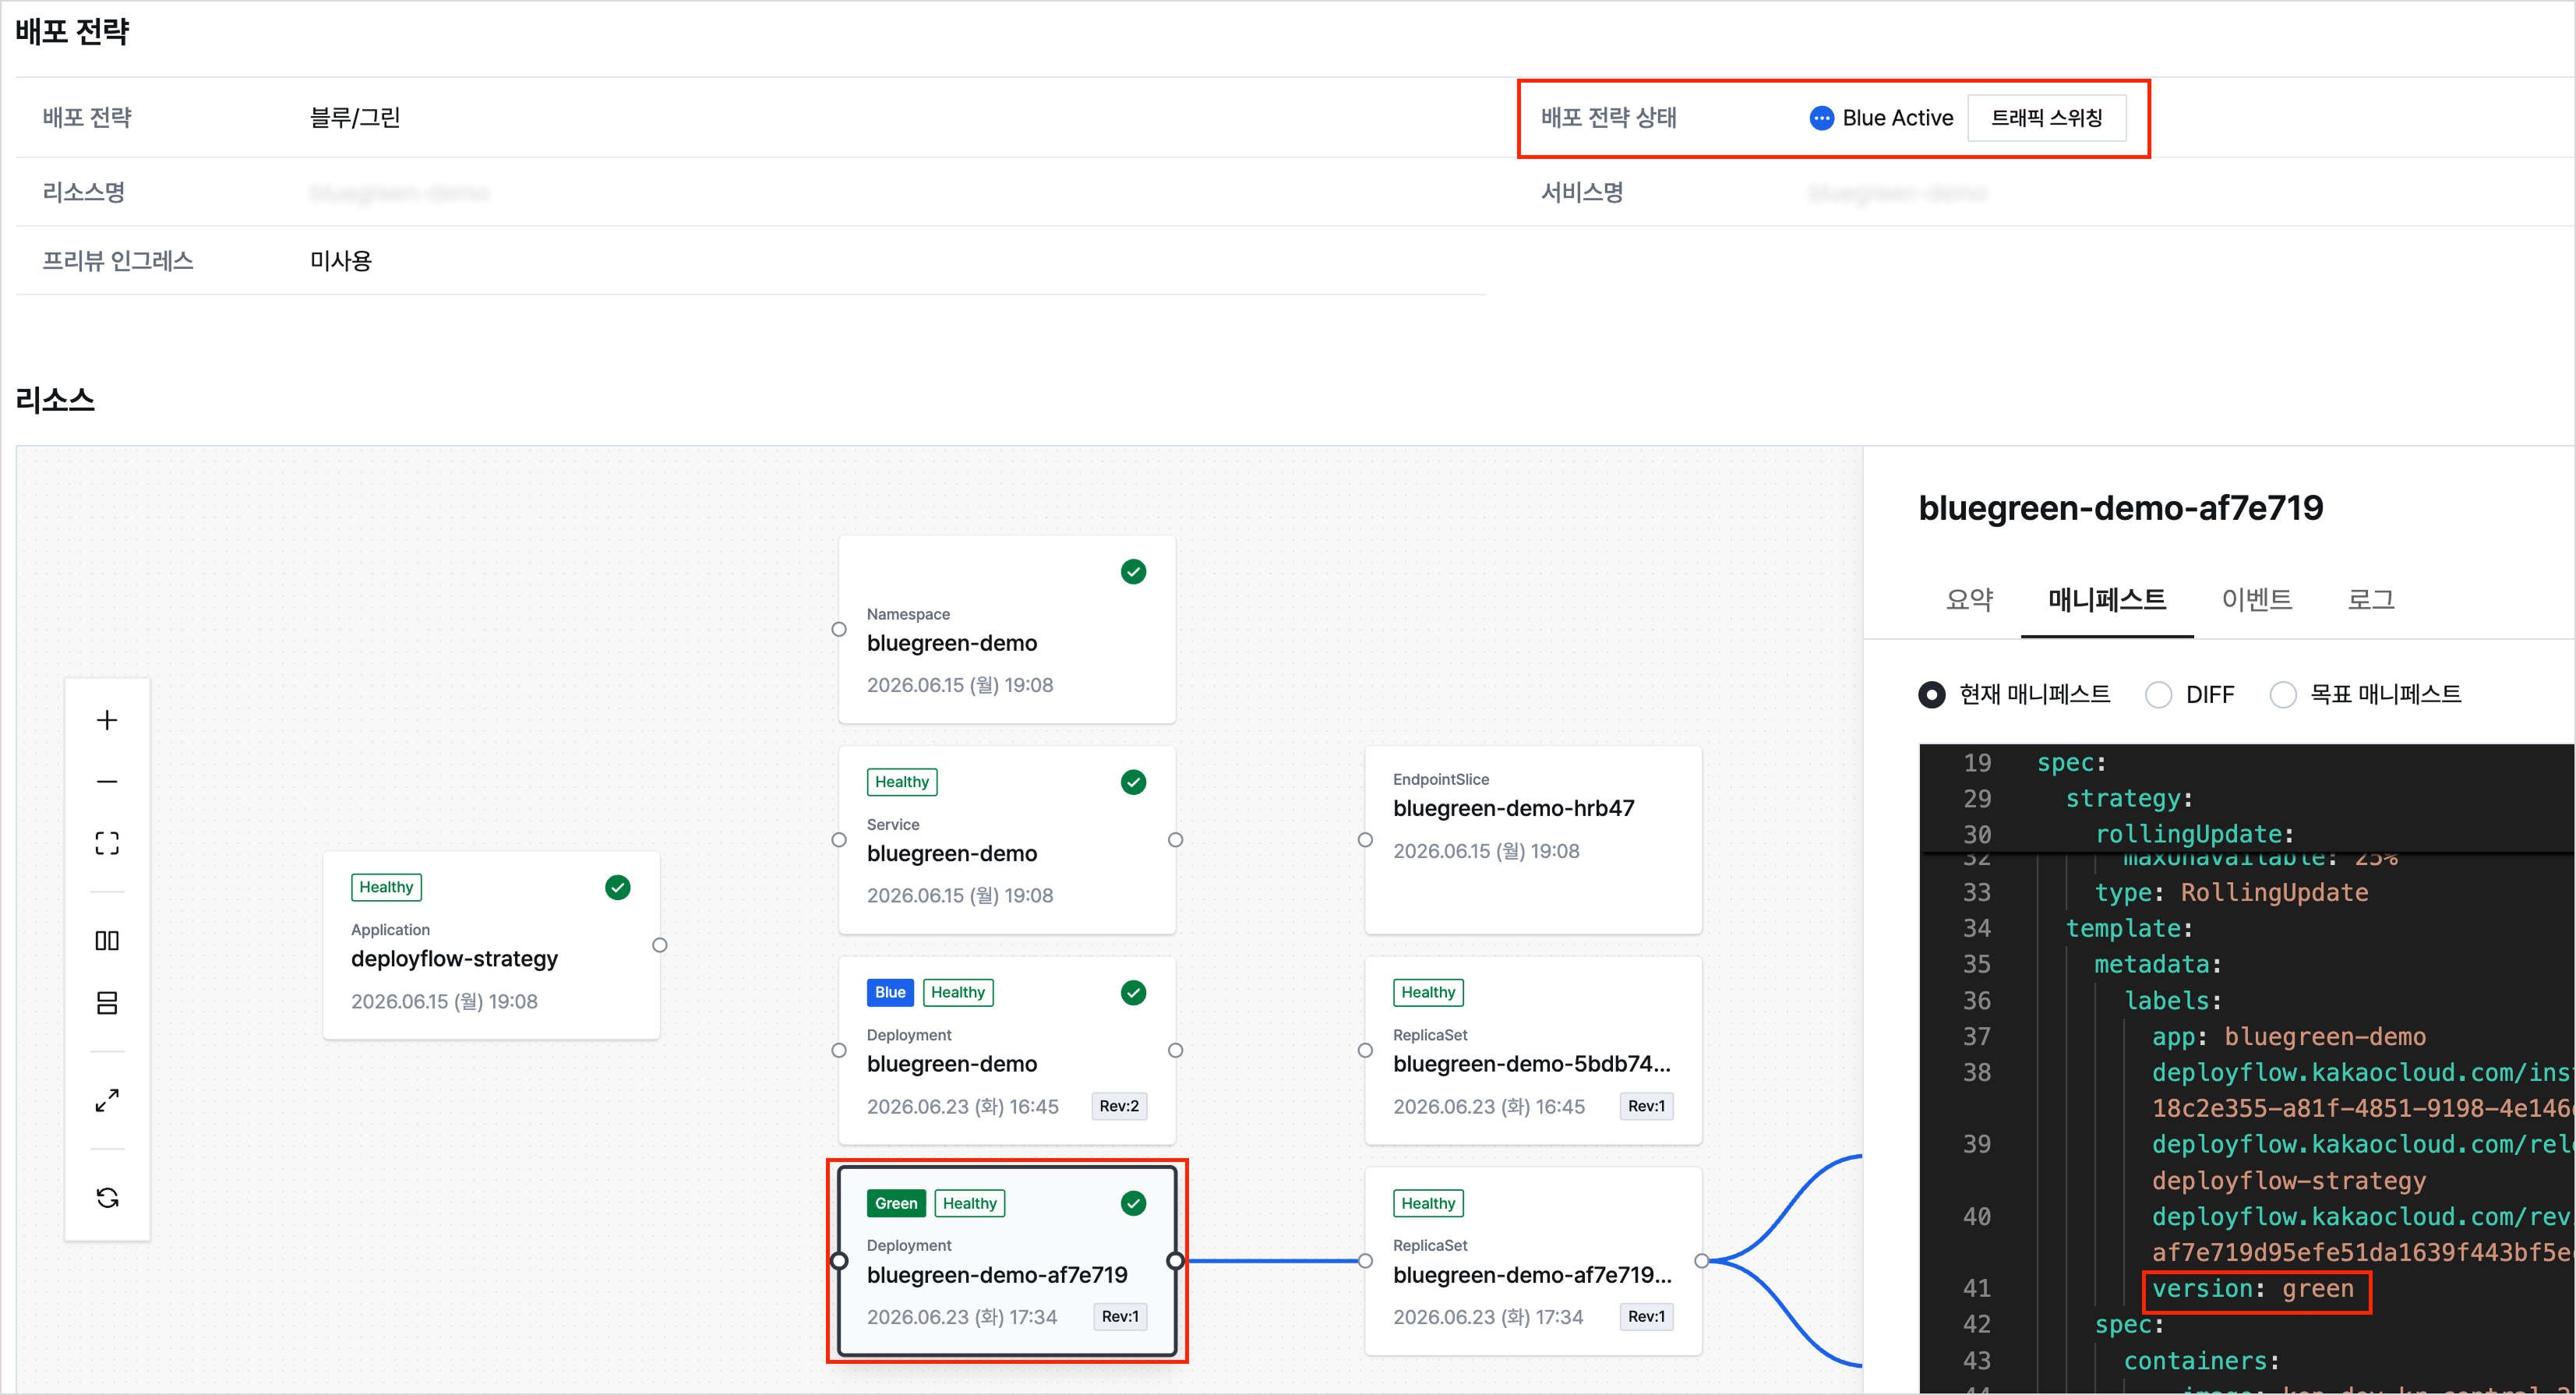
The Implement a Blue/Green deployment strategy with Deployflow tutorial continues from the cicd-app-demo application created in the previous CI/CD tutorial. You can practice deploying a new Green version while the Blue version handles current traffic, checking readiness, and then switching traffic.

🔵 Blue version running
└─ 🟢 Green version prepared
└─ Verify Green Pod status
└─ 🔁 Switch traffic
└─ ✅ Promote the Green version

1 Example of the Deployflow deployment strategy screen


Through this process, you can see how to prepare a new version while keeping the existing version, check its status, and switch the traffic target on the same service endpoint. If you want to go one step beyond basic deployment automation and understand how deployment strategies connect with real operations, continue with this tutorial.

Start now

If you are using Codeflow and Deployflow for the first time, start by configuring a basic pipeline with the Build a CI/CD pipeline with Codeflow and Deployflow tutorial. Then continue with the Implement a Blue/Green deployment strategy with Deployflow tutorial using the same example application to naturally extend from basic deployment automation to traffic switching strategies.

Codeflow and Deployflow are Developer Tools services designed to more clearly connect the process of developing and deploying applications on KakaoCloud. KakaoCloud will continue to enhance development and deployment tools so that code changes, automation, deployment, and operational checks can flow together more naturally.

👉 View Codeflow and Deployflow services
👉 Start KakaoCloud now

AI Insight is now available to improve visibility into AI workload operations

· 5 min read
Evan (진은용)
Service Manager
AI Insight

In AI model training and inference environments, compute resources, runtime environments, and node status are closely connected, affecting workload performance and cost. GPUs account for a particularly important share of AI workloads, but as operating environments grow, it becomes difficult to identify whether resources are actually in use, remain idle, or show signs of abnormal behavior from service-specific screens alone.

In July 2026, KakaoCloud launched AI Insight, a service that lets users view resource status and key metrics required for AI workload operations in an integrated way. AI Insight is an AI monitoring service that provides an at-a-glance view of AI workload operations by monitoring status and key metrics across clusters, nodes, and GPUs.

In this post, we look at operational challenges that AI workload operators often face and introduce how AI Insight can help address them.

When you need an at-a-glance view of key resources

When operating AI workloads, the first thing you need is a quick understanding of the overall status of key resources. This release focuses on GPUs, which are central to AI workloads, and helps you check how many resources are in use, which resources are idle, and which targets require inspection on a single screen.

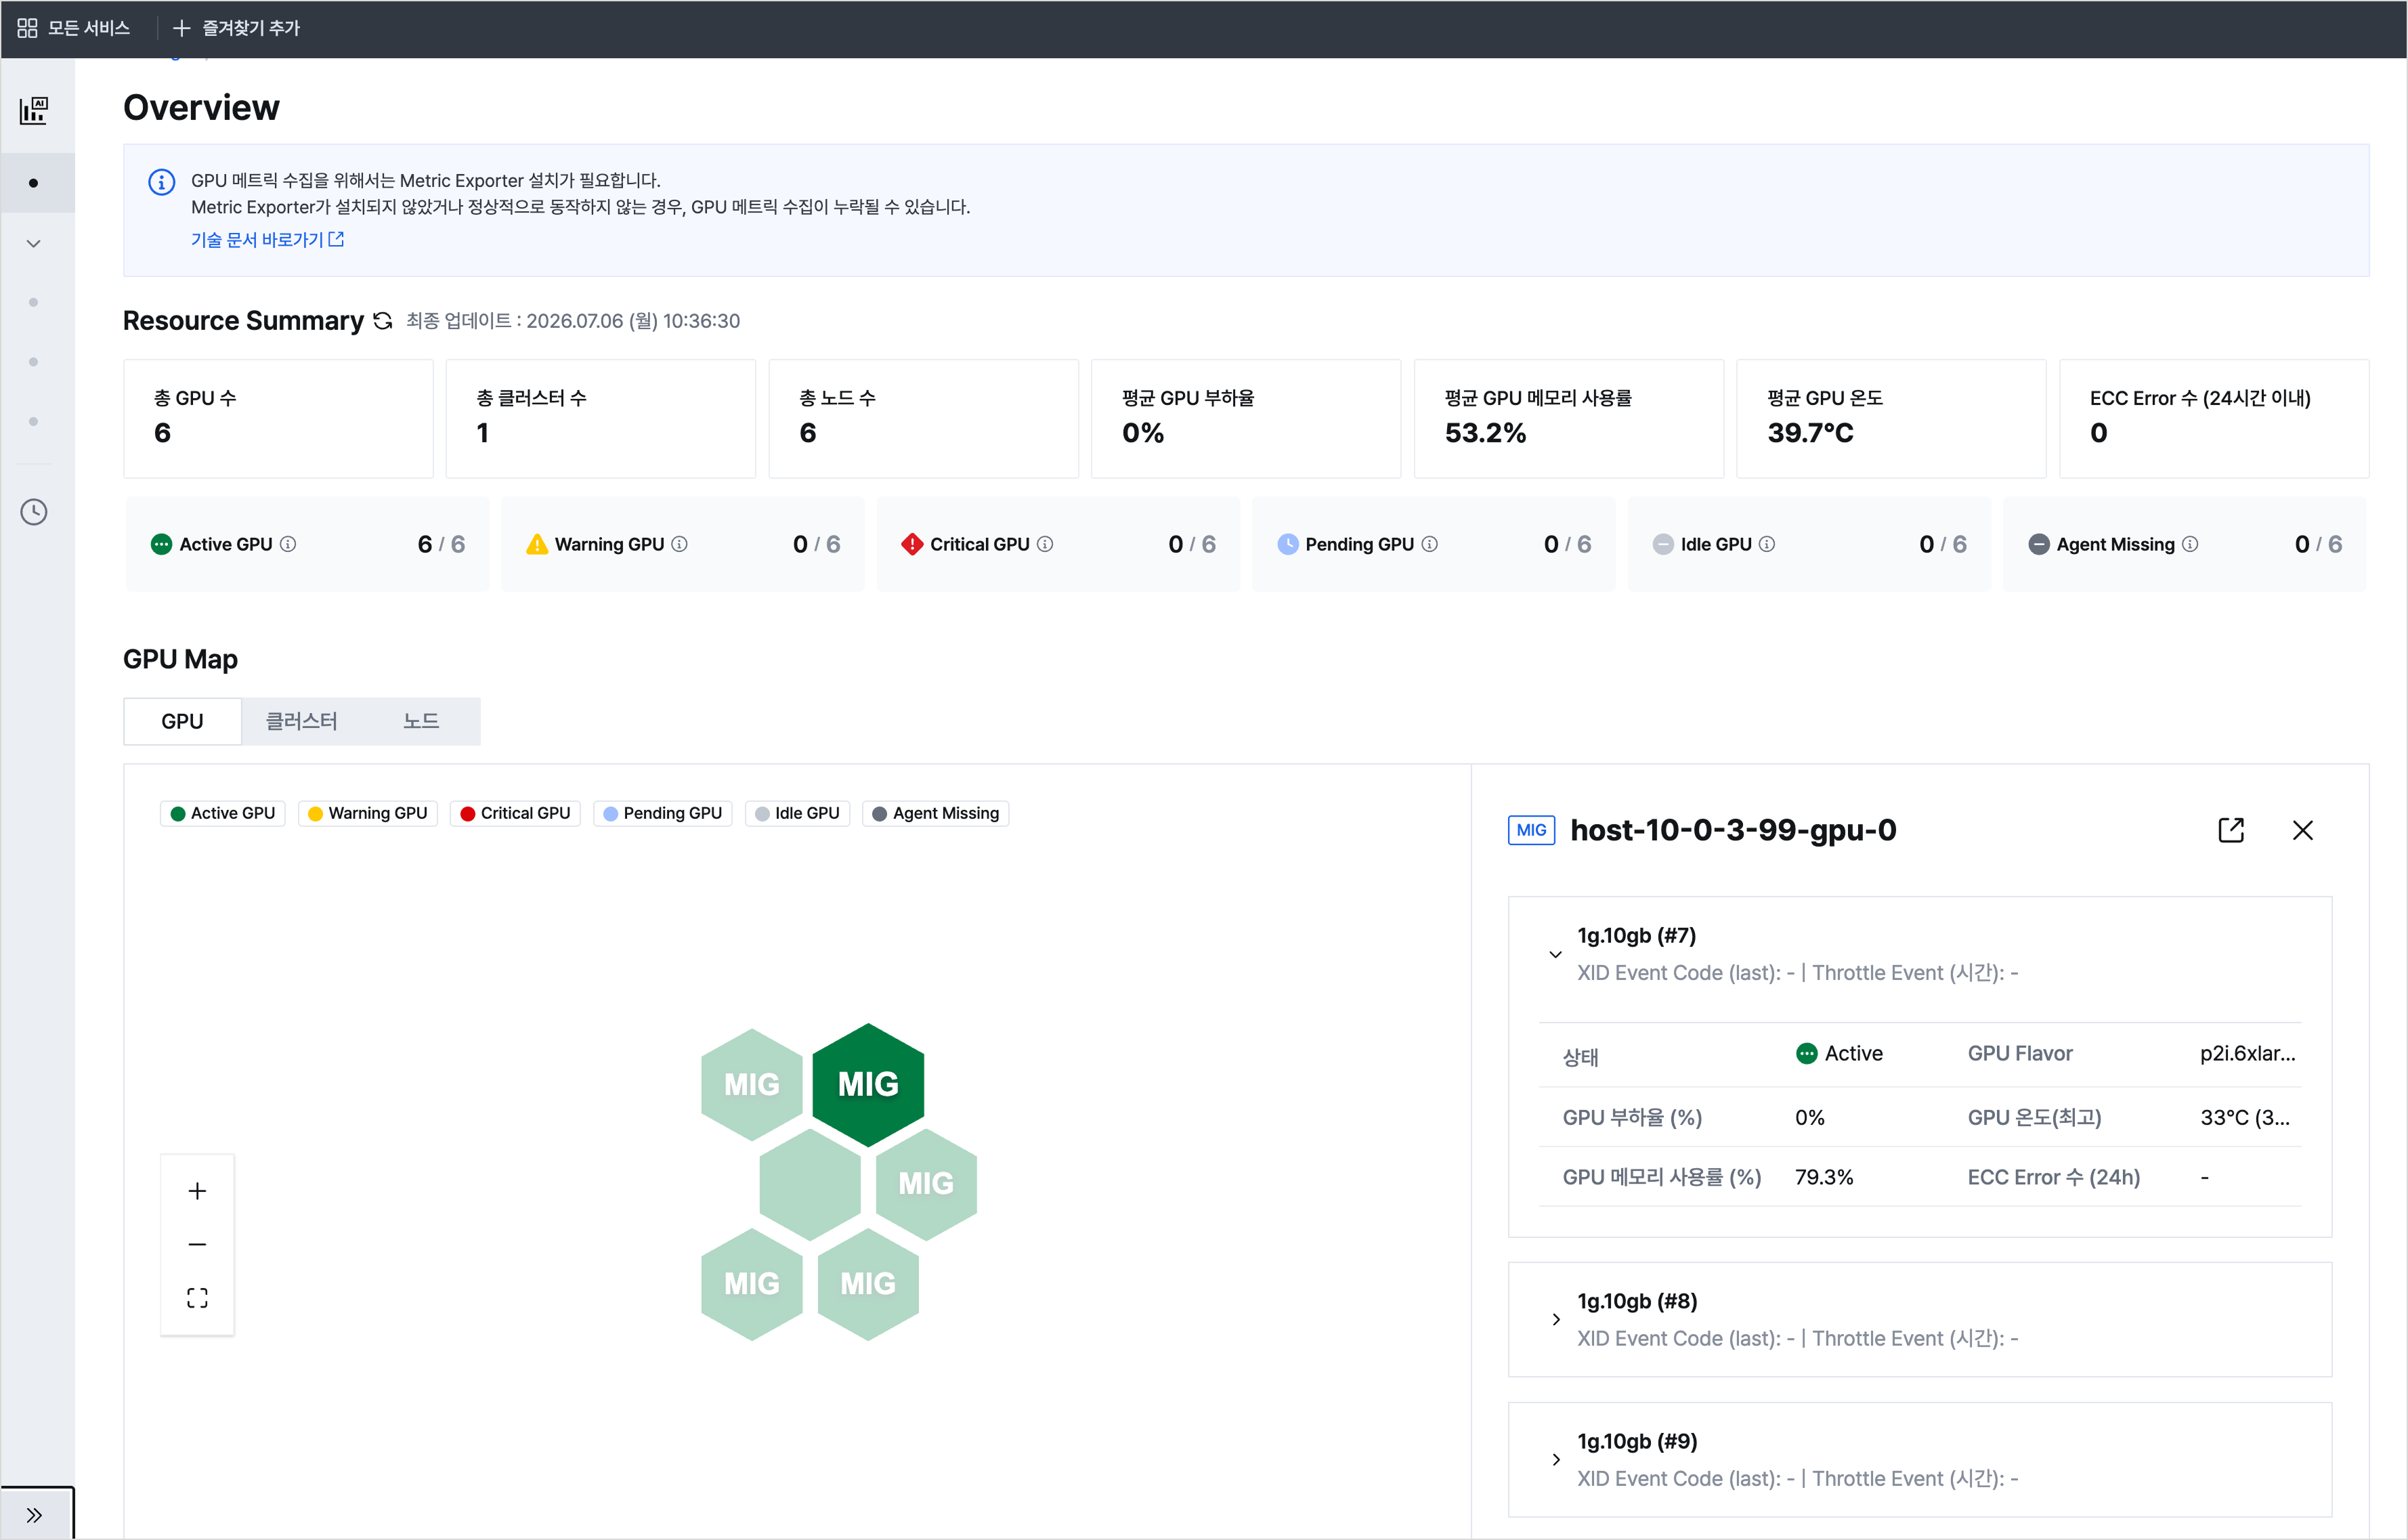
AI Insight shows the status of monitored targets as Active, Idle, Warning, Critical, Pending, and Agent Missing. It also provides the total number of GPUs, clusters, and nodes, as well as average utilization, average memory usage, average temperature, and the number of ECC errors, so you can quickly understand the operational status of resources supported in this release.

1 AI Insight > Overview

For example, you can answer questions such as:

  • How many of the total GPUs are currently being used normally?
  • Are any GPUs left idle after training jobs have completed?
  • Which GPUs require inspection because they are in Warning or Critical status?
  • Are there any resources where metric collection components are not working properly?

When you need to quickly narrow down targets with abnormal signs

As the number of resources under operation increases, it becomes difficult to find inspection targets by checking the full list one by one. AI Insight uses GPU Map to visualize resources by GPU, cluster, and node, and separates them by status.

In GPU Map, resources are distinguished by status color. When you select a specific GPU or MIG instance, you can immediately check key status and event information in the right panel.

Users can select resources in Warning or Critical status and immediately check GPU utilization, GPU memory usage, GPU temperature, ECC errors, XID event codes, throttle events, and more. This helps narrow down problematic resources first and then continue root cause analysis from the detail screen if needed.

When you need to analyze the cause by resource hierarchy

After identifying the target to inspect, you need to determine which layer the problem started from. The issue may come from the compute resource itself, or it may be a situation where CPU, memory, disk, or network bottlenecks on the execution node affect the workload.

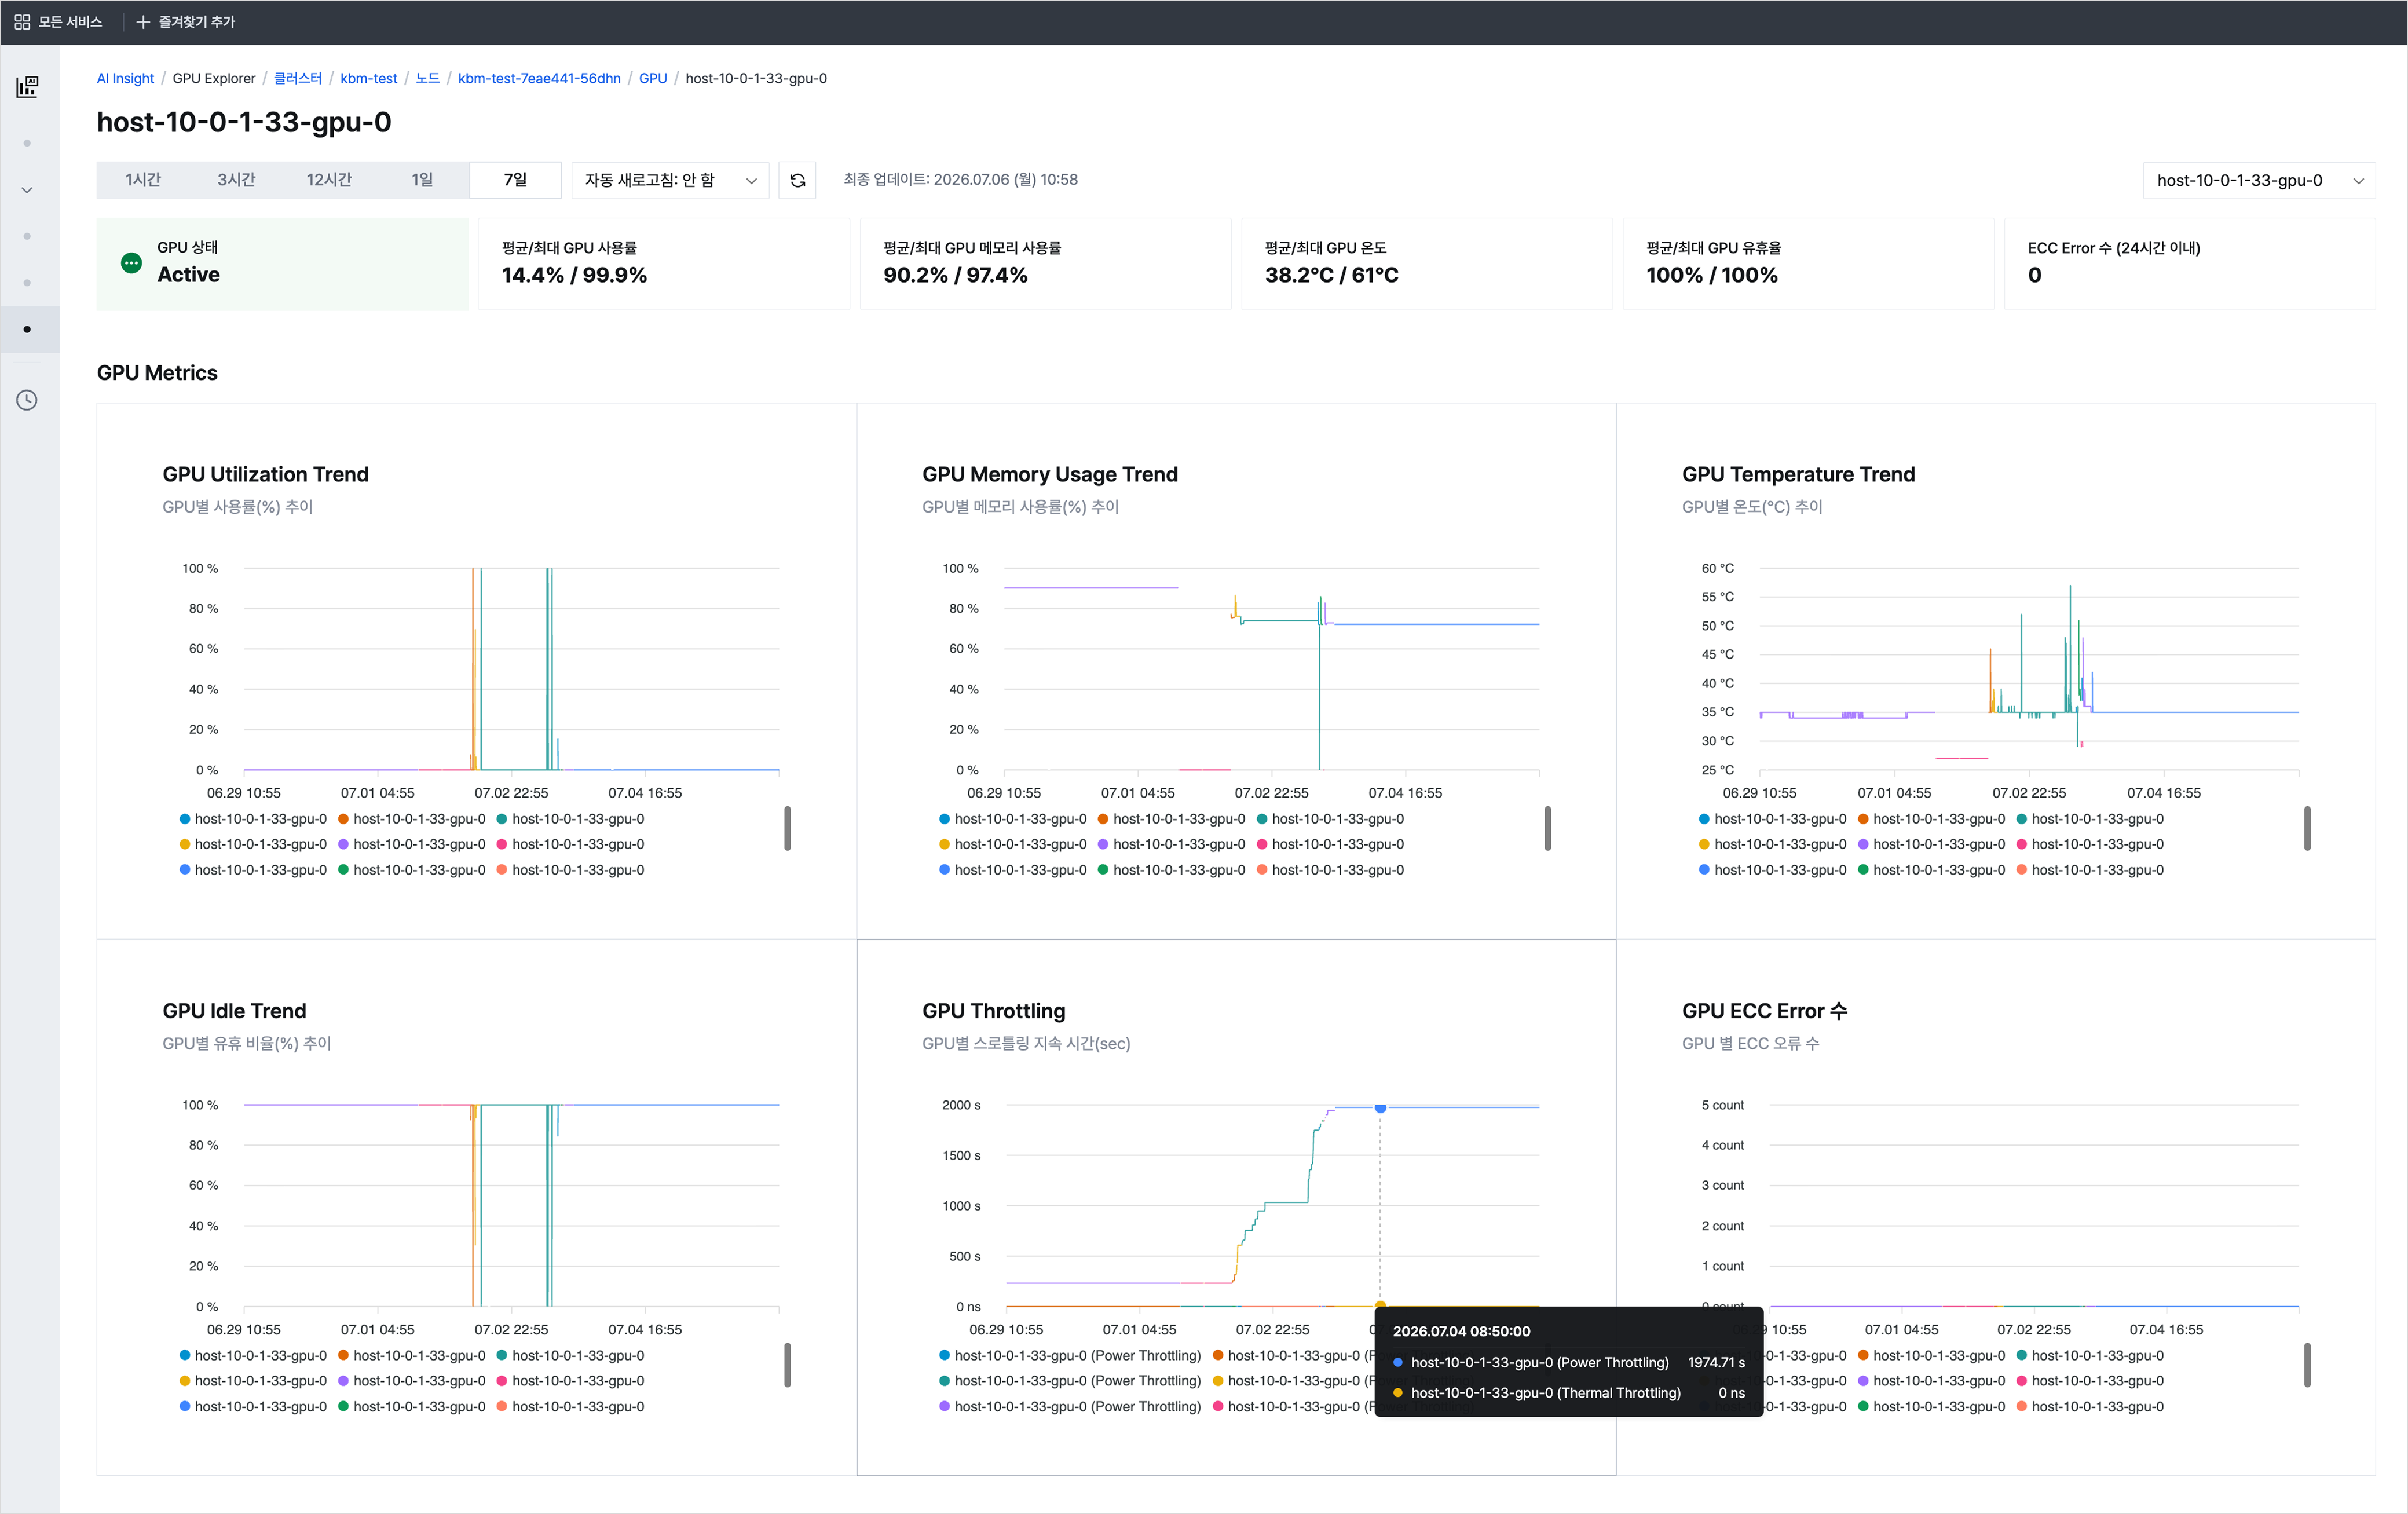
In this release, AI Insight provides detailed metrics at the cluster, node, and GPU levels to help narrow down the problem scope step by step. At the cluster level, you can compare overall resource patterns. At the node level, you can check CPU, memory, disk, and network status together. At the GPU level, you can review trends in utilization, memory usage, temperature, idle rate, throttling, and ECC errors for each GPU or MIG instance.

In GPU Explorer, you can view metric trends, anomalies, and correlations by time range based on the selected cluster, node, and GPU.

1 AI Insight > GPU Explorer > GPU monitoring


During this process, you can check whether only a specific resource shows a different pattern, whether any target has a high temperature compared to its utilization, or whether node system resource bottlenecks appear at the same time.

When you need to monitor multiple runtime environments with the same criteria

AI workloads can run on GPU nodes based on Kubernetes Engine or on GPU nodes based on Virtual Machine. Operators need to check GPU status and key metrics using the same criteria, regardless of the runtime environment.

AI Insight is designed to support both Kubernetes Engine (KE)-based GPU nodes and Virtual Machine (VM)-based GPU nodes.
After you install Metric Exporter or a monitoring agent in the target environment, AI Insight collects GPU metrics and displays them in the console.

However, if metric collection components are not installed or are not working properly, the corresponding resource may appear in Agent Missing status. In this case, refer to the Metric Exporter installation documentation and check the collection configuration first.

Expanding into an AI observability service

Starting with GPU monitoring, AI Insight helps users view the status of key resources required for AI workload operations at a glance and analyze the causes of abnormal signs more quickly.

As AI workloads become more complex, what operations need is not more information, but visibility: the ability to find the right information at the right time and identify causes quickly. Starting with AI Insight, KakaoCloud will continue expanding operational visibility across AI workloads and enhancing AI observability services.

👉 Learn more about AI Insight
👉 Start KakaoCloud now

Query Cloud Trail and DNS resolver logs with Data Query

· 6 min read
Erin (오예진)
Cloud Engineer
Tutorial new release

In production environments, logs are reference data for troubleshooting incidents and reviewing security. However, storing logs is not enough. To analyze operational issues and identify causes, you must be able to query the data quickly with the conditions you need. For logs that are repeatedly used for audits and diagnostics, it is especially important to consider the storage location, file structure, and query method from the beginning.

The two newly added tutorials explain how to use Data Catalog and Data Query to query and analyze operational logs stored in Object Storage with SQL.

Both documents use the same data analysis architecture, but they focus on different operational scenarios. One covers security auditing and change tracking based on user activity and resource change history. The other covers network diagnostics based on DNS query flows inside a VPC. Accordingly, the target logs are Cloud Trail logs and DNS resolver query logs.

Operational log storage -> Object Storage -> Data Catalog -> Data Query

Although the logs being analyzed are different, the workflow is the same: store logs in Object Storage, configure table metadata in Data Catalog, and query the data with SQL in Data Query.

This post looks at when each log is useful and how to analyze operational logs with SQL.

Cloud Trail logs: Reference data for checking resource change history

Cloud Trail records user activity and resource operation history in KakaoCloud as events. For example, you can check when a specific user logged in, which resources were created or modified, and which service generated an event. When these logs are connected to Data Query, you can answer common security audit and history tracking questions with SQL.

  • Which user changed which resource on a specific date?
  • Is there any operation history for a specific service or IP address?
  • Did create, update, or delete events occur for a specific resource?

The Query Cloud Trail logs with Data Query tutorial explains how to store Cloud Trail logs in gz format in Object Storage and configure Data Catalog and Data Query based on the project_event and domain_event paths. In this workflow, it is important to use partition columns such as date_id and hour_id as query conditions so that you only query the required period.

Because Cloud Trail logs are used for security audits and change tracking, it is better to narrow the query by conditions such as when, from which service, by whom, and for which resource, rather than scanning all logs at once.

DNS resolver query logs: Check DNS queries and responses inside a VPC

DNS resolver query logs record DNS query and response information generated inside a VPC. You can check which domains an application queried, whether responses were normal, and whether failed responses were concentrated in a specific time period. With Data Query, you can answer operational questions such as:

  • Which domains were queried most on a specific date?
  • During which time periods were non-NOERROR responses concentrated?
  • Did a specific VPC query a specific domain unusually often?
  • Are DNS queries with long response times recurring?

The Query DNS resolver query logs with Data Query tutorial configures tables based on the Object Storage path structure KCLogs/{region-name}/{year=yyyy/month=mm/day=dd} used by DNS resolver query logs. It then shows how to synchronize the year, month, and day partitions in Data Query and aggregate query counts or failed response counts by domain.

DNS logs are useful not only for network incident analysis, but also for checking external dependencies of internal services, unexpected domain queries, and repeated failed responses. If Cloud Trail shows the history of users and resource operations, DNS resolver query logs show how applications inside a VPC perform name resolution.

Why the two tutorials use the same pattern

Cloud Trail logs and DNS resolver query logs have different characteristics, but operators handle them in similar ways.

First, logs are stored in Object Storage. Next, metadata is configured in Data Catalog based on file paths and partition structures. Finally, Data Query uses SQL to query the logs with conditions such as specific periods, services, users, domains, and response codes.

After this common pattern is established, you can reuse the same flow of storage location, metadata configuration, and SQL querying even when the analysis target changes.

StepCloud Trail logsDNS resolver query logs
Storage locationObject StorageObject Storage
Main pathtrail/project_event, trail/domain_eventKCLogs/{region-name}/{year=yyyy/month=mm/day=dd}
Main partitionsdate_id, hour_idyear, month, day
Main analysis focusUser activity, resource changes, service eventsDomain queries, DNS response codes, VPC-specific query patterns
Query toolData QueryData Query

This structure helps manage operational log analysis in a consistent way. Instead of learning different query languages and storage structures for each separate tool, you can standardize the query flow around Object Storage, Data Catalog, and Data Query.

How to start operational log analysis

If you need to retain operational logs for a long time and query them when necessary, we recommend reviewing both tutorials together. For example, when an incident occurs during a specific time period, you can check resource change history with Cloud Trail logs and also review DNS query failures or response delays from the same time period with DNS resolver query logs. When logs with different characteristics can be queried in the same way, it becomes easier to interpret individual events in a broader operational context.

KakaoCloud technical documentation provides various tutorials based on practical operational scenarios. Use the following documents to learn how to store operational logs, configure them in a queryable form, and analyze them step by step with the conditions you need.

👉 Query Cloud Trail logs with Data Query
👉 Query DNS resolver query logs with Data Query

Get started with Infinite File Storage, a shared file system without fixed capacity limits

· 7 min read
Martin (왕현수)
Service Manager
Infinite File Storage

As services grow, operating file storage becomes more than simply securing enough capacity. Multiple servers need to read and write the same files, access methods vary by operating system, and data must be separated by team or application. When rapidly growing data is added to the equation, an operating plan based on a fixed storage capacity can quickly reach its limits.

Infinite File Storage, newly added to KakaoCloud File Storage, is a scalable shared file system designed for these environments. You can create multiple shared volumes in a single file system, and both SMB and NFS protocols are supported so files can be shared across various client environments, including Windows, Linux, and macOS.

note

As of May 2026, Infinite File Storage is provided as Beta. During the Beta period, some features, availability, and operating policies may change. Before applying it to a production environment, check the latest documentation and service announcements.

Why do you need a shared file system?

File-based workloads remain essential to many services. This is because many types of data must preserve file and directory structures, such as user-uploaded content, documents managed by operations teams, application logs and analytics data, and configuration files referenced by multiple servers.

If this data is distributed across each server's local disk, operational complexity increases. File replication or synchronization between servers becomes necessary, and it is difficult to consistently manage the latest file state and access permissions. Especially in environments where multiple Virtual Machine instances or Kubernetes Engine clusters need to use the same data, a shared file system can significantly reduce operational burden.

Key features of Infinite File Storage

Infinite File Storage is a file system focused on operating according to actual usage and sharing structure, rather than creating storage after estimating a large capacity in advance.

1. Scalable structure without fixed capacity limits

An Infinite file system is provided as a scalable structure that can be used without a fixed storage size limit. It is suitable for services where data growth is difficult to predict, or environments where file storage volume fluctuates greatly during specific periods such as events or seasons. You can reduce the burden of allocating excessive spare capacity or repeatedly planning expansions whenever storage runs low. Because billing is also based on actual usage, you can manage the cost structure more flexibly.

2. Simultaneous support for SMB and NFS

Infinite File Storage provides SMB and NFS file services. You can use NFS for Linux/UNIX-based servers and SMB for Windows-based environments, choosing the protocol that fits the operating system and workload characteristics.

  • NFS: Suitable for configuring shared volumes for Linux servers, Kubernetes Engine workloads, analytics, and batch applications. For the mount procedure, see Mount an NFS file system.
  • SMB: Suitable for Windows-based work environments and user- or group-based file sharing integrated with Active Directory. For the mount procedure, see Mount an SMB file system.

SMB file systems can be configured for user- and group-level permission management based on Active Directory integration, making them useful for collaborative storage within an organization or department-specific shared folders.

3. Manage multiple shared volumes in one file system

In Infinite File Storage, you can create multiple shared volumes in a single file system. A shared volume is a logical storage unit used to separate data by service or application, and each volume provides an independent access point. For how to create and configure permissions, see Manage shared volumes.

For example, you can divide volumes in one Infinite file system as follows.

Shared volumeExample use
content-prodStore production content used by a service
content-stageStore content for review and staging environments
analytics-inputStore source files used for analytics jobs
team-shareShared folder for an operations team or collaborating organization

With this configuration, you can operate one file system while separating data boundaries and access paths by workload.

4. Access control by file service type

An important part of a shared file system is "who can access it, from where, and with what permissions." Infinite File Storage provides different access control methods depending on the file service type.

  • NFS: Configure access permissions based on IP addresses or IP ranges
  • SMB: Configure shared volume access permissions by user or group

For NFS-based workloads, you can restrict the access scope based on the IP addresses of application servers or Kubernetes Worker Nodes. To use it as a dynamic persistent volume in Kubernetes, also see Configure NFS Client Provisioner. For SMB-based workloads, you can control shared folder access based on your organization's user and group permission policies.

Comparison of the two file systems

KakaoCloud File Storage provides Infinite file systems and Basic file systems depending on the use case. Both are shared file systems, but they are suited to different operating models.

CategoryInfinite file systemBasic file system
Capacity structureScalable structure without fixed limitsBased on capacity configured in advance, up to 16 TiB
Billing methodBased on actual used capacityBased on created capacity
ProtocolsSMB, NFSNFS
Sharing structureMultiple shared volumes can be created in one file systemOperated by file system
Access controlSMB account-based, NFS IP-basedNFS IP-based
Suitable environmentEnvironments where data growth is difficult to predict and multiple shared volumes and multi-OS access are requiredEnvironments that need to operate an NFS-based file system reliably within a fixed capacity

If you need to set capacity in advance and operate simply based on NFS, Basic file system is suitable. Conversely, if data growth is difficult to predict, or you need multiple shared volumes and the option to use SMB or NFS, consider Infinite file system.

Things to check before you start

Before adopting Infinite File Storage, review the following items first.

  • Client operating system and protocol: Prioritize NFS for Linux/UNIX systems and SMB for Windows-based environments.
  • Network access path: Check whether the Virtual Machine instances, Kubernetes Worker Nodes, and Windows clients that access the file system can communicate in the same network environment.
  • Access control criteria: Design policies based on IP addresses for NFS and user or group permissions for SMB.
  • Shared volume separation criteria: Decide how to divide shared volumes by service, environment, team, and data type.
  • File operation patterns: Design the directory structure to avoid large-scale file creation and deletion, recursive commands, or excessive concentration of files in a single directory.

Before creating an SMB file system, you must also check the prerequisites for Active Directory integration. A domain name, DNS server, service account with domain join permissions, network ports, and other items are required. See SMB file system prerequisites and File system service ports.

Wrap-up

Infinite File Storage Beta is a new option for operating file-based workloads more flexibly. Its scalable structure without fixed capacity limits, usage-based billing, support for SMB and NFS, multiple shared volumes, and access control features can be applied to service data sharing, collaborative storage, Kubernetes shared volumes, and file-based analytics data storage.

For detailed concepts and usage, see the File Storage documentation.

Thank you.

👉 Start KakaoCloud now

MySQL 8.4 changes and pre-upgrade checklist for engine upgrades

· 7 min read
Kate (김소희)
Service Manager
MySQL

The MySQL 8.0 series reached its official End of Life (EOL) at the end of April, and security updates and technical support are expected to end going forward. To strengthen service stability and security, KakaoCloud recommends upgrading the engine to MySQL LTS (Long Term Support) 8.4, and supports MySQL Engine Update work through the Maintenance service.

All instance groups currently using the MySQL 8.0 engine can upgrade their engine to version 8.4 by specifying the desired date and time directly. However, because this is a major version update, technical review such as backward compatibility and system variable changes must be performed before the actual work.

Therefore, in this post, we share the major changes and key checklist items that must be reviewed for stable service operation before updating from MySQL 8.0 to the 8.4 series.


Major changes in the MySQL 8.4 series

The 8.4 LTS version includes various default value changes and feature improvements for performance optimization and stronger security.

1. Default authentication plugin changed

The previously used mysql-native-password has been removed, and caching_sha2_password has been set as the default authentication plugin (password plugin).

note

If you need to keep another authentication method or require additional settings, adjust parameters by referring to the official authentication_policy documentation.

2. Parameter default value changes

The table below is excerpted and translated from the official MySQL documentation. In the 8.4 LTS version, default values for major parameters have been significantly changed to maximize system performance.

In particular, resource allocation methods such as InnoDB I/O capacity and log buffer size have been optimized for modern hardware specifications, so be sure to compare them with existing settings before upgrading. For detailed instructions on creating and managing parameter groups, see the separate documentation.

Performance and I/O related changes

ParameterMySQL 8.4MySQL 8.0
innodb_io_capacity10000200
innodb_io_capacity_max2x innodb_io_capacity    Same (minimum default 2000)
innodb_flush_method (Linux)O_DIRECT (fsync if unsupported)fsync
innodb_use_fdatasyncONOFF
innodb_read_io_threads1/2 of logical processors (minimum 4)4
innodb_parallel_read_threads1/8 of logical processors (minimum 4)4

Memory and buffer management

ParameterMySQL 8.4MySQL 8.0
innodb_buffer_pool_instancesinnodb_buffer_pool_size 1 GiB or less1
Over 1 GiB → Automatic calculation based on CPU/chunk (1~64)    
8 (1 if less than 1 GiB)
innodb_log_buffer_size64 MiB (67,108,864)16 MiB (16,777,216)
innodb_buffer_pool_in_core_fileOFF if MADV_DONTDUMP is supported; otherwise ONON
innodb_numa_interleaveONOFF

InnoDB behavior changes

ParameterMySQL 8.4MySQL 8.0
innodb_change_bufferingnone (not used)all
innodb_adaptive_hash_indexOFFON
innodb_page_cleanersSame as innodb_buffer_pool_instances    4
innodb_purge_threadsLogical processors ≤ 16 → 1
Over 16 → 4
4

Doublewrite and log handling

ParameterMySQL 8.4MySQL 8.0
innodb_doublewrite_files22x innodb_buffer_pool_instances
innodb_doublewrite_pages128      innodb_write_io_threads value (default 4)

Automation and server settings

ParameterMySQL 8.4MySQL 8.0
--innodb-dedicated-serverWhen enabled, no flush_method change
Redo log capacity calculation method changed from memory-based to CPU-based    
OFF

TempTable behavior changes

ParameterMySQL 8.4MySQL 8.0
temptable_max_ram3% of total memory (automatically adjusted within 1~4 GiB)    1 GiB (1,073,741,824)
temptable_max_mmap0 (not used)1 GiB
temptable_use_mmapOFFON

3. Automatic histogram update feature added

An automatic histogram update feature for query optimization has been added. In previous versions, histograms had to be updated manually through ANALYZE TABLE, but starting with MySQL 8.4, they are updated automatically depending on conditions.

For detailed application methods, see the ANALYZE TABLE documentation.

4. Replication SQL syntax changed

Replication-related terms have changed from MASTER/SLAVE to SOURCE/REPLICA, and major SQL syntax has changed as follows.

MySQL 8.4MySQL 8.0Function
SHOW BINARY LOG STATUSSHOW MASTER STATUSBinary log position that is the current server's start position (file name, position)
SHOW BINARY LOGSSHOW MASTER LOGSList of binary log files in the server
SHOW REPLICA STATUSSHOW SLAVE STATUSDetailed replication status (IO/SQL threads, delay, and more)
SHOW REPLICASSHOW SLAVE HOSTSList of replicas connected to the current server

Required checklist for a stable upgrade

To prevent server, authentication, and application-related failures that may occur during the upgrade process, be sure to check the following items in advance.

1. MySQL Shell Upgrade Checker

Before upgrading, it is important to use the MySQL Shell utility to carefully review resource compatibility. This tool automatically analyzes the following items and diagnoses stability.

  • Check server settings and schema structure
  • Check compatibility of running SQL queries
  • Detect removed features and conflicts with new reserved words

Through these checks, deprecated options and similar items can be identified in advance, effectively preventing server startup failures or unexpected feature errors that may occur immediately after the upgrade.

2. Check authentication plugin compatibility

When upgrading the MySQL version, the database's default authentication method may change, so authentication plugin compatibility in the current application environment must be checked. In older environments that do not support the latest plugins, login failures may occur immediately after the upgrade.

In particular, check whether the environment supports the latest plugins such as caching_sha2_password. If unsupported, login itself may fail, so you must check the authentication plugin for user accounts in advance and determine whether driver upgrades or plugin changes are needed.

3. Pre-check MySQL Connector (driver)

You must check compatibility between the MySQL connector used by the application and the server version in advance.
Language-specific drivers such as MySQL Connector/J are affected by server version in terms of authentication, protocol, and option compatibility. If old drivers are used, issues such as connection failures, TLS errors, or abnormal query behavior can occur, so driver compatibility must be checked in advance and replaced with the latest version if necessary.


So far, we have reviewed the need to upgrade to MySQL 8.4 LTS following the end of support for MySQL 8.0, the major changes, and the required checklist for a successful transition.

A major version upgrade is more than a simple engine replacement. It is an important opportunity to maximize modern hardware performance and strengthen the security system. However, because there are significant technical changes such as authentication method and driver compatibility, we recommend carefully reviewing them using the MySQL Shell Upgrade Checker and the pre-check guide introduced above.

KakaoCloud is working to provide the optimal environment and technical support so that customers' databases can operate stably without interruption. We hope this post helps you operate services safely. If you have any questions or need support, please contact us anytime through the Helpdesk.

Thank you.

KakaoCloud service updates - VM and Hadoop performance improvements, IAM security settings, and more

· 4 min read
Mia (정혜원)
Technical Contents Manager
update

This year, KakaoCloud is continuing to move forward without pause to provide users with a more convenient and secure cloud environment. With the warm arrival of spring, we are sharing a roundup of major service updates from March.

If the recently announced user-centered console renewal was a major change to screen structure and experience (UX), this post focuses on service feature enhancements that strengthen the foundation. Along with work to improve system stability, review the details of this update, which further improves resource management efficiency and security.


🖥️ Infrastructure management efficiency and service scalability

  • GPU service integrated into Virtual Machine (VM): For more intuitive resource management, the previously separate GPU service has been integrated into the Virtual Machine service.

    • Integrated environment provided: You can now select and manage general instances and GPU instances within the same workflow when creating a VM.
    • Automatic notification policy conversion: As part of the service integration, Alert Center notification policies previously configured in the GPU service have been safely and automatically converted into Virtual Machine service policies. You can continue using the existing monitoring environment without separate reconfiguration.
  • Virtual Machine supports "start credits" for t1i instances: To improve workload processing efficiency, the start credit feature has been added to t1i, a burstable instance type. Instances can now temporarily maintain high CPU utilization during boot, dramatically improving initial startup speed.

  • Hadoop Eco expands node volume size up to 16 TB: To support large-scale data analysis, the maximum volume size per node (master, worker, task) in Hadoop Eco has been significantly increased from 5 TB to up to 16 TB. Analyze larger volumes of data without storage constraints.

  • Object Storage product name changed: To make it easier for users to recognize the storage services they are using, Object Storage product names have been changed as follows. Pricing remains the same, and changes will be applied sequentially starting with March billing statements.

    • Data capacity: Hot Bucket → Standard Storage Class
    • API calls: The Standard- prefix is added before existing request names (for example, Standard-PUT, Standard-GET, and so on)

🔑 Security enhancements

  • IAM security settings enhanced: To protect valuable organizational resources, various security settings have been added to Account settings and IAM service items in the console.

    • Password reauthentication when deleting resources: When deleting a user account or project service account, a password reauthentication step has been added to prevent simple mistakes.
    • Immediate session and token expiration option: When changing a password, all currently logged-in sessions and issued access tokens can be invalidated immediately. This helps respond quickly to security incidents in emergency situations where account leakage is suspected.
    • Expanded Cloud Trail audit logs: 17 new event types have been added so that security policy and account management history can be tracked in more detail.

🛠️ Improved developer convenience

  • New OpenAPI support for MySQL: OpenAPI support for developers has been expanded further. With this update, MySQL OpenAPI has been newly added, allowing KakaoCloud MySQL to be controlled directly by API and used for management automation. For detailed OpenAPI updates, see OpenAPI Changelogs.

That is all for this update. In addition to the feature improvements introduced here, detailed changes for each service and previous update history can be found in the service-specific release notes in the technical documentation.

KakaoCloud will continue doing its best to provide stable infrastructure and user-centered features.
If you have any questions about using the service, please contact KakaoCloud Support anytime.

👉 Start KakaoCloud now

New KakaoCloud console released

· 8 min read
Sandy (차신영)
Technical Contents Manager
New console update

On March 13, 2026, a new console containing more than a year of intense collaboration and consideration was released. 🎉
"I want to preview as much information and as many features as possible on one screen." This one comment from a customer became the starting point for the major KakaoCloud console renewal.

This console renewal is significant because it is not simply a UI/UX redesign. It redesigned the entire KakaoCloud console, including performance structure, data processing methods, and screen design philosophy. A console that minimizes screen transitions, predicts and places needed features in advance, and reflects changes in real time is now possible in the new KakaoCloud console.

Reorganized as a data-centric console

The core of this renewal is that the new console has been reorganized based on the design principle of a data-centric console.
In the new console, information density has been precisely redesigned so operational efficiency does not decline even as service complexity increases.
Font size, letter spacing, and line height were optimized at the pixel level to remove unnecessary whitespace and create an environment where key indicators can be identified at a glance without scrolling.
In addition, rather than focusing on aesthetic design, design guidelines that prioritize data hierarchy and readability were applied so operators can maintain workflow and context among many resources.
Let's look at the major features changed in the new console.

Customizable dashboard

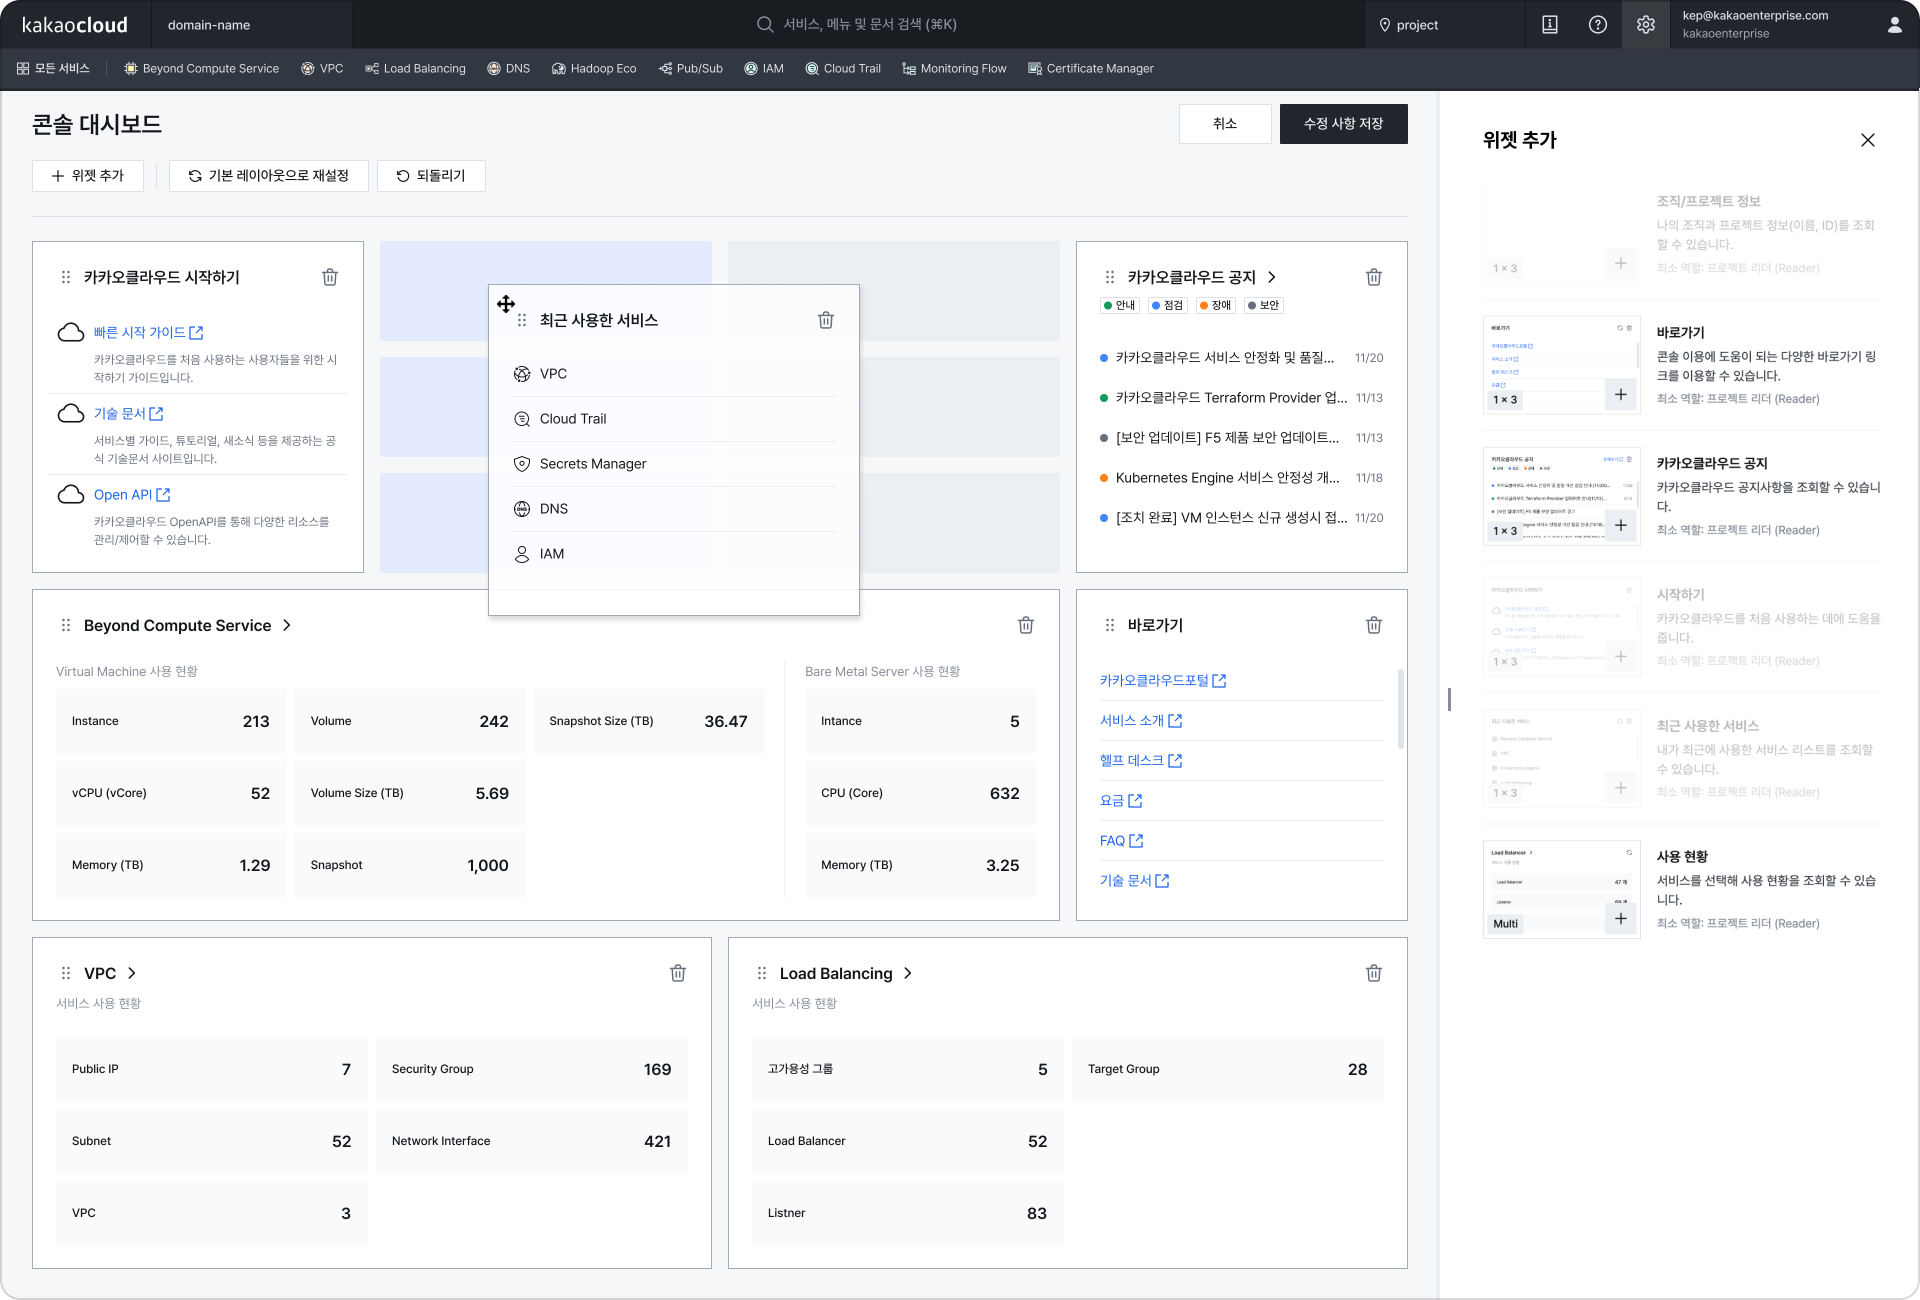
The first screen users enter after logging in to the KakaoCloud console is the dashboard. The previous dashboard provided only fixed information, making personalized configuration difficult. In the new console, the dashboard has been redesigned around widgets, allowing users to freely add, delete, or rearrange the information cards they need through drag and drop.
In particular, reflecting usage patterns of customers who use the console continuously as a monitoring screen, we completed a structure that lets users understand major service information or useful information at a glance from an operations perspective.

2 Widget-based dashboard configuration

Improved resource exploration experience

Screen convenience features for exploring resource information on one screen have also been greatly expanded.
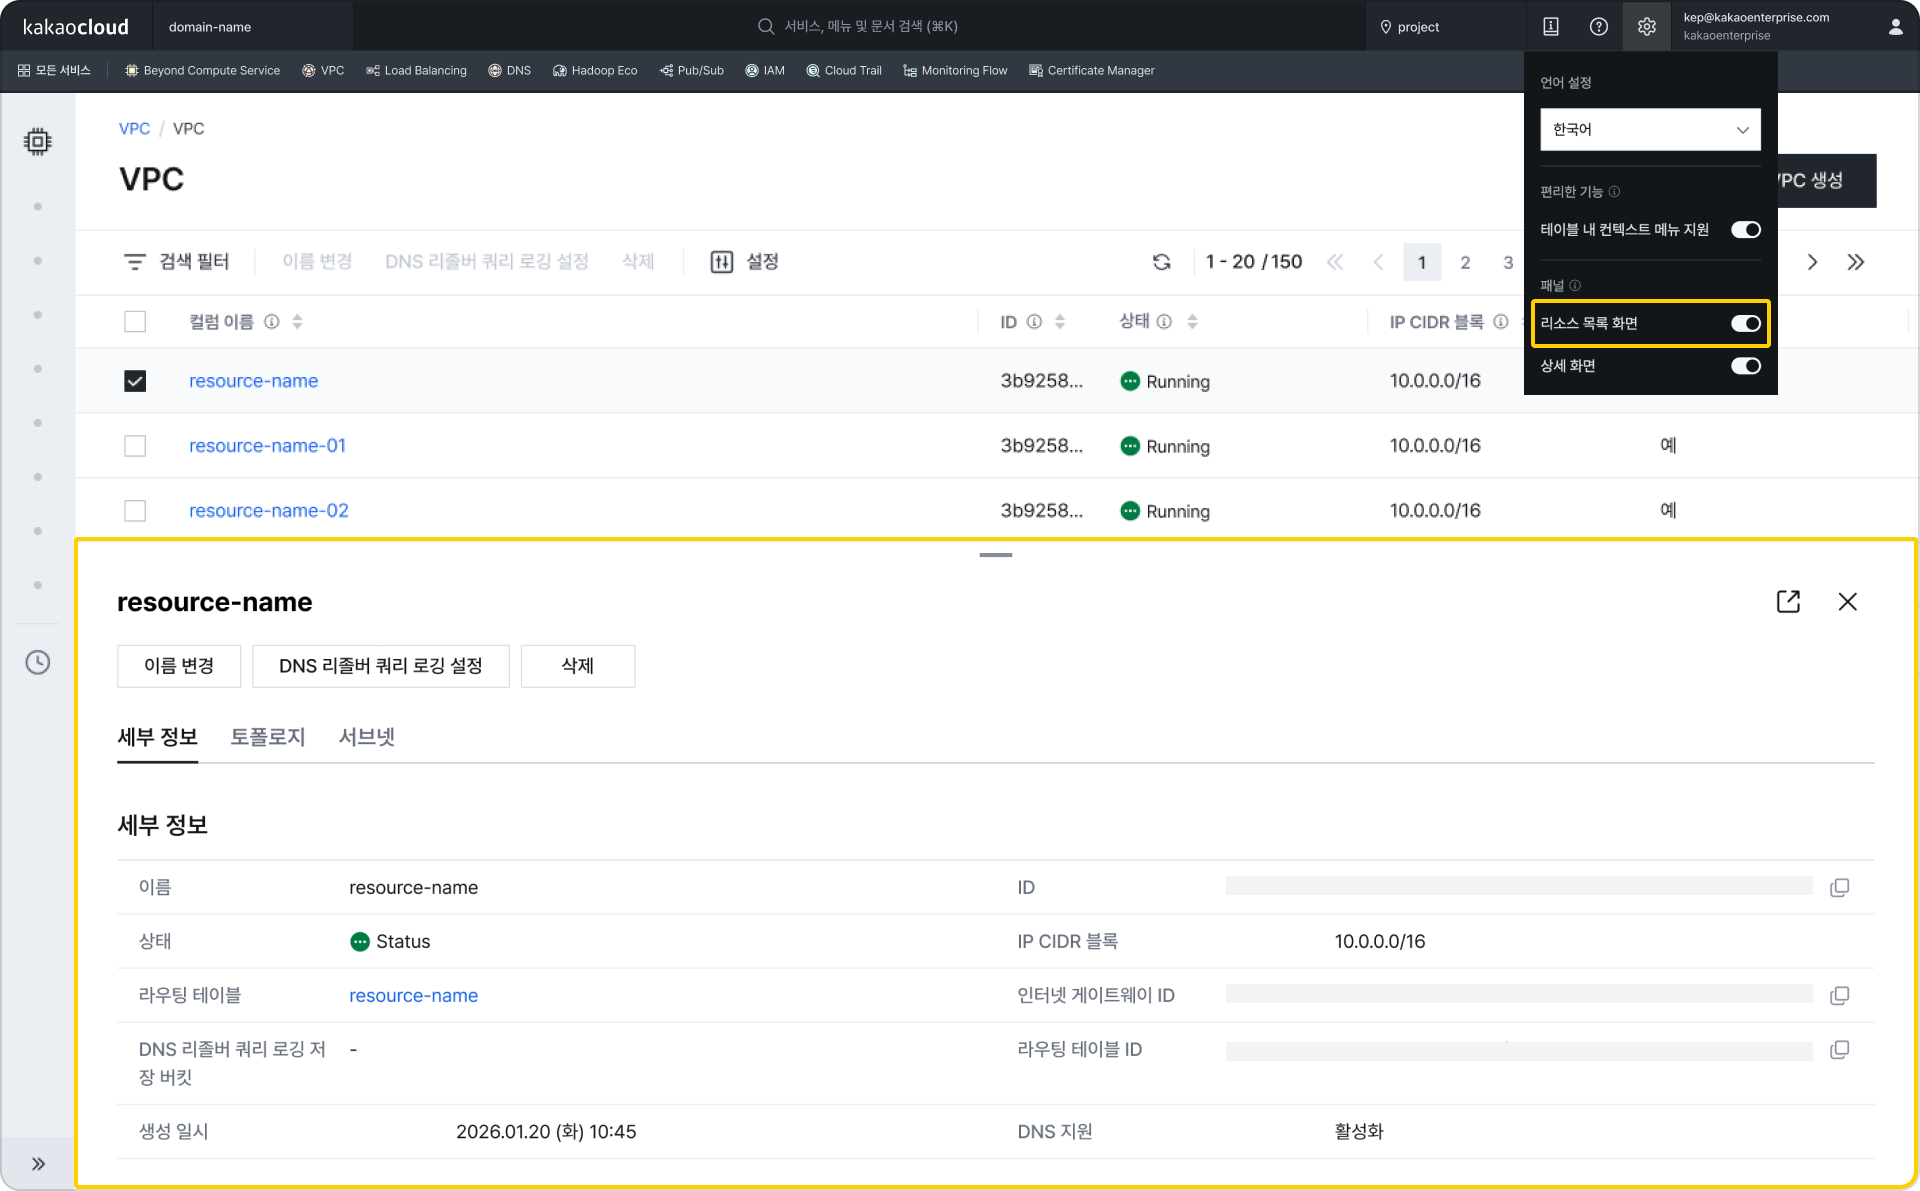
In the previous console, checking resource details required screen transitions each time a resource was selected, interrupting the workflow. In the new console, resource details can be checked immediately in the right panel or bottom panel without screen transitions.
This reduces the burden of screen transitions that occur when repeatedly exploring and checking details, and supports continuous workflows to improve operational efficiency.

3 Bottom panel display (when resource list screen option is enabled in Settings at the top right)
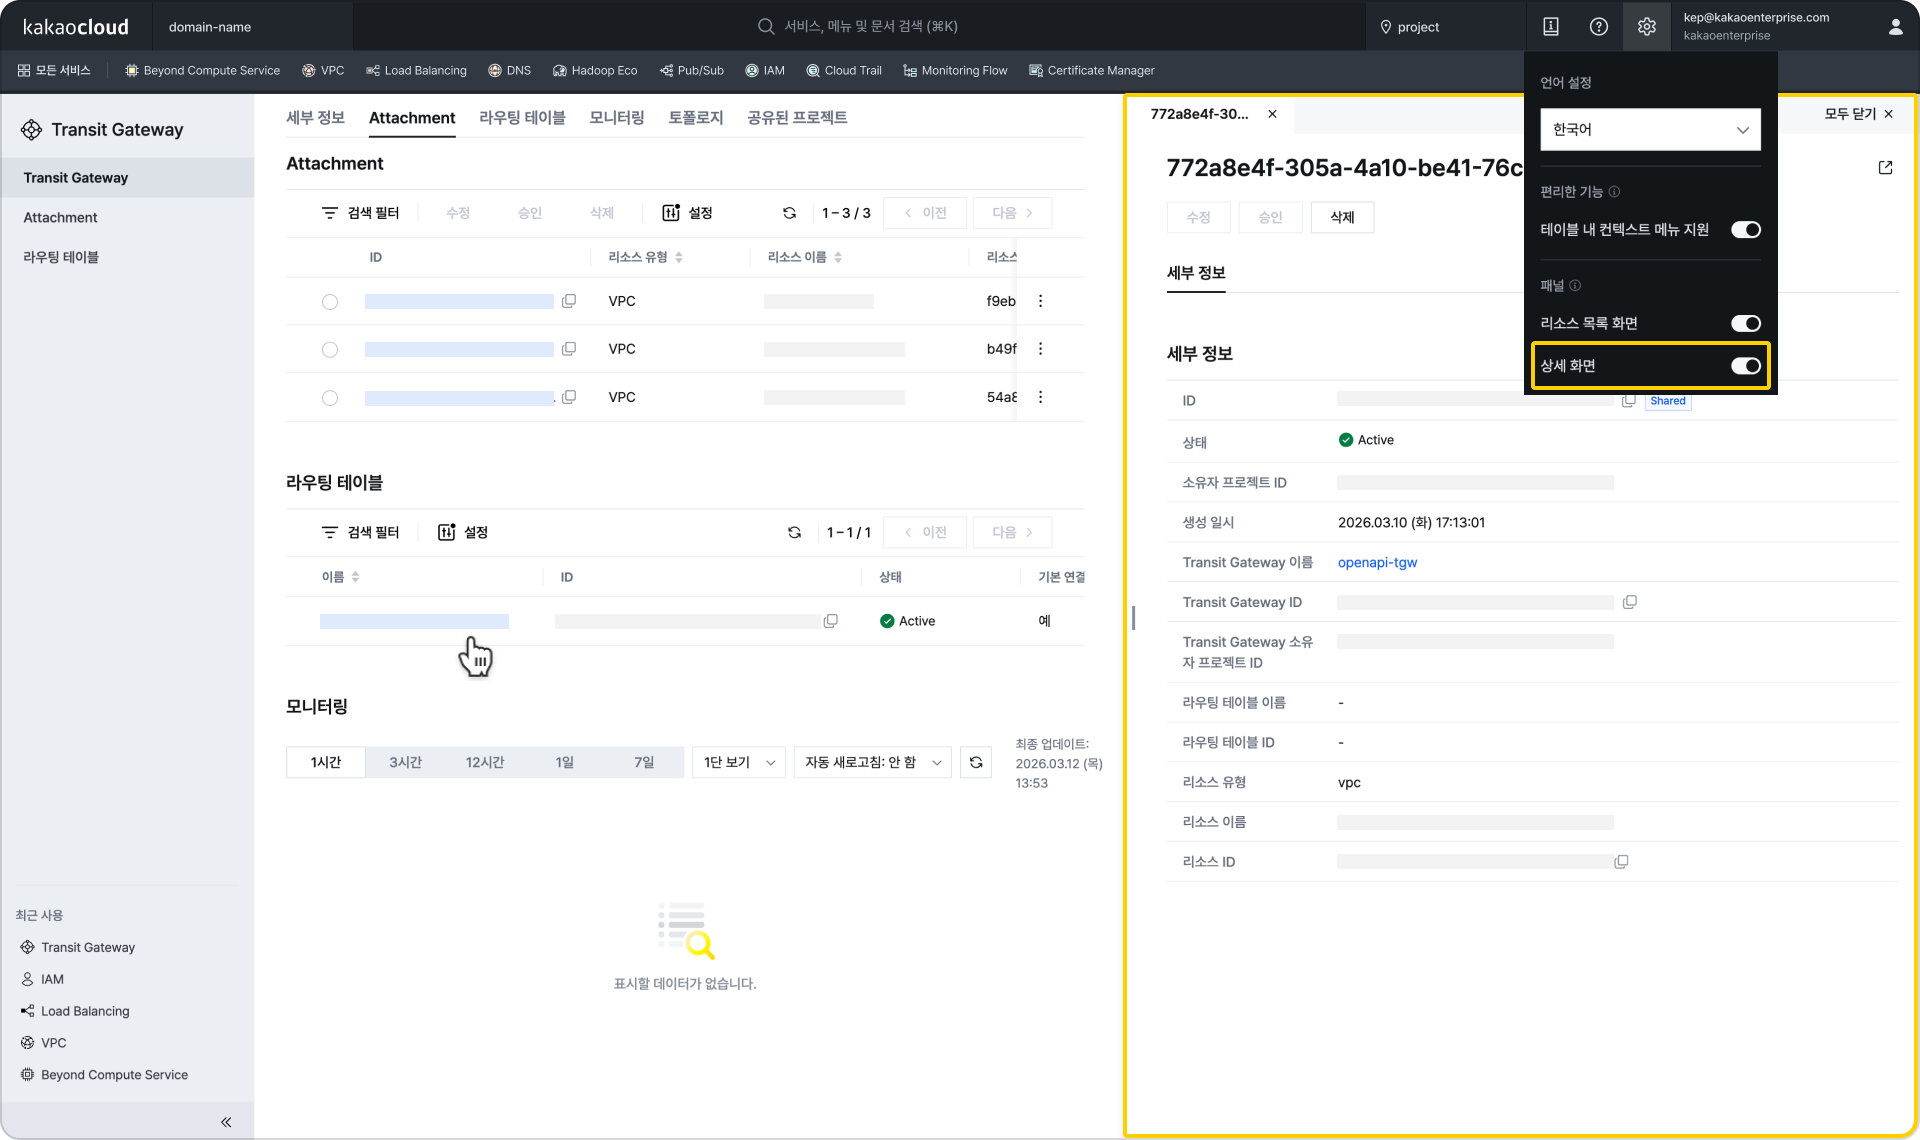
3 Right panel display (when detail screen option is enabled in Settings at the top right)
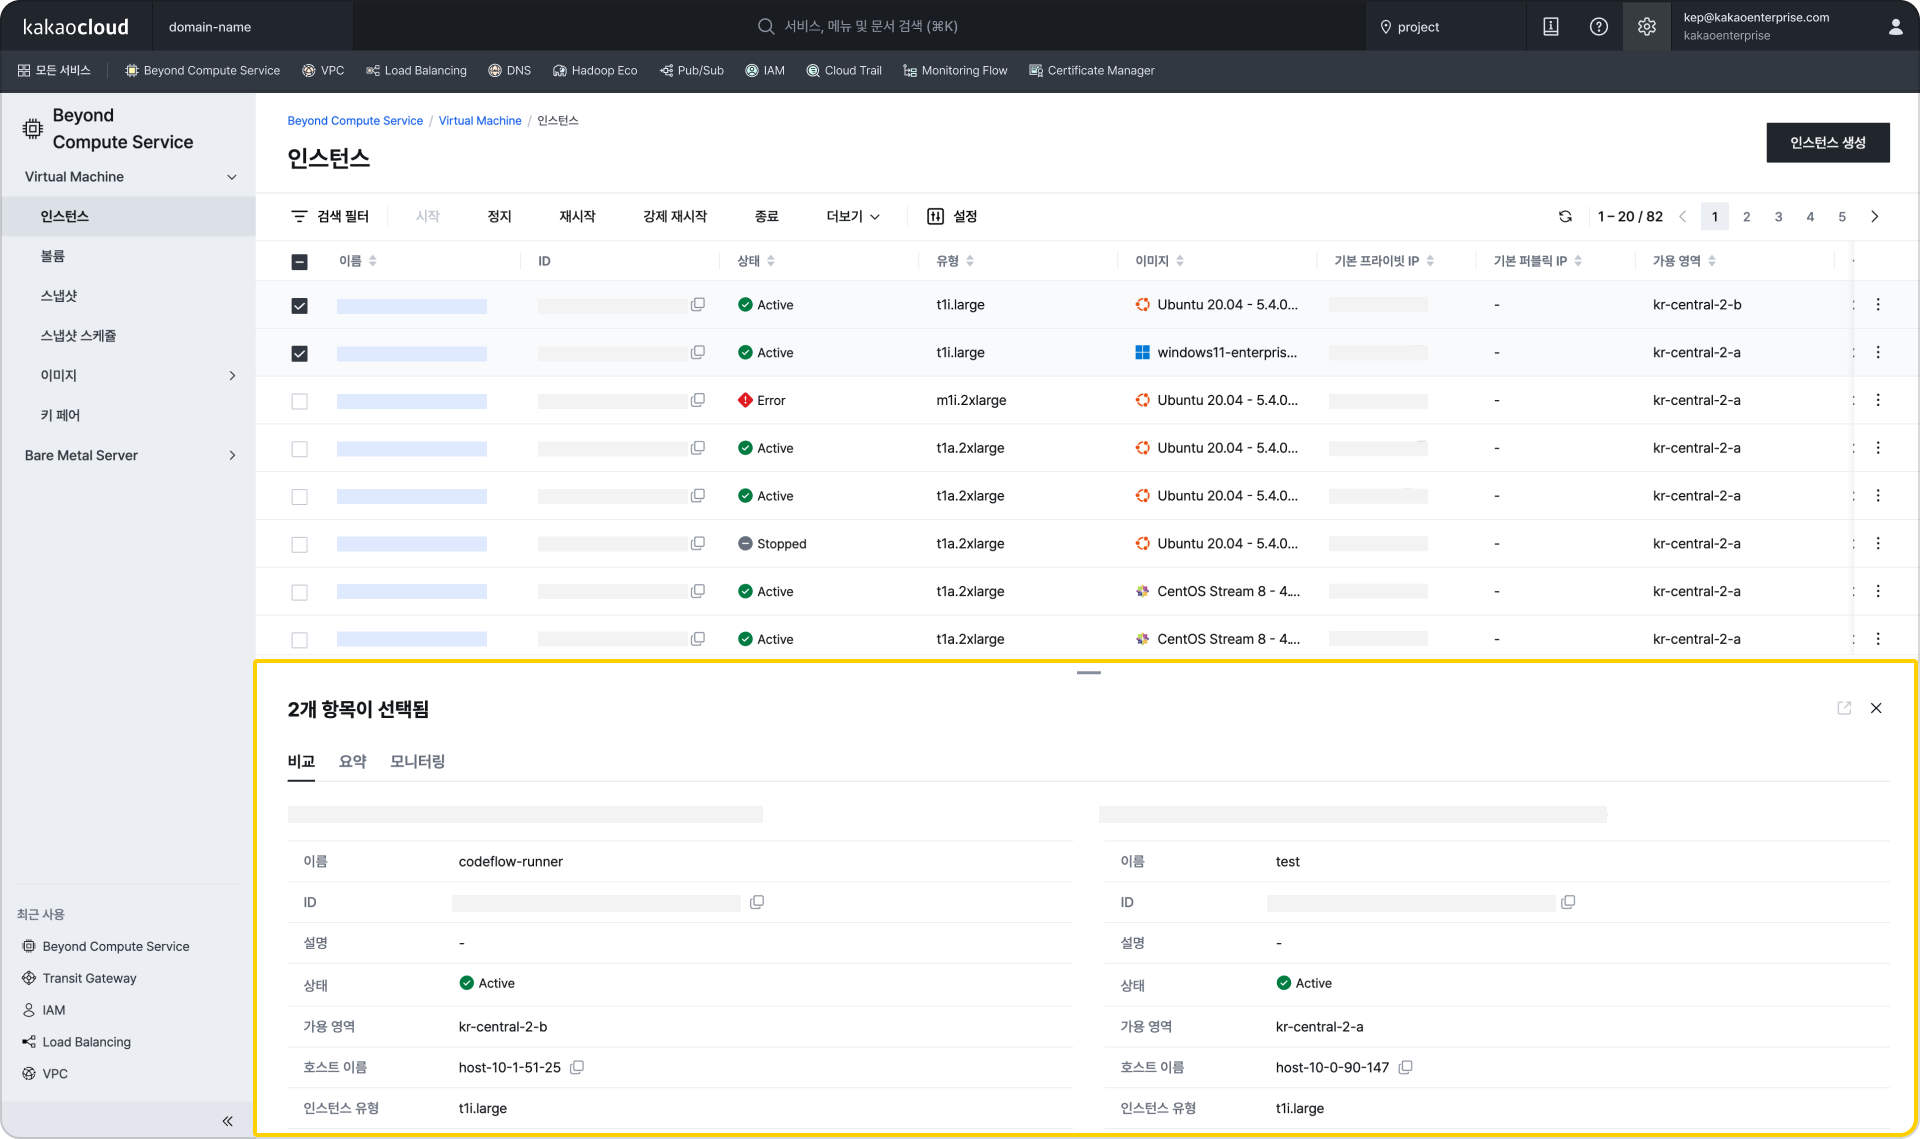
In addition, when you need to quickly compare multiple resources, you can compare and understand resource status information in the bottom panel. 3 View details in the bottom panel when two resources are selected
The resource details page viewing method has also been improved. Previously it used a tab structure with screen transitions, but the new console has changed to a full-scroll format so all information can be checked on one page. Anchor tabs are provided at the top so users can quickly move to the desired information area.

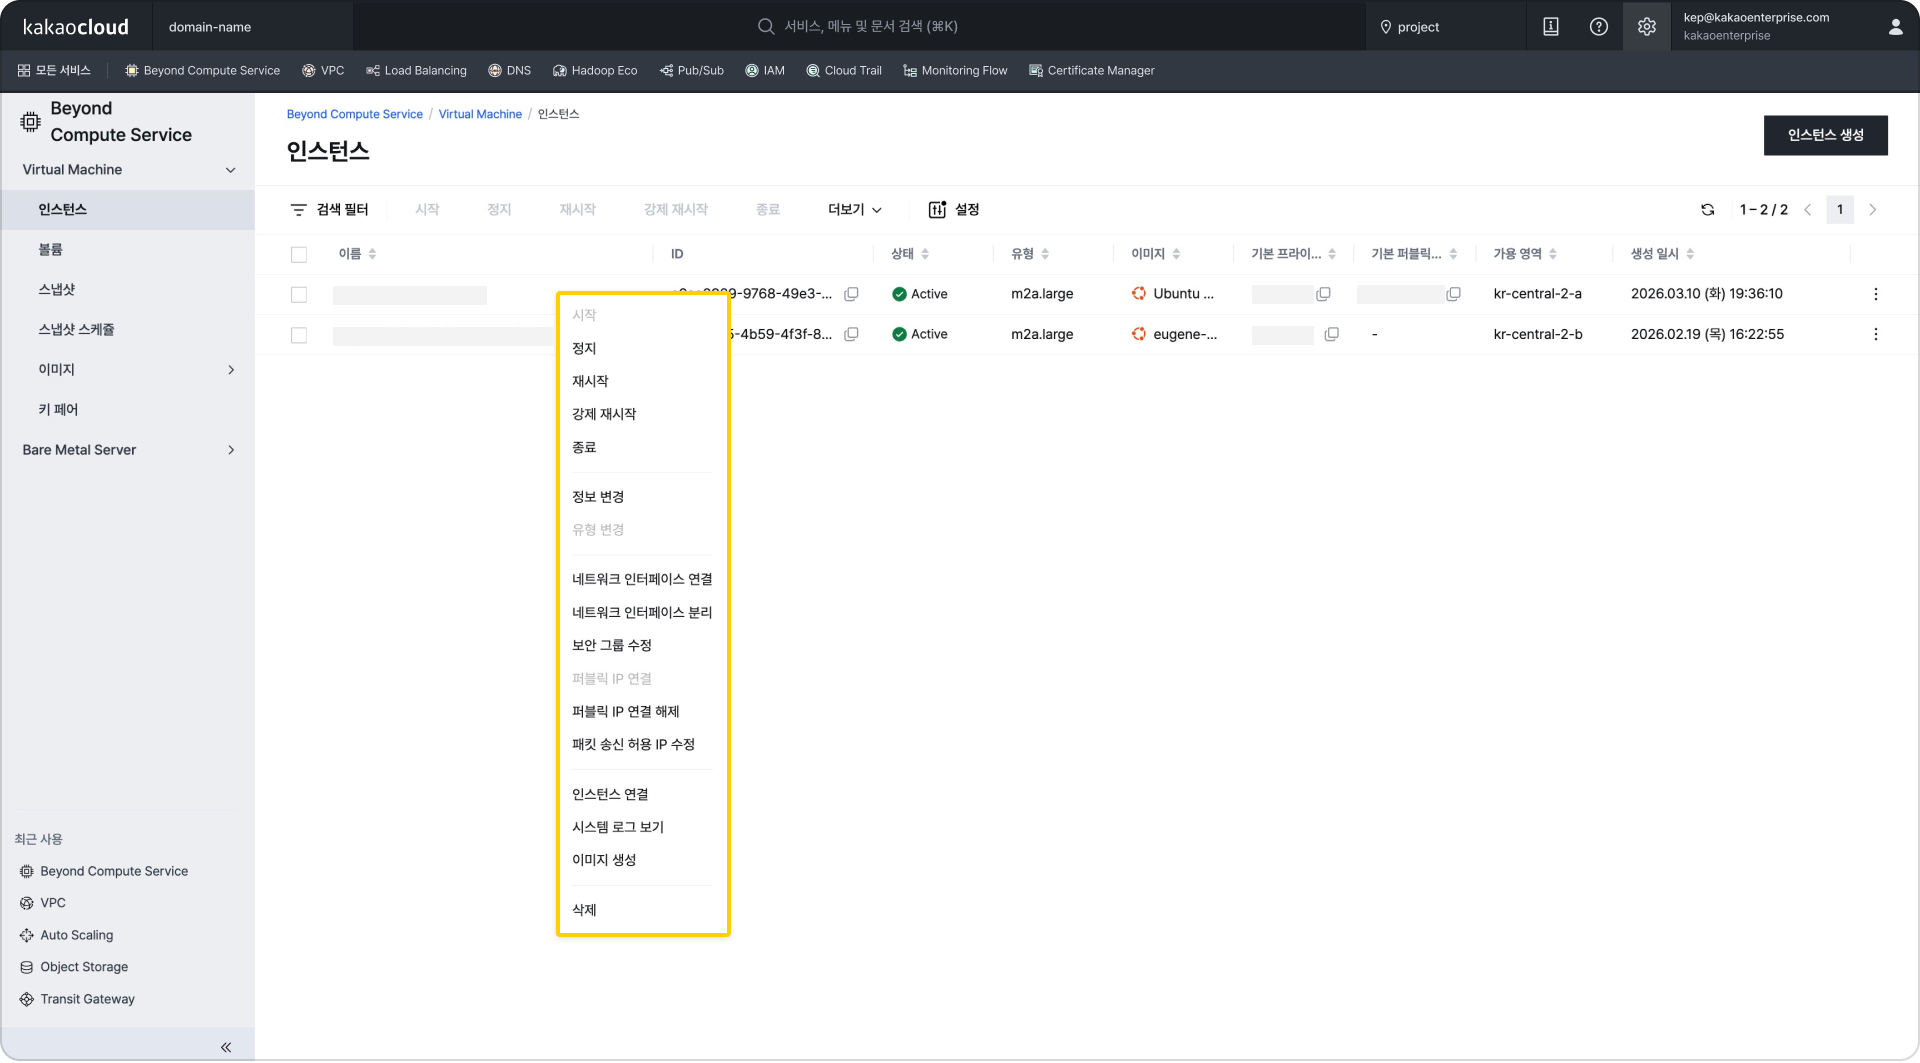
The resource task method has also become more intuitive. Previously, users had to click the More button at the far right of the table to see task menus. In the new console, users can open the same context menu directly by right-clicking the desired resource row in the table.

Image Context menu support in tables (when context menu support in tables is enabled in Settings at the top right)
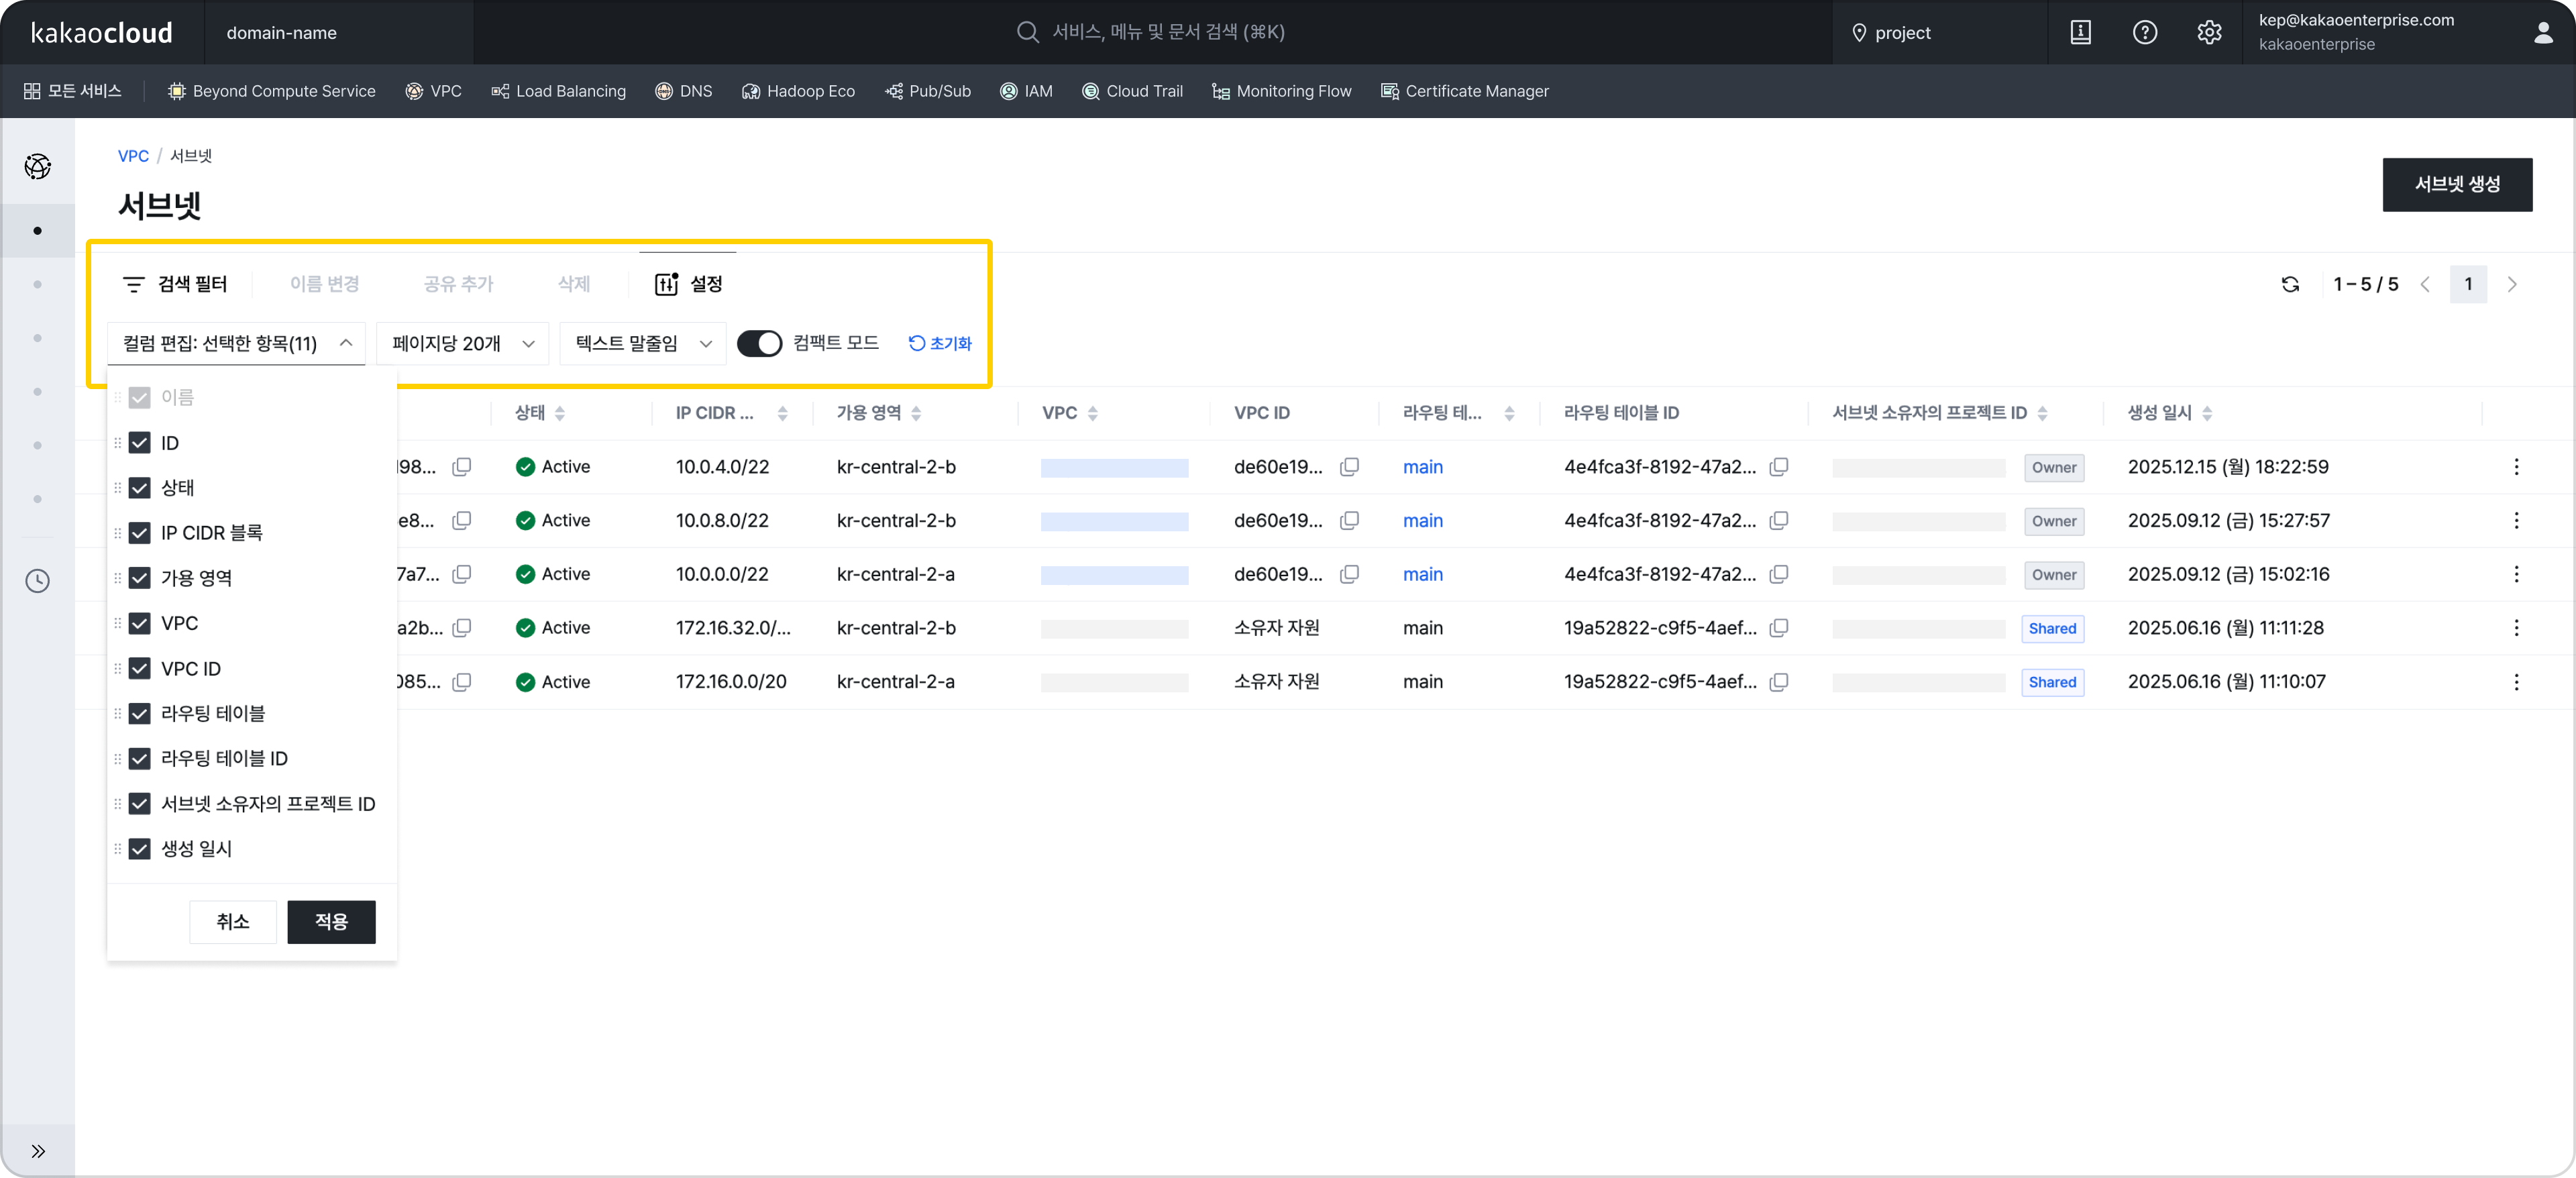
Table control features

Resource list screens support features for finely adjusting how tables are displayed. With text truncation and compact mode, more data can be displayed densely on one screen, and column configuration, header length, and width can also be adjusted.
By allowing users to directly control data density, the data-centric console philosophy has been implemented at the UI level. Beyond simple viewing, users can directly control how data is exposed, embedding the data-centric console philosophy into the UI layer.

1 Resource list screen

Intuitive topology

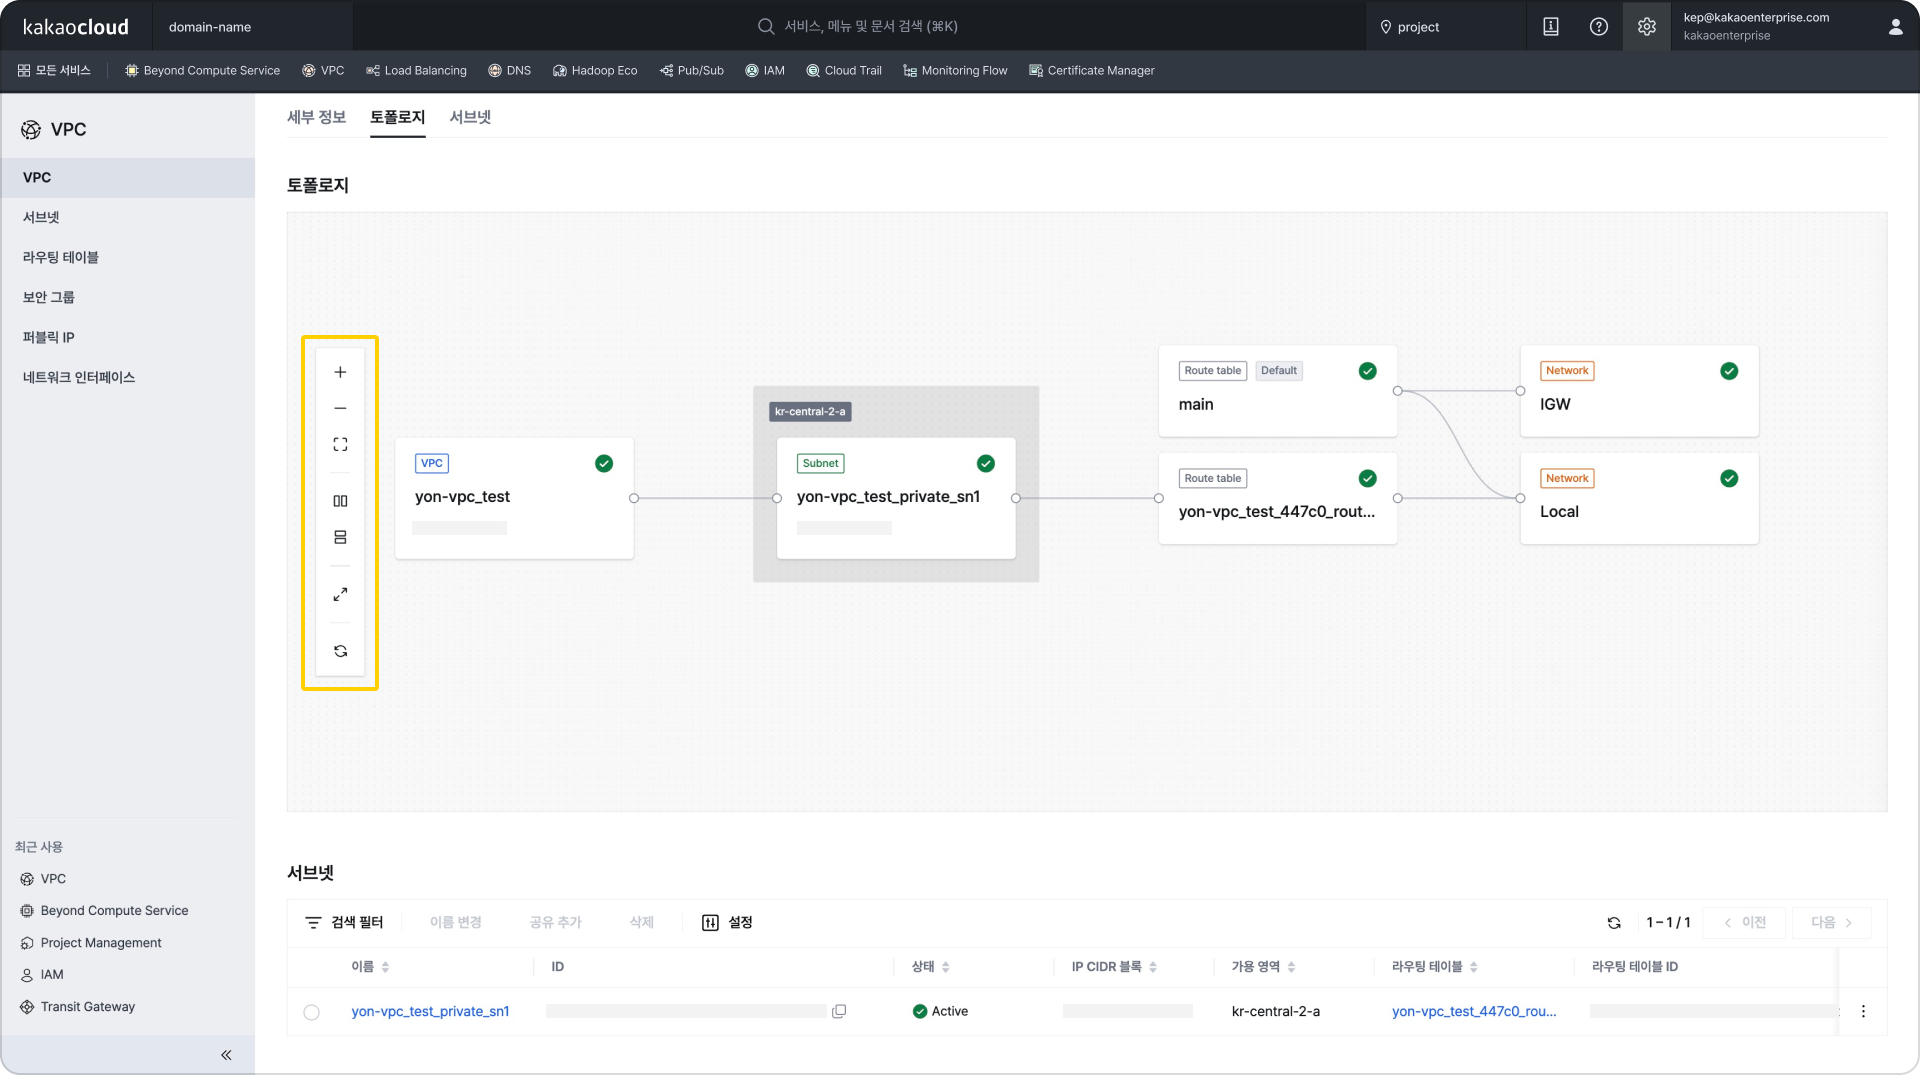
The existing topology feature has also been updated to improve the user exploration experience. When a resource card is selected in topology, details can be checked immediately in the panel without moving to another screen. Convenience features such as resource alignment and zoom in/out have also been added, and relationships between resources are expressed more intuitively so users can understand service components and resource structures at a glance.

3 Topology with zoom in/out, alignment, and other features added
Improved search and screen accessibility

Several convenience features have also been added by reflecting the actual usage patterns of users who use the console in operating environments.
For example, pressing Enter on each resource list screen now immediately opens the search filter, enabling faster search.
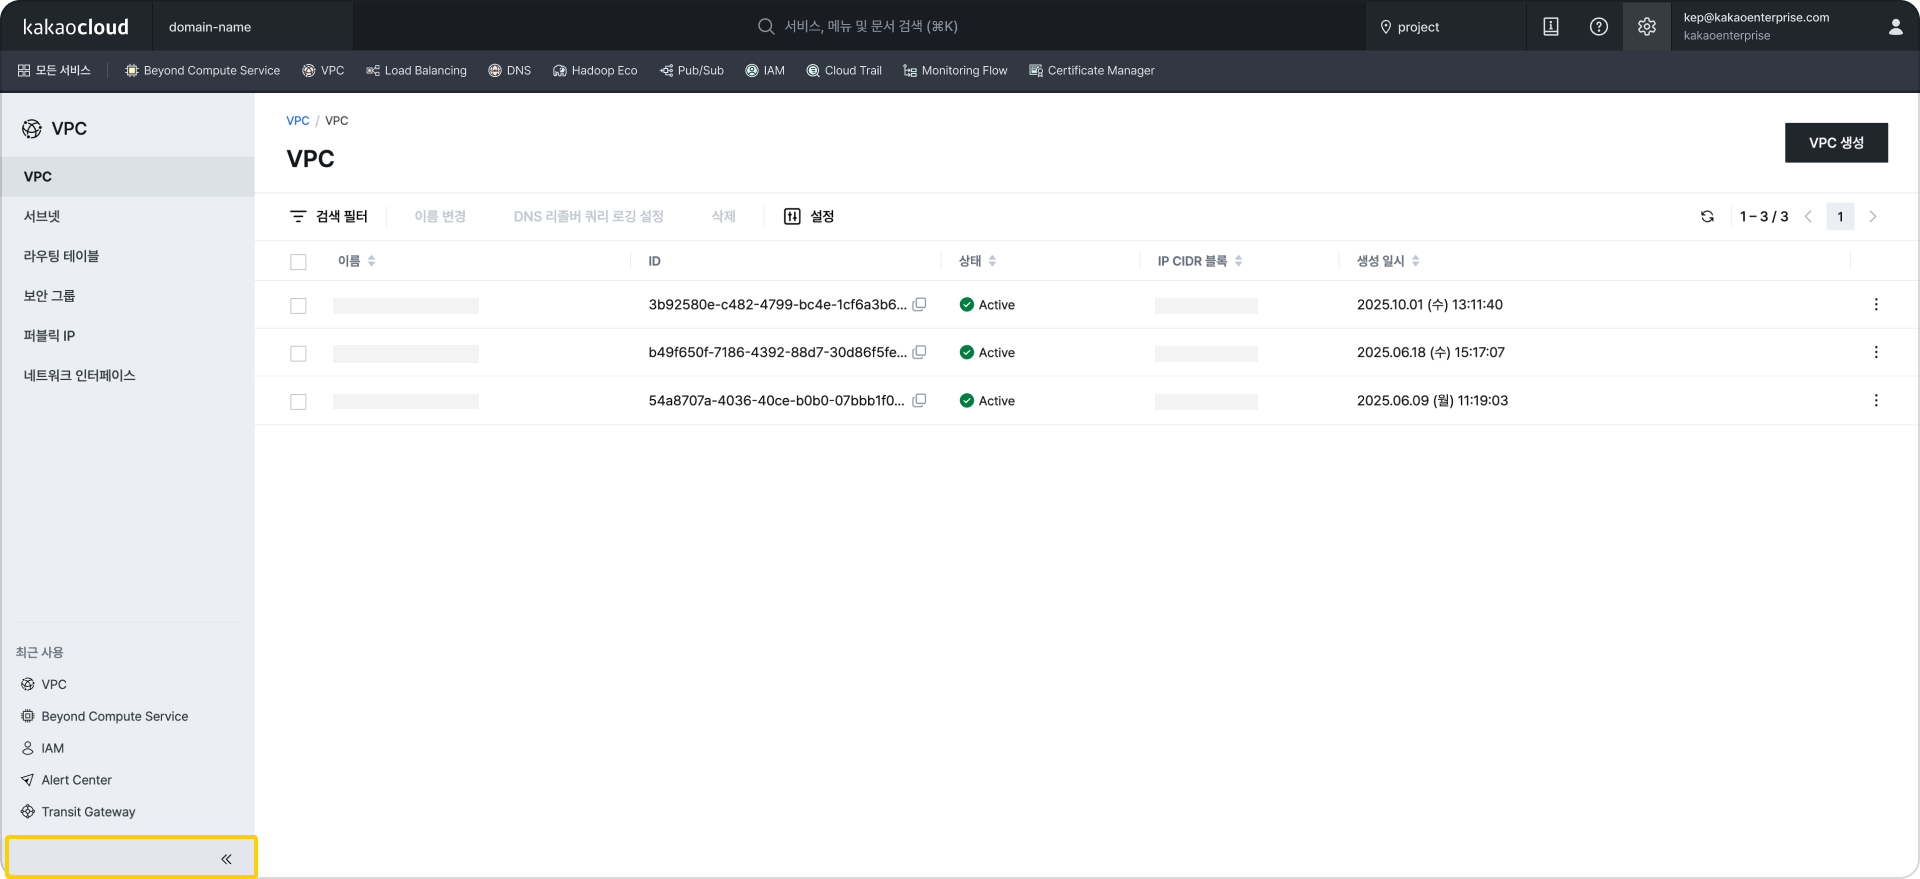
The left navigation bar (LNB) now supports collapse and expand, allowing screen space to be used more efficiently. Even on small screens or mobile environments, resource tables can be viewed more widely, improving usability in urgent response situations. Frequently used services can also be pinned to the top bar by adding them to favorites, and recently used services are displayed at the bottom left, making it easier to move between frequently used services.

3 Collapse and expand feature

Console-dedicated data architecture introduced

There were also major changes from an architecture perspective. The previous console was structured around service APIs. This was natural from a service development perspective, but in the console it created the burden of combining and processing multiple APIs to complete screens. As services and resources expanded, many API calls and real-time processing logic accumulated, and some logic became concentrated in the client or BFF (Backend for Frontend) layer. As a result, reflecting state changes also had to depend on periodic polling.

The new console improves these limitations by introducing a CDC, ETL, and SSE-based structure. Data changes are detected in real time and reflected in a console-dedicated data layer, then immediately delivered to the screen through SSE (Server-Sent Events). Read responses aim for less than one second, and resource creation and state changes are implemented to be reflected in the UI in real time.

Complex business logic is pre-transformed and stored at the ETL stage, minimizing the calculation burden during screen rendering. This lowers API dependency and provides a foundation for configuring the data needed from the console's perspective more flexibly.

Console as a platform

The new console is not simply a screen that shows multiple services in one place. It is defined as "one platform." It was designed as a platform structure so that services can continue to expand and still be accommodated stably.

A Module Federation-based structure has been introduced so that each service can participate independently, and controls have been prepared to minimize the impact of changes in one service on the entire console. This provides a foundation for adding new features faster than before. Areas shared by all services, such as common layout, authentication, navigation, and design system, are managed consistently from the center, while each service team can focus on developing business features.

This structure provides users with a consistent experience everywhere, and from an operations perspective, enables minimized change impact and gradual expansion. Update units have also become more flexible, making it easier to deploy improvements for each service independently.

The initial entry experience was also improved. SSR (Server-Side Rendering), a method where the server prepares and delivers the screen first, has been applied to reduce the loading burden users feel on first landing and let them start work faster.

Closing

The new KakaoCloud console is not simply a screen renewal. It was a change and a new challenge that redefined the role of the console through real-time data reflection, a console-dedicated data layer, data-centric UI, and modular platform architecture. Now, users can configure a console experience suited to their operating environment depending on which widgets they place on the dashboard and whether they choose compact mode or normal mode for tables. We are curious what data and what UI will be contained in your KakaoCloud console.

The March 13 release was first applied to Beyond Compute Service (Virtual Machine, Bare Metal Server), Networking (VPC, Load Balancing, DNS, Transit Gateway), and Management (IAM), and the remaining services will be converted sequentially.

KakaoCloud console will continue evolving as an operations platform designed around user experience.
Thank you.

👉 Start the new KakaoCloud console

Troubleshooting instances that cannot be accessed by SSH using OpenAPI

· 5 min read
Erin (오예진)
Cloud Engineer
update

An SSH port configuration becoming tangled while changing the port on an operating server, a forgotten password after a long period without access, or a sudden file system error that prevents booting... These are alarming situations that any cloud operator may have experienced at least once.

When the newly configured port does not work and even the existing port 22 is closed, leaving only repeated Connection refused or Connection timeout messages, the instance becomes isolated: alive, but uncontrollable.

In such a frustrating situation where the instance is in the Active state but there is no way to enter it internally, this post introduces two methods for recovery using OpenAPI while minimizing the risk of data loss, based on the troubleshooting guides in KakaoCloud technical documentation.

💡 Method 1. Automatic recovery with a user script (user_data)

This method is especially useful when "software configuration" issues occur, such as an SSH port configuration error, an unregistered SELinux policy, or a forgotten SSH password. Instead of an in-place method that attempts to fix the problem inside the affected instance, it aims for an immutable-infrastructure-based replacement method that recreates resources with a script containing normal configuration.

📍 Recovery flow
Create an image of the existing instance → Write a recovery user script → Provision a new instance with the script injected

🩺 Detailed checks and recovery procedure

Step 1. Create a snapshot: Check the existing specifications with Get instance, then create an image of the current root volume state with Create image.
- Tip: We recommend stopping the instance before proceeding so that residual data in memory can be recorded safely.

Step 2. Write a recovery script: Write a user script (user_data) that restores the port to 22 or configures a new password/key pair. This script runs when the instance first boots, and must be Base64 encoded for the API request.

Step 3. Provision the instance: Call Create instance with the recovery script attached to the image created earlier. As soon as the instance is created, the injected script runs, correcting the blocked port configuration or immediately restoring account access.

The biggest advantage of this method is that even in an "isolated situation" where an operator cannot enter the instance, settings can be automatically corrected remotely from outside. By quickly replacing the failed instance with a verified environment instead of repairing it directly, recovery time objective (RTO) can be significantly shortened.

▶︎ Troubleshooting guide for restoring access after changing the SSH port

💡 Method 2. Directly inspect the root volume

File system corruption or network configuration file errors that cannot be resolved with a user script require a more direct approach. This is a kind of rescue mode strategy in which the affected volume is temporarily treated as a "sub disk" so an engineer can directly modify its contents.

📍 Recovery flow
Create a root volume snapshot → Attach to an inspection instance → Repair data and detach → Recover with a new instance

🩺 Detailed checks and recovery procedure

Step 1. Snapshot and restore the volume: To prevent damage to the original data, create a snapshot of the affected root volume and restore a new volume based on it. This secures a safe working environment.

Step 2. Attach the inspection volume: Designate another normally operating instance as the "rescue" instance, and attach the restored volume to that instance.

Step 3. Mount and repair data: Mount the volume on the inspection instance and directly fix the problem area. Key checks and actions include the following.

  • Network: Immediately fix typos or configuration errors in files under /etc/netplan or /etc/sysconfig/network-scripts.
  • File system: After unmounting, check and repair disk errors with commands such as xfs_repair or fsck. There may be various other causes depending on system logs and configuration environments, so detailed diagnosis is required.

Step 4. Create an image and provision: After solving the problem, detach the volume, then create a new image based on that volume. Finally, deploy a normalized new instance using this image to complete recovery.

The core of this method is to use the environment of a normal instance to directly fix the problematic parts, such as the file system and network settings, instead of forcibly recovering the failed instance. After all fixes are complete, the volume is converted back into an image and redeployed as a new instance with the defects resolved.

▶︎ Troubleshooting guide for instance recovery through root volume inspection

📝 Recovery golden rules operators should remember

The core of recovery that operators should learn in practice goes beyond simply using individual features. It is about structurally preparing a system-level recovery framework. Above all, by using a cloud-based flow that connects image creation, configuration correction, and redeployment, you can secure a recovery path even when access is blocked.

In this process, data protection is the basic premise. Making it a habit to stop the instance and create a snapshot before recovery work can minimize the risk of data loss. After recovery is complete, it is also advisable to clean up temporary snapshots, restored volumes, and existing instances to avoid unnecessary costs.

Failures occur without warning, but recovery procedures can be prepared in advance. By using KakaoCloud troubleshooting guides together with OpenAPI, you can secure reproducible recovery paths for most access failure situations. Refer to the technical documentation now and review automated recovery scenarios suitable for your infrastructure environment.

👉 Start KakaoCloud now

Hadoop Eco adds features for operational efficiency in data lake architecture

· 5 min read
Evan (진은용)
Service Manager
HDE update

When enterprises design cloud-based large-scale data lake architectures, we have reached a point where we must go beyond simply accumulating data and maximize operational efficiency. To secure efficiency, it is necessary to build a balanced set of core elements such as high-performance processing, flexible separation of compute resources, and robust data governance.

If this balance breaks down, complex problems can occur, such as real-time analytics queries being delayed by batch jobs or difficulty understanding the location and reliability of the data needed.

KakaoCloud Hadoop Eco (HDE) recently carried out a large-scale update to solve these problems and improve the processing power and operational management capabilities of analytics environments. Based on the release of the new HDE-2.3.0 version, this update includes major changes such as improved integration with Iceberg catalogs, a next-generation metastore, and the introduction of task nodes optimized for workloads.

In this post, we briefly introduce how these improvements can be used within HDE to improve analytics workflows.

🚀 New HDE-2.3.0 version and powerful components added

With this update, HDE-2.3.0 is newly provided, and JupyterLab, Impala, and Kudu components have been added to effectively support data analytics and processing workflows.

Create HDE cluster Create HDE cluster

  • JupyterLab: Provides a web-based programming and shell environment, offering a development environment where data exploration and analysis code can be executed immediately within cluster nodes.
  • Impala: A powerful query engine that supports fast interactive queries against data stores such as Kudu based on Hive Metastore.
  • Kudu: Serves as a columnar data store that supports low-latency reads and writes.

In addition, Druid, a core component of Dataflow-type clusters, has been upgraded to v33.0.0, and Superset has been upgraded to v5.0.0, further improving performance and stability.

💡 View the Hadoop Eco component list

⚙️ Securing cluster structure flexibility: introducing task nodes

One of the tricky parts of cluster operations is separating batch processing and interactive processing resources to minimize mutual interference. In this update, the newly introduced task node effectively reduces operational burden.

Task node settings Task node settings

  • Role separation: Task nodes are mainly used as dedicated compute resources for executing large-scale batch computation jobs (YARN Jobs). By separating their role from worker nodes, they ensure the stability of core data processing resources and effectively prevent performance degradation caused by resource contention.
  • More accurate capacity planning: With the introduction of task nodes, the method for calculating YARN available resources has been changed to include the number and flavor of task nodes. This makes cluster capacity planning more accurate and predictable.

⚠️ Note when using task nodes: Task nodes can only be added when creating a cluster. Please carefully decide whether to add task nodes during the initial design stage, because they cannot be added after creation. However, reducing the number of nodes to 0 and increasing it again is possible.

🧊 Iceberg catalog integration, now with one click

As KakaoCloud Data Catalog officially supports the Apache Iceberg format, Iceberg catalog integration when creating a Hadoop Eco cluster has been dramatically simplified.

Iceberg catalog integration Iceberg catalog integration

In the Hadoop Eco service with this improvement, the console now lets you directly select and connect a Data Catalog Iceberg catalog in the external metastore integration setting during cluster creation. This minimizes human error, shortens integration time, and lets you start analytics work immediately.

In addition, an option has been added so that users can choose whether to automatically retain data during the data retention period (90 days) after cluster deletion. This feature can be used to prevent unnecessary metadata retention costs and clarify governance.

This Hadoop Eco update is not just a feature expansion. It further strengthens the operational efficiency of data lake architecture around three axes: stable metadata governance, high-performance interactive analytics environments, and flexible compute resource management.

Operate analytics workflows more efficiently and systematically with KakaoCloud's new Hadoop Eco.

Thank you.

👉 Start KakaoCloud now

Latest service updates for stronger operational reliability - Iceberg, PITR, SMS

· 4 min read
Mia (정혜원)
Technical Contents Manager
update

One of the most important values in cloud operations is stability. System stability is not only about preventing problems. Its reliability is determined by how quickly and flexibly problems can be recovered and resolved when they occur, and how well they can be prevented and prepared for in advance.

Through recent updates across several services, KakaoCloud has further strengthened this important value of Operational Reliability. We focused on improving users' operating experience around safe data recovery, efficient system maintenance, and fast failure notification systems.

In this post, we take a closer look at three notable improvements that can substantially improve operational reliability.


🧊 1. Iceberg format support for data integrity

One notable change in the recent update is that Data Catalog has officially started supporting the Apache Iceberg format. Apache Iceberg, developed by Netflix, is a powerful open-source table format designed for tracking change history in large-scale data (Time Travel) and restoring to specific points in time.

You can now select the Iceberg catalog type in KakaoCloud Data Catalog. With Iceberg added alongside the existing Hive Metastore-based Standard type, version management and point-in-time recovery have become much simpler even in large-scale data environments. Even if data loss or errors occur, you can easily restore to a previous state, and integration with major analytics engines such as Spark and Trino can be used immediately.

Through this update, KakaoCloud Data Catalog fully supports the integrity and resilience of large-scale data at a practical operational level, and is expected to further improve data reliability across analytics environments.

📝 Learn more about Apache Iceberg catalogs

⏪ 2. Stronger recovery reliability with point-in-time recovery (PITR)

Databases are one of the most important elements of cloud operational stability. Improving the reliability of recovery features in these database systems is truly important. In this MySQL update, the long-awaited Point-in-Time Recovery (PITR) feature has been added.

Based on automatic backups and Binary Logs, you can specify a desired point in time and restore a new instance group to the state at that time. Because you can now specify the recovery point down to the second, you can respond very flexibly to data loss caused by mistakes or errors.

💡 Please note! For service stability, point-in-time recovery currently supports a single availability configuration. If high availability (HA) configuration is required, we recommend adding instances after recovery is complete.

In addition, security groups can now be modified while instances are running, improving flexibility in network control. Account management procedures have also been improved so that password policies are applied in the same way when procedures are used. These detailed improvements to security and recovery features are important changes that substantially increase stability in real operating environments.

📝 Learn more about MySQL point-in-time recovery

📩 3. Notification speed is response speed

The outcome of responding to issues depends on how quickly operators recognize the system status. In this update, Maintenance introduced a new SMS notification feature in addition to existing email. When a maintenance task fails or an important event occurs, a notification is immediately sent to the registered mobile phone number. Now, even if you do not check email, you can recognize and respond to problem situations in real time.

💡 Please note! SMS notifications are sent only for events that require quick action, and project administrators must register valid contact information in advance.

📝 Learn more about Maintenance


These three updates were made in different services, but they all point in the same direction. Data can be restored safely without loss, security settings have become more flexible, and failures can be detected faster. This is the operational resilience KakaoCloud aims for. Stability improvements covering the entire operational process, from data to notifications, will continue.

KakaoCloud will continue improving technical completeness so that customers' operating environments become more stable and predictable. We appreciate your continued interest and support.

👉 Start KakaoCloud now