AI Insight is now available to improve visibility into AI workload operations



In AI model training and inference environments, compute resources, runtime environments, and node status are closely connected, affecting workload performance and cost. GPUs account for a particularly important share of AI workloads, but as operating environments grow, it becomes difficult to identify whether resources are actually in use, remain idle, or show signs of abnormal behavior from service-specific screens alone.
In July 2026, KakaoCloud launched AI Insight, a service that lets users view resource status and key metrics required for AI workload operations in an integrated way. AI Insight is an AI monitoring service that provides an at-a-glance view of AI workload operations by monitoring status and key metrics across clusters, nodes, and GPUs.
In this post, we look at operational challenges that AI workload operators often face and introduce how AI Insight can help address them.
When you need an at-a-glance view of key resources
When operating AI workloads, the first thing you need is a quick understanding of the overall status of key resources. This release focuses on GPUs, which are central to AI workloads, and helps you check how many resources are in use, which resources are idle, and which targets require inspection on a single screen.
AI Insight shows the status of monitored targets as Active, Idle, Warning, Critical, Pending, and Agent Missing. It also provides the total number of GPUs, clusters, and nodes, as well as average utilization, average memory usage, average temperature, and the number of ECC errors, so you can quickly understand the operational status of resources supported in this release.
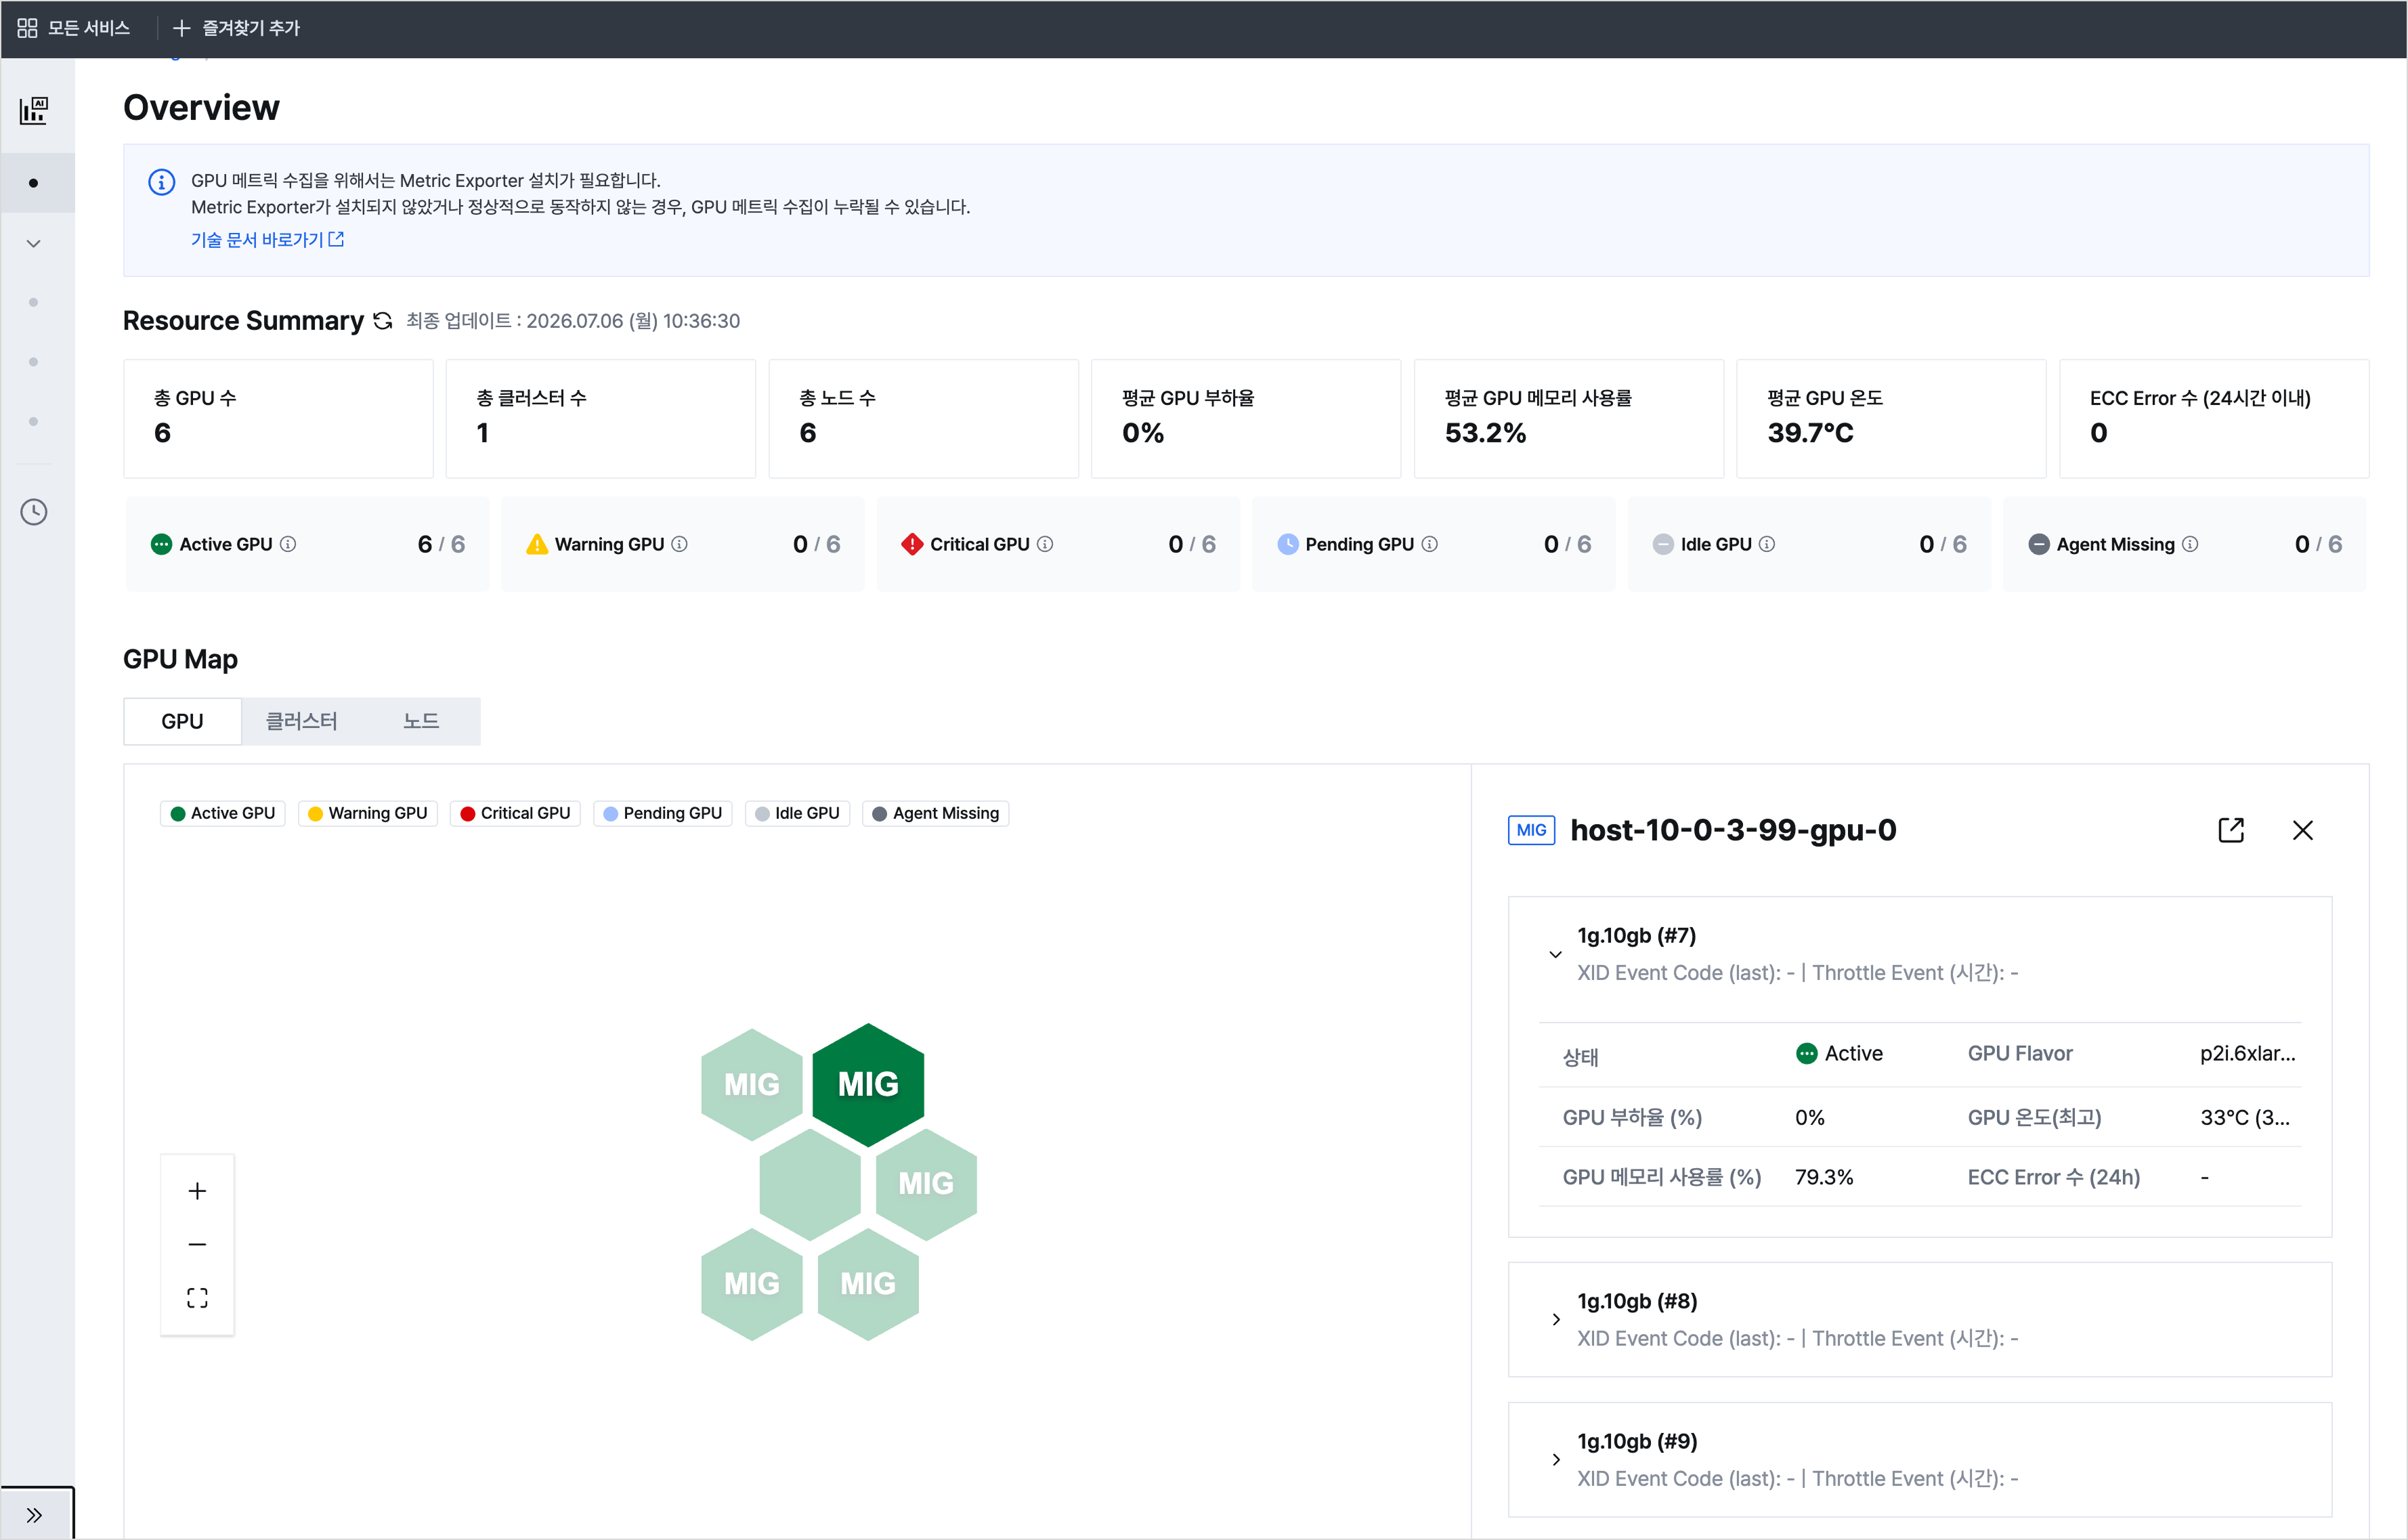 AI Insight > Overview
For example, you can answer questions such as:
- How many of the total GPUs are currently being used normally?
- Are any GPUs left idle after training jobs have completed?
- Which GPUs require inspection because they are in Warning or Critical status?
- Are there any resources where metric collection components are not working properly?
When you need to quickly narrow down targets with abnormal signs
As the number of resources under operation increases, it becomes difficult to find inspection targets by checking the full list one by one. AI Insight uses GPU Map to visualize resources by GPU, cluster, and node, and separates them by status.
In GPU Map, resources are distinguished by status color. When you select a specific GPU or MIG instance, you can immediately check key status and event information in the right panel.
Users can select resources in Warning or Critical status and immediately check GPU utilization, GPU memory usage, GPU temperature, ECC errors, XID event codes, throttle events, and more. This helps narrow down problematic resources first and then continue root cause analysis from the detail screen if needed.
When you need to analyze the cause by resource hierarchy
After identifying the target to inspect, you need to determine which layer the problem started from. The issue may come from the compute resource itself, or it may be a situation where CPU, memory, disk, or network bottlenecks on the execution node affect the workload.
In this release, AI Insight provides detailed metrics at the cluster, node, and GPU levels to help narrow down the problem scope step by step. At the cluster level, you can compare overall resource patterns. At the node level, you can check CPU, memory, disk, and network status together. At the GPU level, you can review trends in utilization, memory usage, temperature, idle rate, throttling, and ECC errors for each GPU or MIG instance.
In GPU Explorer, you can view metric trends, anomalies, and correlations by time range based on the selected cluster, node, and GPU.
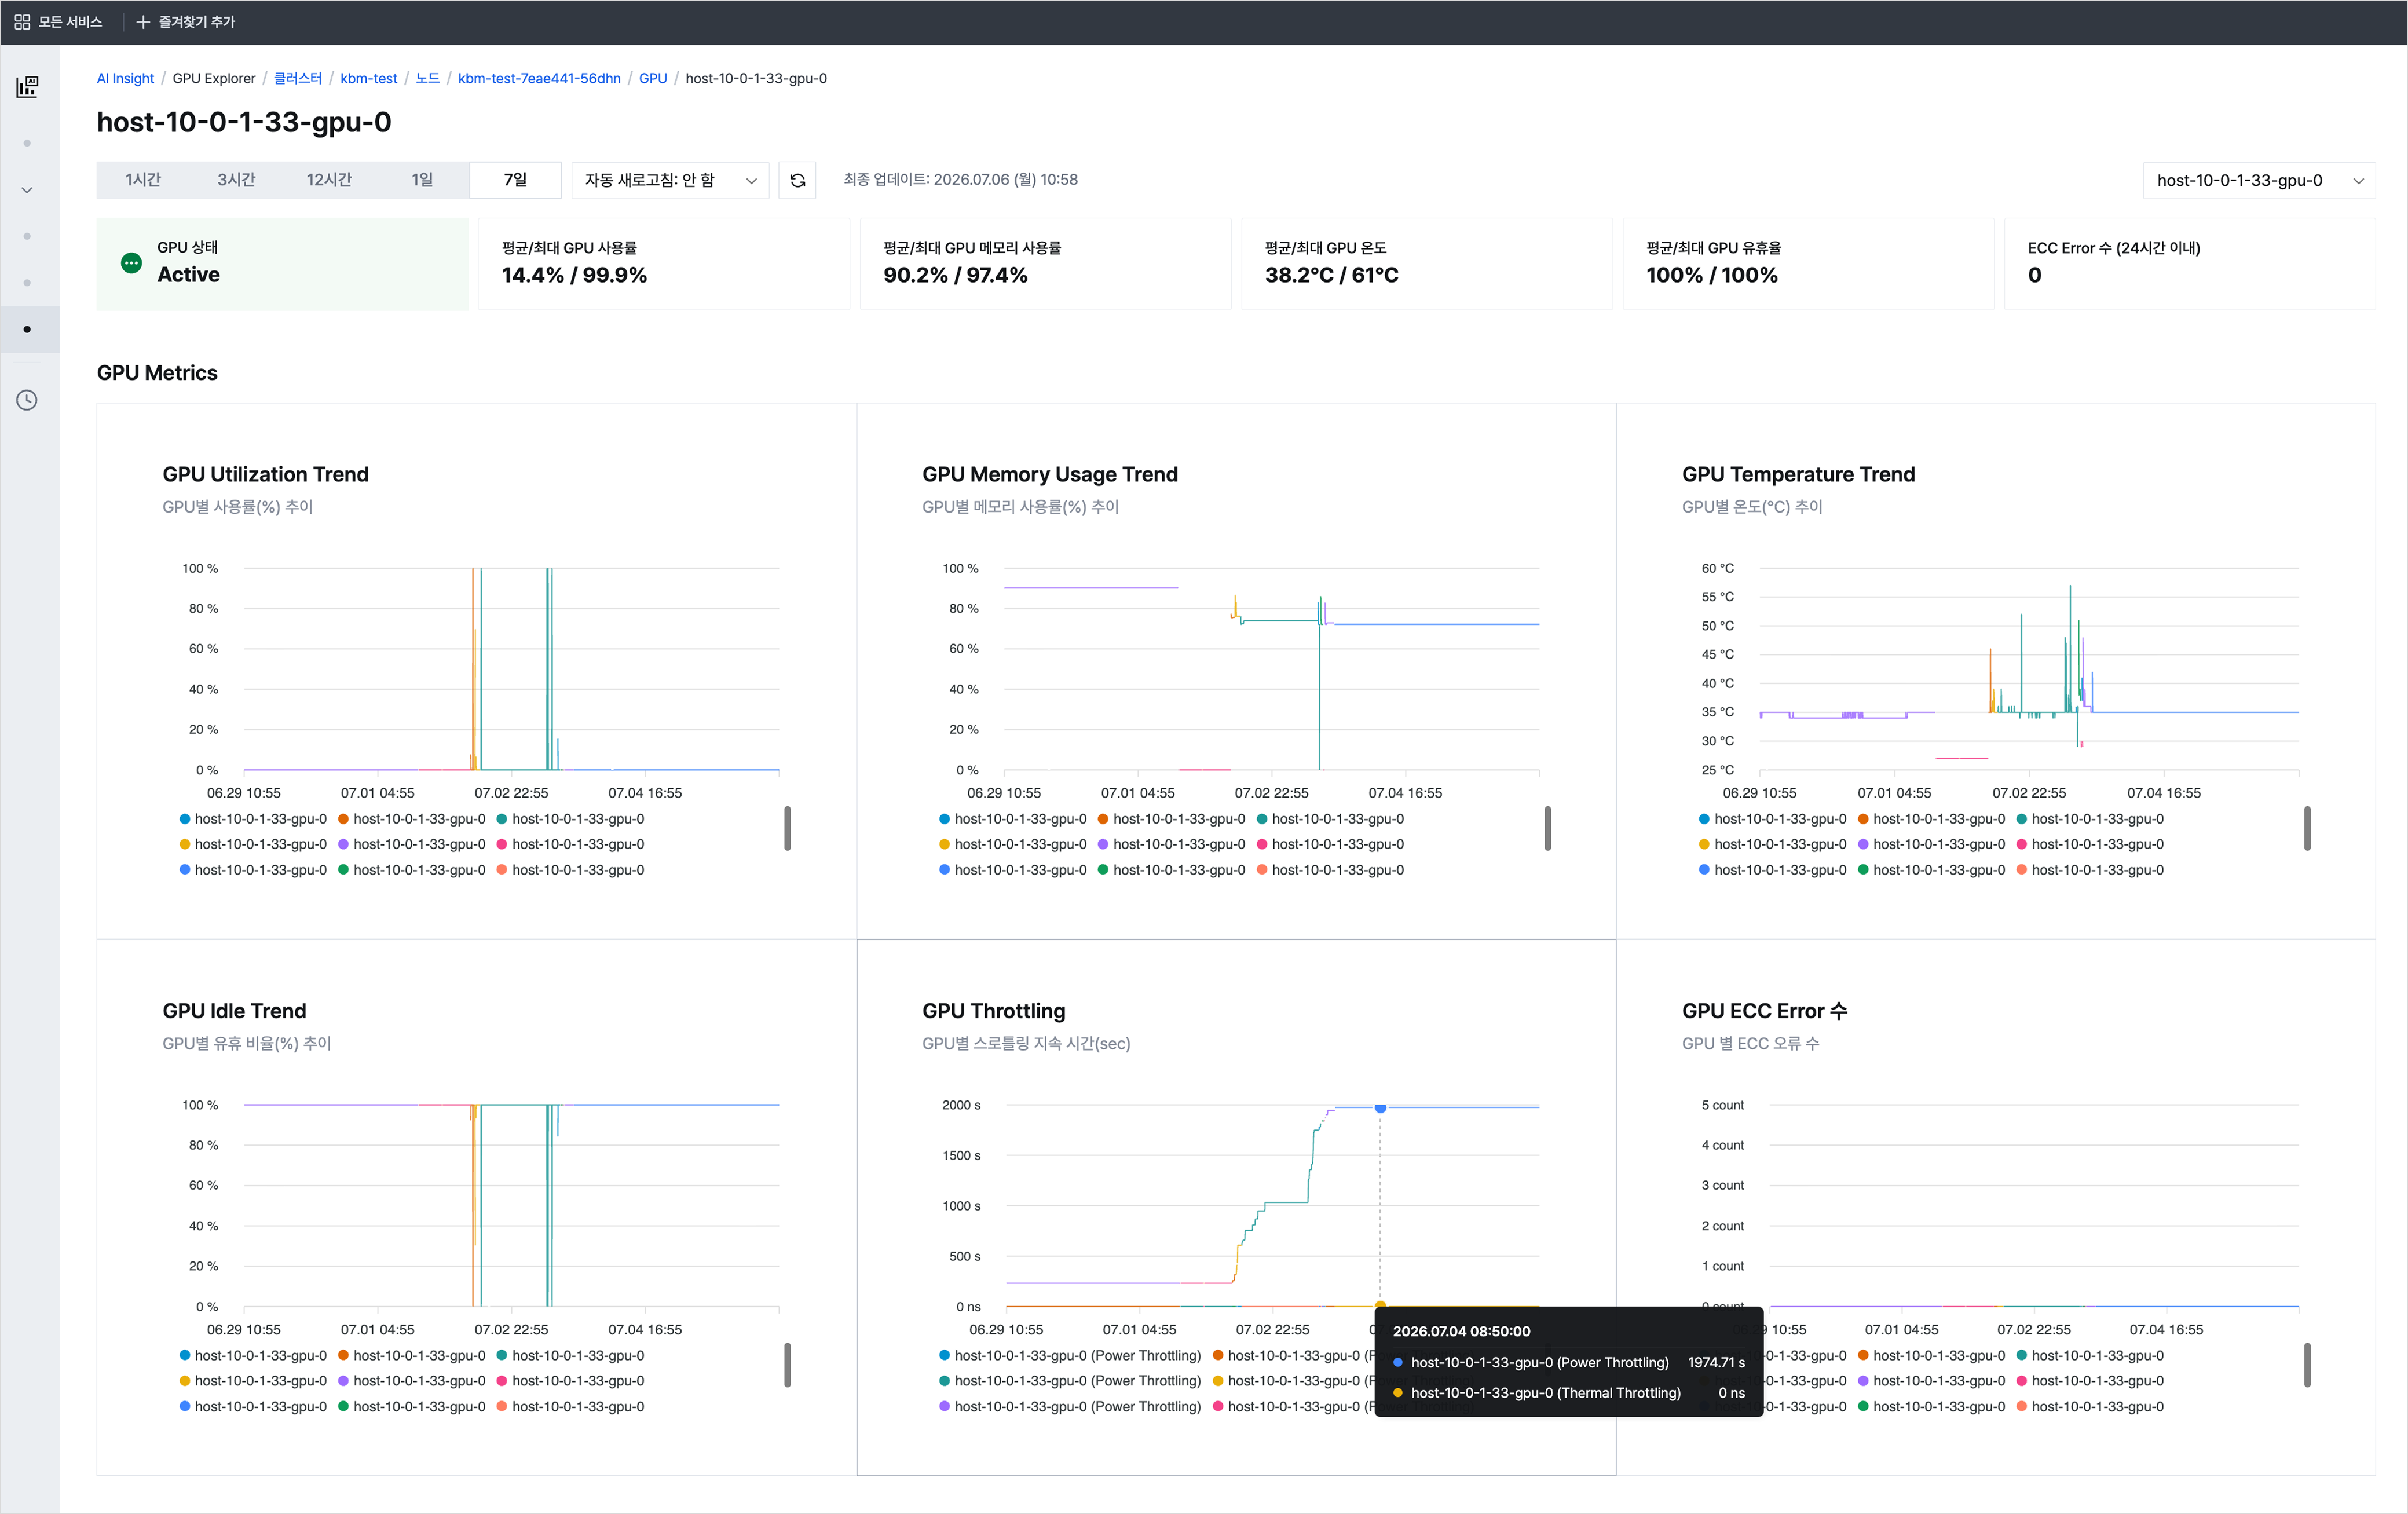 AI Insight > GPU Explorer > GPU monitoring
During this process, you can check whether only a specific resource shows a different pattern, whether any target has a high temperature compared to its utilization, or whether node system resource bottlenecks appear at the same time.
When you need to monitor multiple runtime environments with the same criteria
AI workloads can run on GPU nodes based on Kubernetes Engine or on GPU nodes based on Virtual Machine. Operators need to check GPU status and key metrics using the same criteria, regardless of the runtime environment.
AI Insight is designed to support both Kubernetes Engine (KE)-based GPU nodes and Virtual Machine (VM)-based GPU nodes.
After you install Metric Exporter or a monitoring agent in the target environment, AI Insight collects GPU metrics and displays them in the console.
However, if metric collection components are not installed or are not working properly, the corresponding resource may appear in Agent Missing status. In this case, refer to the Metric Exporter installation documentation and check the collection configuration first.
Expanding into an AI observability service
Starting with GPU monitoring, AI Insight helps users view the status of key resources required for AI workload operations at a glance and analyze the causes of abnormal signs more quickly.
As AI workloads become more complex, what operations need is not more information, but visibility: the ability to find the right information at the right time and identify causes quickly. Starting with AI Insight, KakaoCloud will continue expanding operational visibility across AI workloads and enhancing AI observability services.