Query Cloud Trail and DNS resolver logs with Data Query


In production environments, logs are reference data for troubleshooting incidents and reviewing security. However, storing logs is not enough. To analyze operational issues and identify causes, you must be able to query the data quickly with the conditions you need. For logs that are repeatedly used for audits and diagnostics, it is especially important to consider the storage location, file structure, and query method from the beginning.
The two newly added tutorials explain how to use Data Catalog and Data Query to query and analyze operational logs stored in Object Storage with SQL.
Both documents use the same data analysis architecture, but they focus on different operational scenarios. One covers security auditing and change tracking based on user activity and resource change history. The other covers network diagnostics based on DNS query flows inside a VPC. Accordingly, the target logs are Cloud Trail logs and DNS resolver query logs.
Operational log storage -> Object Storage -> Data Catalog -> Data Query
Although the logs being analyzed are different, the workflow is the same: store logs in Object Storage, configure table metadata in Data Catalog, and query the data with SQL in Data Query.
This post looks at when each log is useful and how to analyze operational logs with SQL.
Cloud Trail logs: Reference data for checking resource change history
Cloud Trail records user activity and resource operation history in KakaoCloud as events. For example, you can check when a specific user logged in, which resources were created or modified, and which service generated an event. When these logs are connected to Data Query, you can answer common security audit and history tracking questions with SQL.
- Which user changed which resource on a specific date?
- Is there any operation history for a specific service or IP address?
- Did create, update, or delete events occur for a specific resource?
The Query Cloud Trail logs with Data Query tutorial explains how to store Cloud Trail logs in gz format in Object Storage and configure Data Catalog and Data Query based on the project_event and domain_event paths. In this workflow, it is important to use partition columns such as date_id and hour_id as query conditions so that you only query the required period.
Because Cloud Trail logs are used for security audits and change tracking, it is better to narrow the query by conditions such as when, from which service, by whom, and for which resource, rather than scanning all logs at once.
DNS resolver query logs: Check DNS queries and responses inside a VPC
DNS resolver query logs record DNS query and response information generated inside a VPC. You can check which domains an application queried, whether responses were normal, and whether failed responses were concentrated in a specific time period. With Data Query, you can answer operational questions such as:
- Which domains were queried most on a specific date?
- During which time periods were non-
NOERRORresponses concentrated? - Did a specific VPC query a specific domain unusually often?
- Are DNS queries with long response times recurring?
The Query DNS resolver query logs with Data Query tutorial configures tables based on the Object Storage path structure KCLogs/{region-name}/{year=yyyy/month=mm/day=dd} used by DNS resolver query logs. It then shows how to synchronize the year, month, and day partitions in Data Query and aggregate query counts or failed response counts by domain.
DNS logs are useful not only for network incident analysis, but also for checking external dependencies of internal services, unexpected domain queries, and repeated failed responses. If Cloud Trail shows the history of users and resource operations, DNS resolver query logs show how applications inside a VPC perform name resolution.
Why the two tutorials use the same pattern
Cloud Trail logs and DNS resolver query logs have different characteristics, but operators handle them in similar ways.
First, logs are stored in Object Storage. Next, metadata is configured in Data Catalog based on file paths and partition structures. Finally, Data Query uses SQL to query the logs with conditions such as specific periods, services, users, domains, and response codes.
After this common pattern is established, you can reuse the same flow of storage location, metadata configuration, and SQL querying even when the analysis target changes.
| Step | Cloud Trail logs | DNS resolver query logs |
|---|---|---|
| Storage location | Object Storage | Object Storage |
| Main path | trail/project_event, trail/domain_event | KCLogs/{region-name}/{year=yyyy/month=mm/day=dd} |
| Main partitions | date_id, hour_id | year, month, day |
| Main analysis focus | User activity, resource changes, service events | Domain queries, DNS response codes, VPC-specific query patterns |
| Query tool | Data Query | Data Query |
This structure helps manage operational log analysis in a consistent way. Instead of learning different query languages and storage structures for each separate tool, you can standardize the query flow around Object Storage, Data Catalog, and Data Query.
How to start operational log analysis
If you need to retain operational logs for a long time and query them when necessary, we recommend reviewing both tutorials together. For example, when an incident occurs during a specific time period, you can check resource change history with Cloud Trail logs and also review DNS query failures or response delays from the same time period with DNS resolver query logs. When logs with different characteristics can be queried in the same way, it becomes easier to interpret individual events in a broader operational context.
KakaoCloud technical documentation provides various tutorials based on practical operational scenarios. Use the following documents to learn how to store operational logs, configure them in a queryable form, and analyze them step by step with the conditions you need.
👉 Query Cloud Trail logs with Data Query
👉 Query DNS resolver query logs with Data Query
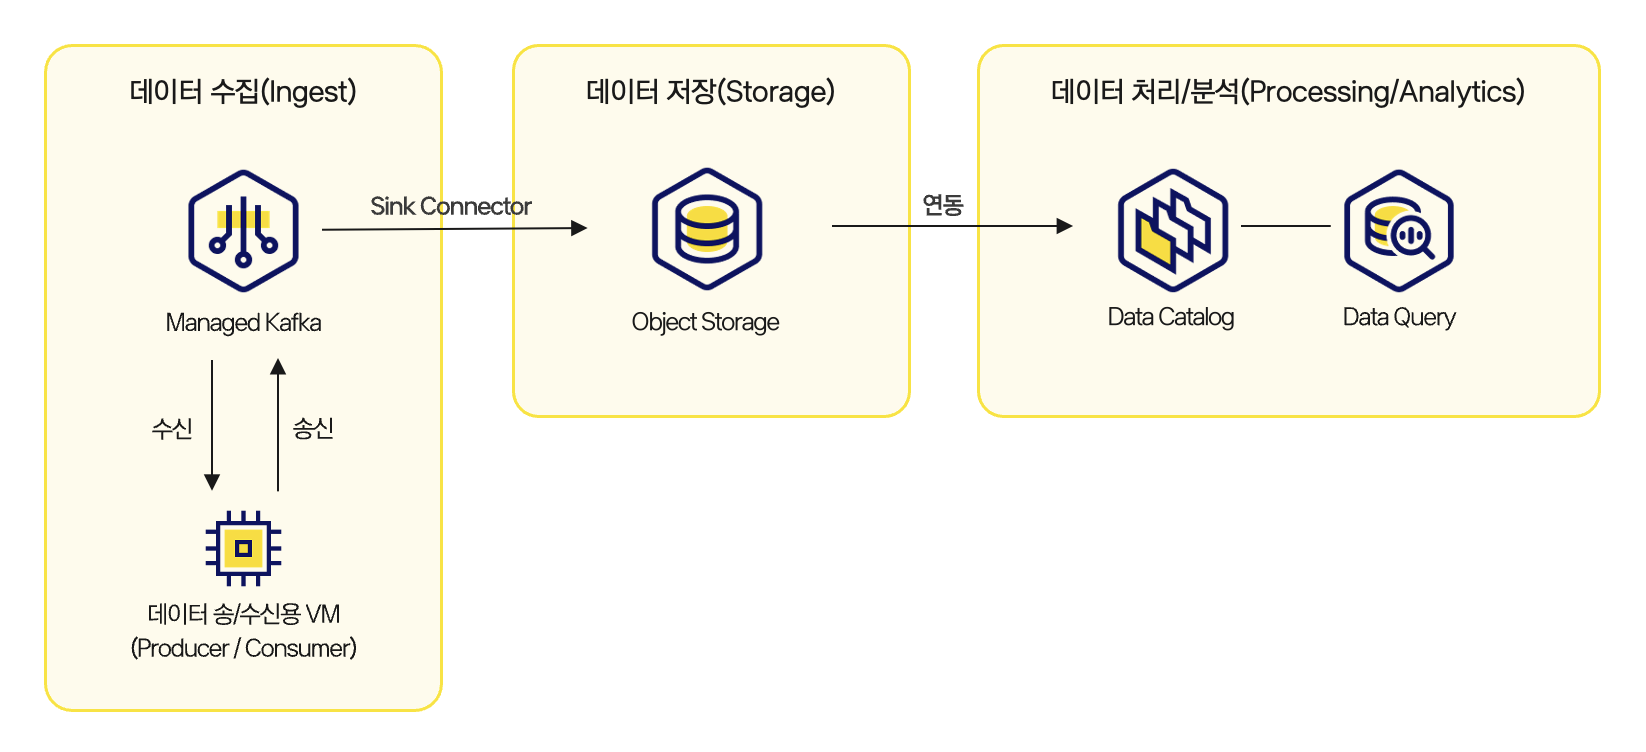 Architecture for building a real-time data pipeline