3 posts tagged with "gpu"

View All Tags

AI Insight is now available to improve visibility into AI workload operations


· 5 min read
Evan (진은용)
Service Manager
AI Insight

In AI model training and inference environments, compute resources, runtime environments, and node status are closely connected, affecting workload performance and cost. GPUs account for a particularly important share of AI workloads, but as operating environments grow, it becomes difficult to identify whether resources are actually in use, remain idle, or show signs of abnormal behavior from service-specific screens alone.

In July 2026, KakaoCloud launched AI Insight, a service that lets users view resource status and key metrics required for AI workload operations in an integrated way. AI Insight is an AI monitoring service that provides an at-a-glance view of AI workload operations by monitoring status and key metrics across clusters, nodes, and GPUs.

In this post, we look at operational challenges that AI workload operators often face and introduce how AI Insight can help address them.

When you need an at-a-glance view of key resources

When operating AI workloads, the first thing you need is a quick understanding of the overall status of key resources. This release focuses on GPUs, which are central to AI workloads, and helps you check how many resources are in use, which resources are idle, and which targets require inspection on a single screen.

AI Insight shows the status of monitored targets as Active, Idle, Warning, Critical, Pending, and Agent Missing. It also provides the total number of GPUs, clusters, and nodes, as well as average utilization, average memory usage, average temperature, and the number of ECC errors, so you can quickly understand the operational status of resources supported in this release.
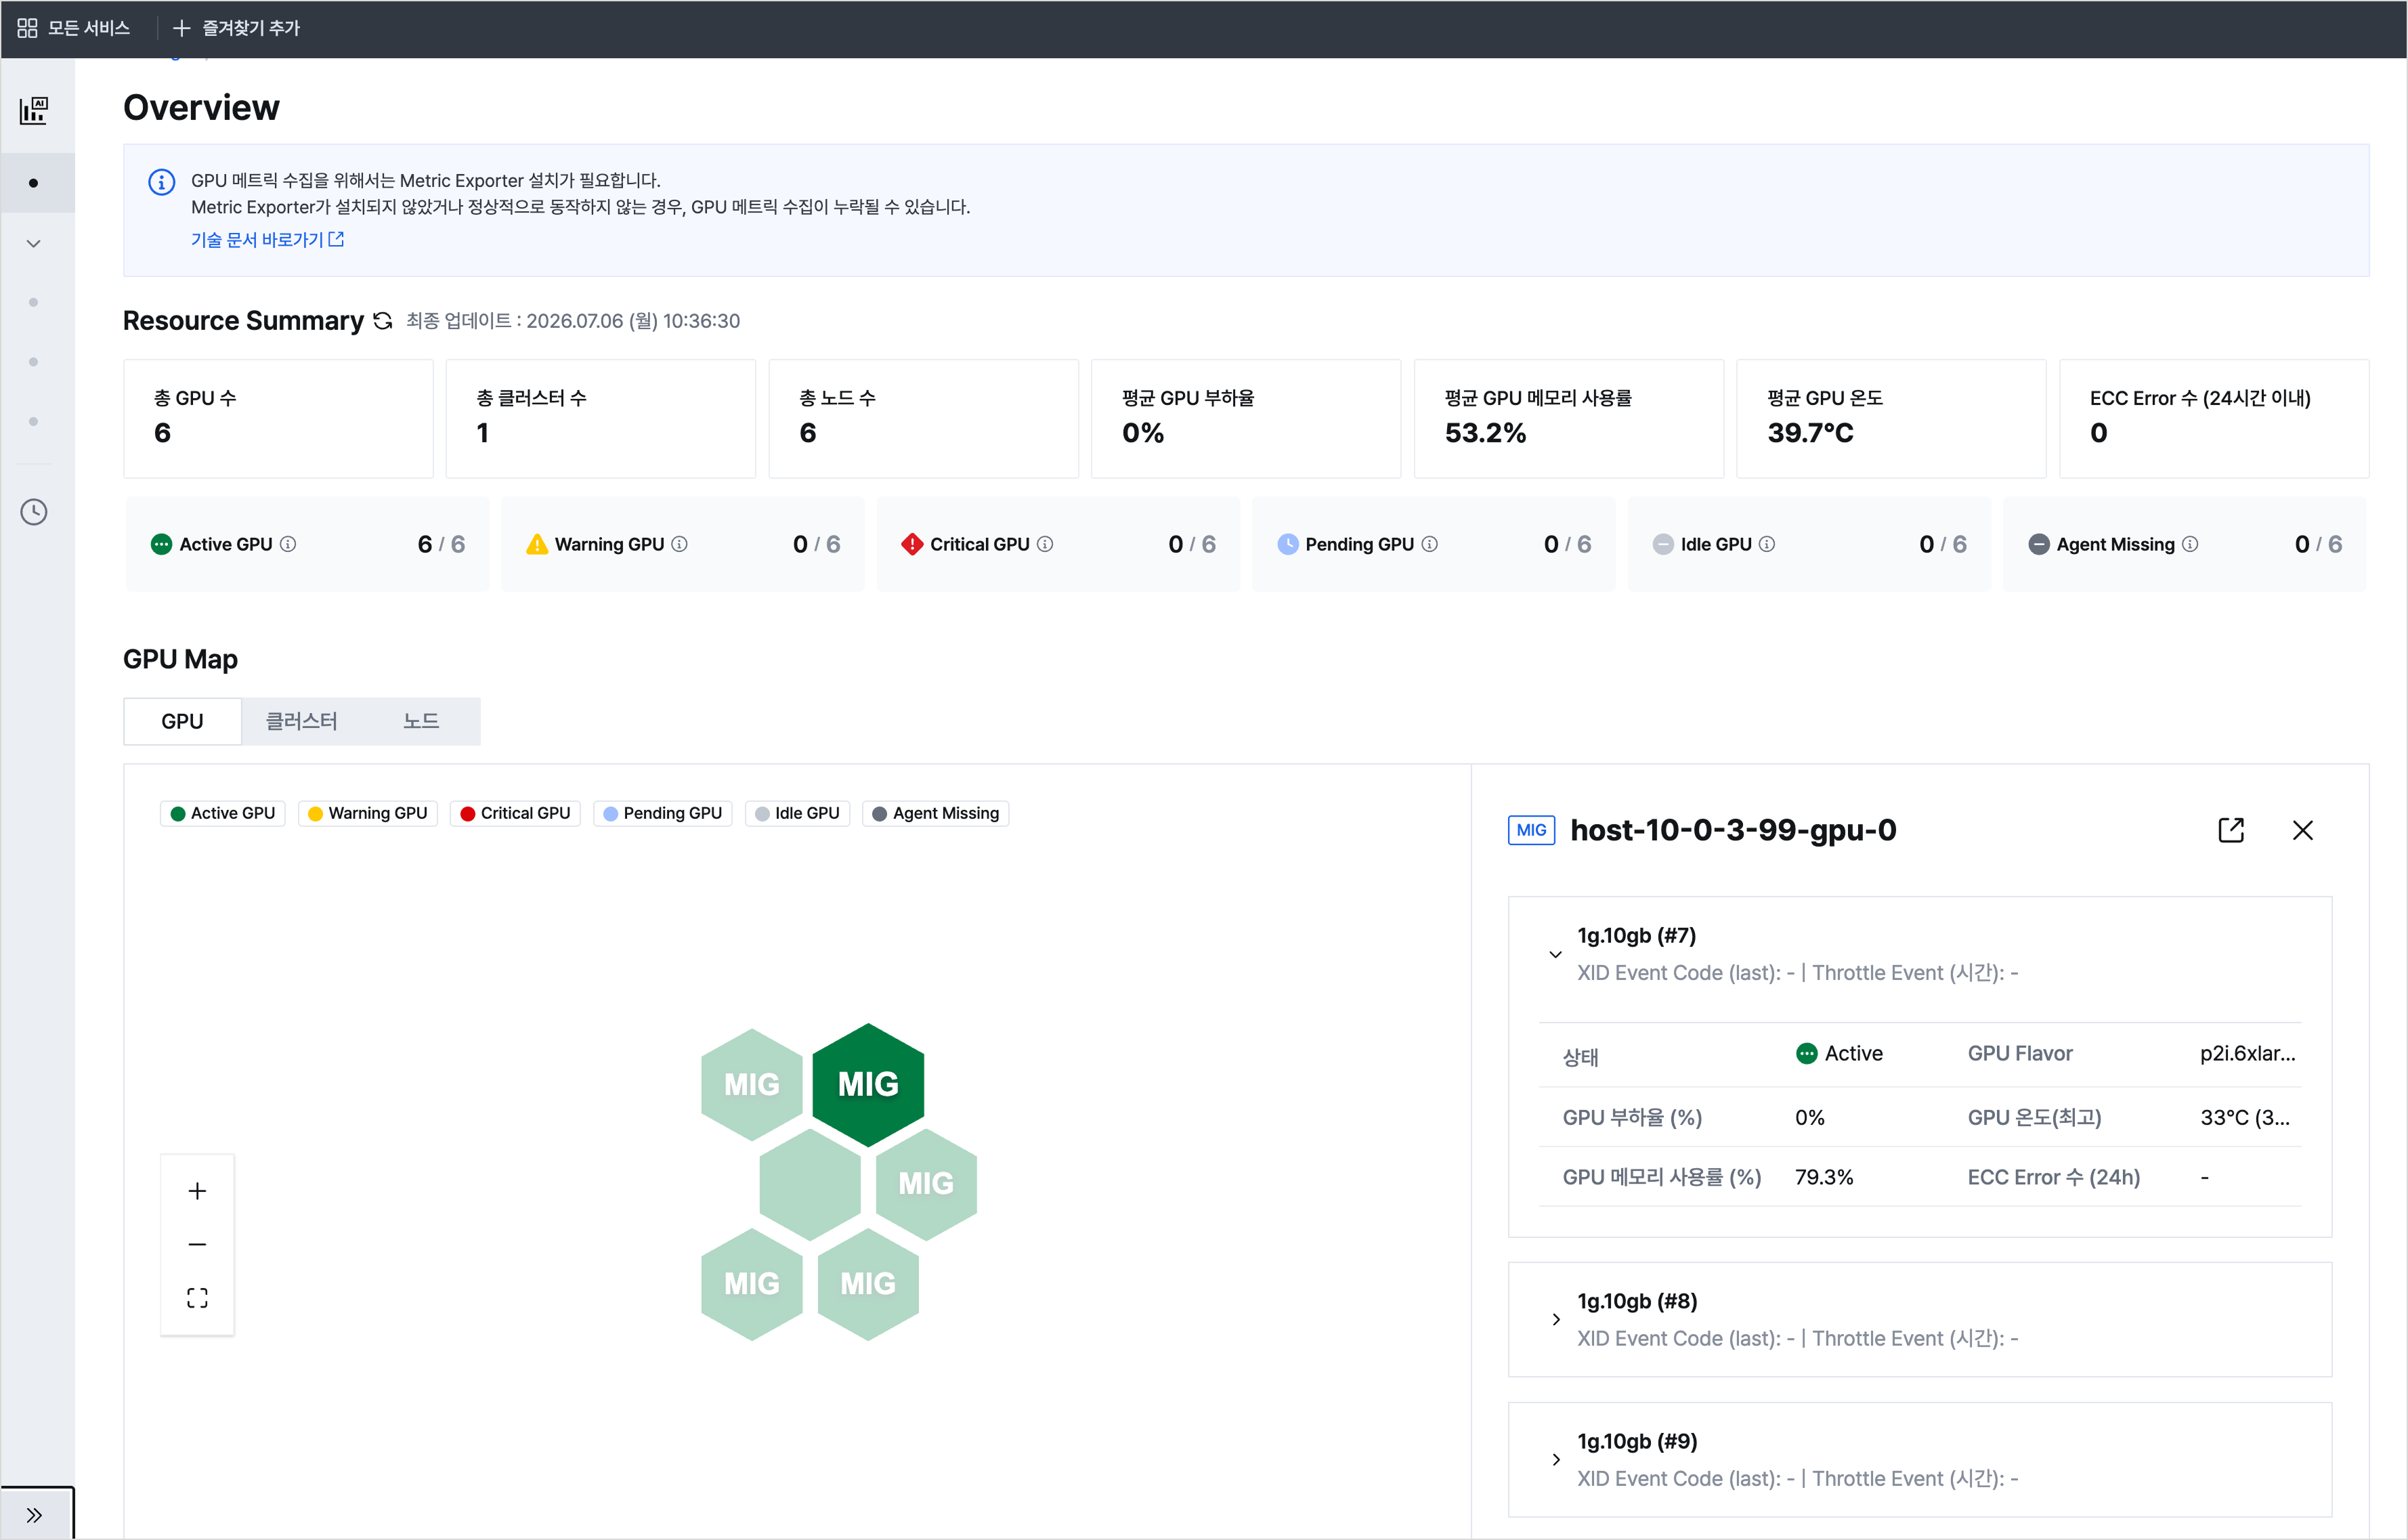
1 AI Insight > Overview

For example, you can answer questions such as:

  • How many of the total GPUs are currently being used normally?
  • Are any GPUs left idle after training jobs have completed?
  • Which GPUs require inspection because they are in Warning or Critical status?
  • Are there any resources where metric collection components are not working properly?

When you need to quickly narrow down targets with abnormal signs

As the number of resources under operation increases, it becomes difficult to find inspection targets by checking the full list one by one. AI Insight uses GPU Map to visualize resources by GPU, cluster, and node, and separates them by status.

In GPU Map, resources are distinguished by status color. When you select a specific GPU or MIG instance, you can immediately check key status and event information in the right panel.

Users can select resources in Warning or Critical status and immediately check GPU utilization, GPU memory usage, GPU temperature, ECC errors, XID event codes, throttle events, and more. This helps narrow down problematic resources first and then continue root cause analysis from the detail screen if needed.

When you need to analyze the cause by resource hierarchy

After identifying the target to inspect, you need to determine which layer the problem started from. The issue may come from the compute resource itself, or it may be a situation where CPU, memory, disk, or network bottlenecks on the execution node affect the workload.

In this release, AI Insight provides detailed metrics at the cluster, node, and GPU levels to help narrow down the problem scope step by step. At the cluster level, you can compare overall resource patterns. At the node level, you can check CPU, memory, disk, and network status together. At the GPU level, you can review trends in utilization, memory usage, temperature, idle rate, throttling, and ECC errors for each GPU or MIG instance.

In GPU Explorer, you can view metric trends, anomalies, and correlations by time range based on the selected cluster, node, and GPU.
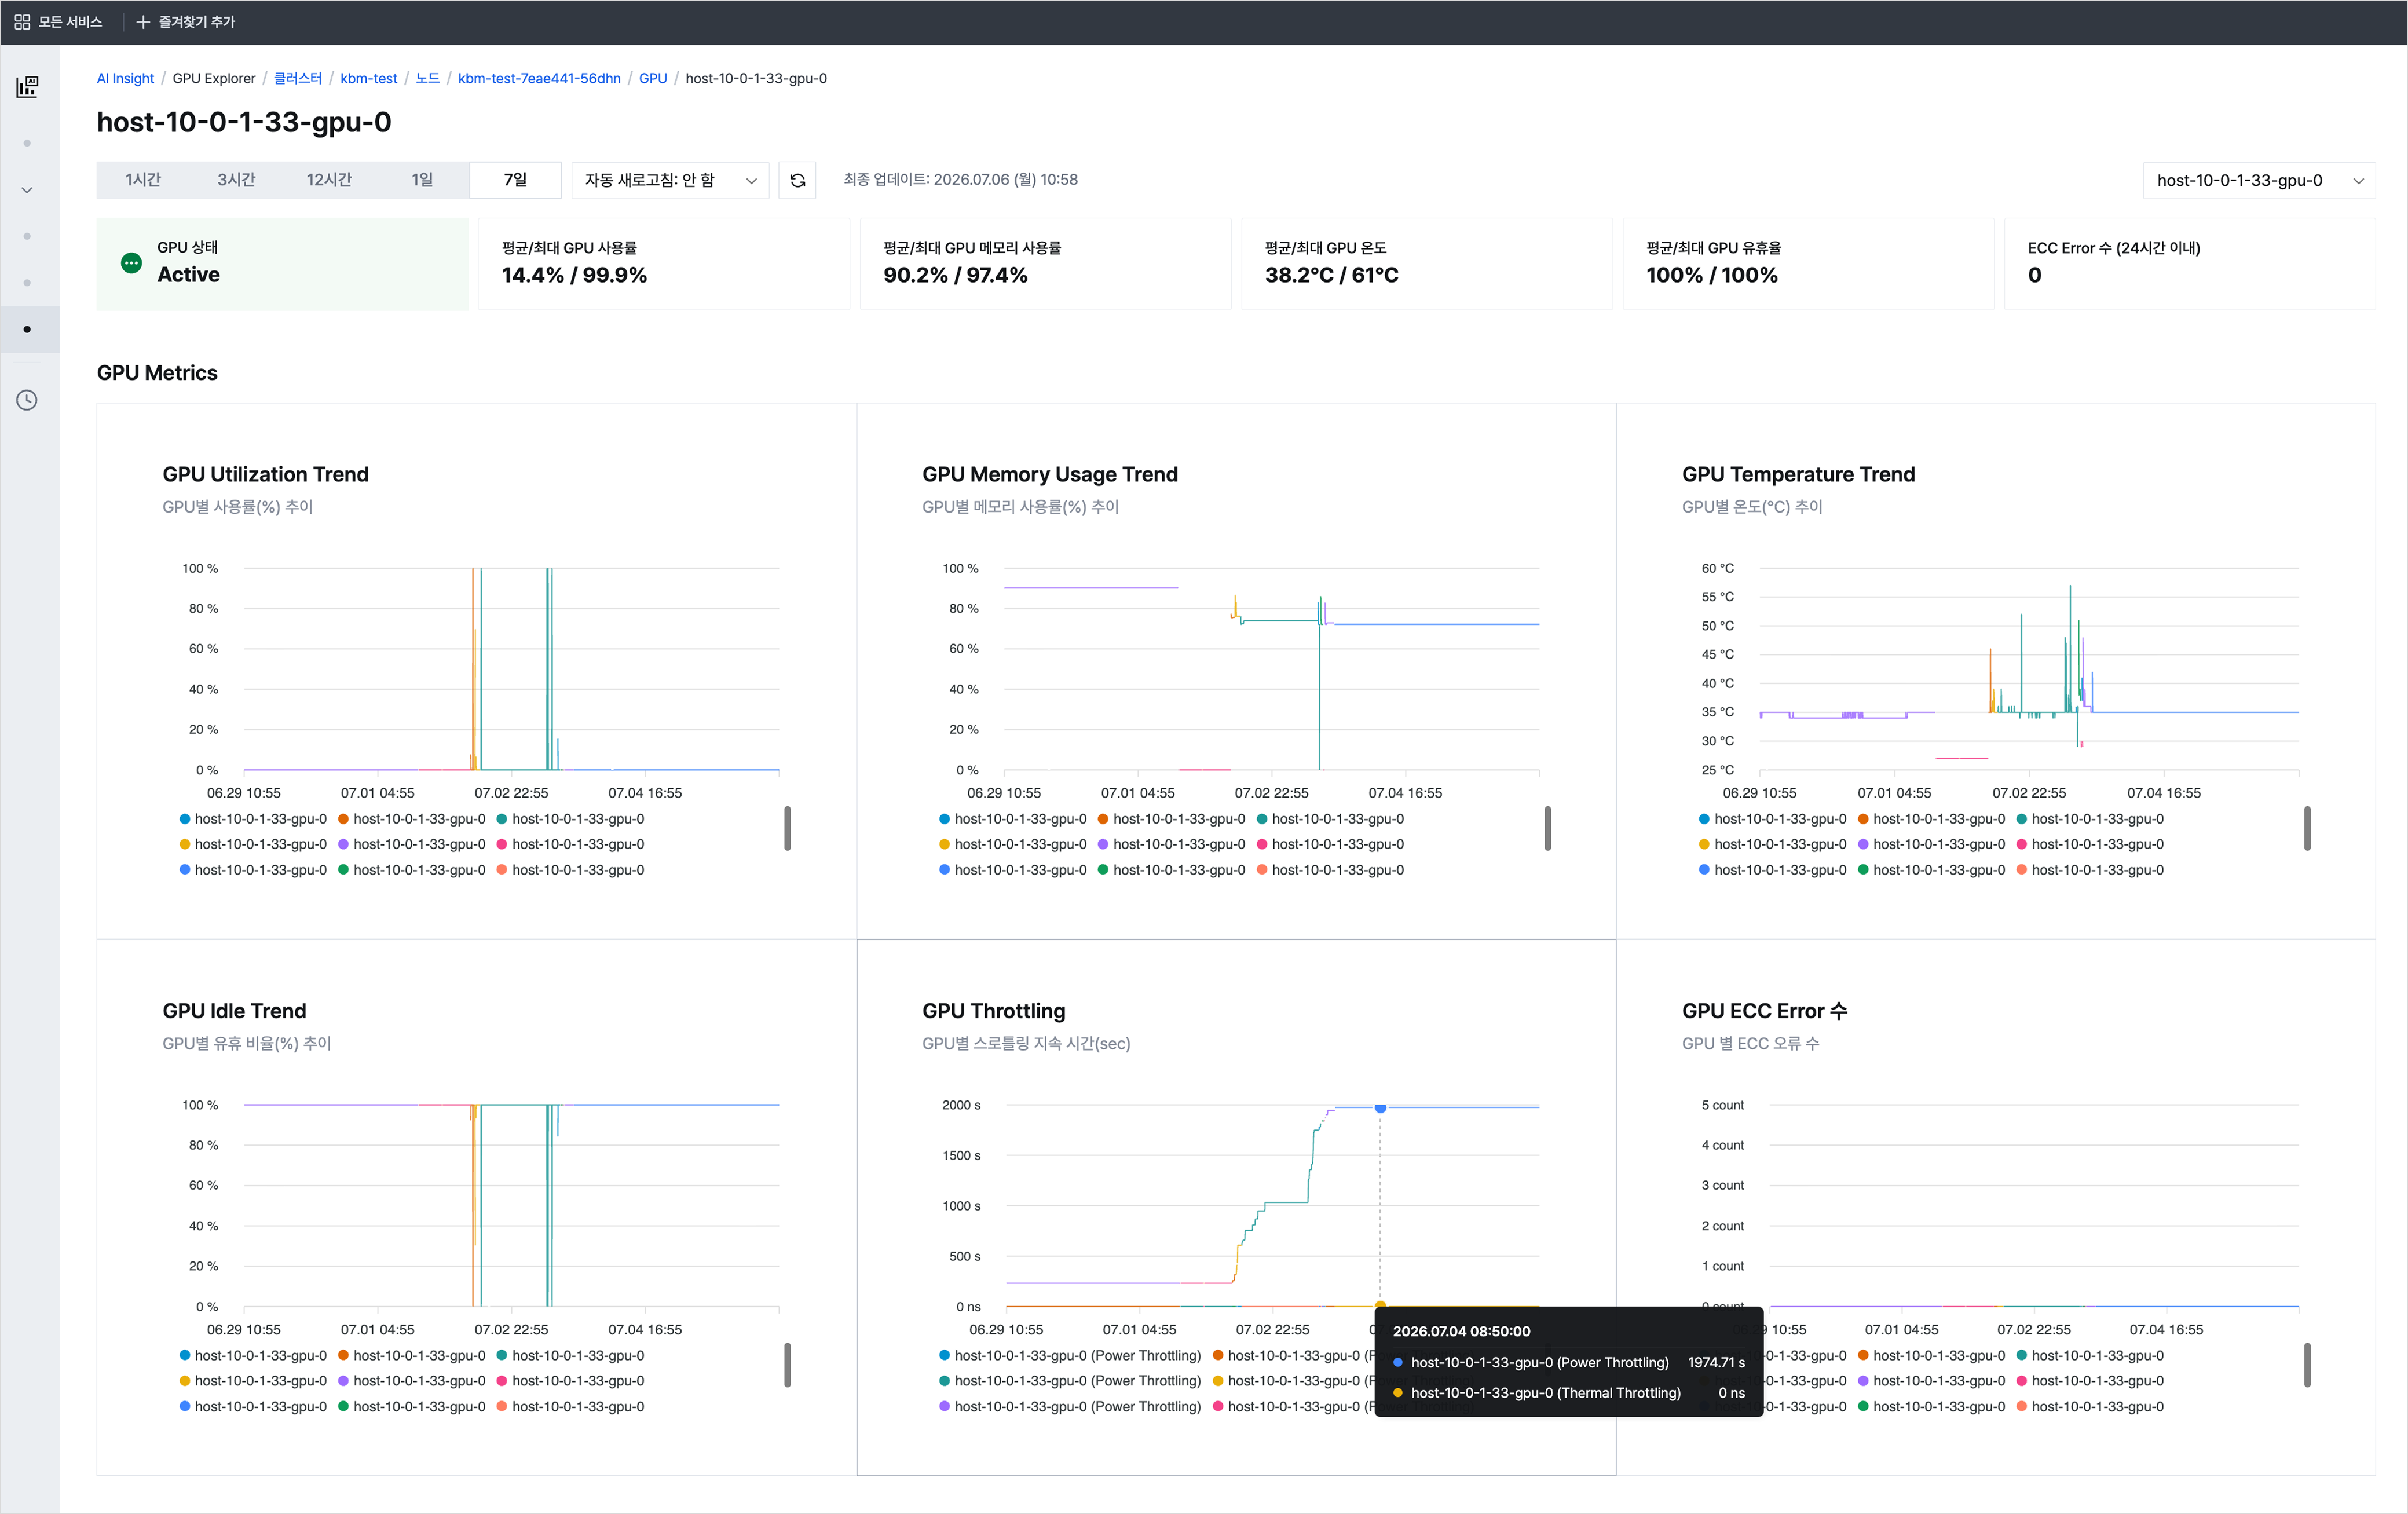
1 AI Insight > GPU Explorer > GPU monitoring

During this process, you can check whether only a specific resource shows a different pattern, whether any target has a high temperature compared to its utilization, or whether node system resource bottlenecks appear at the same time.

When you need to monitor multiple runtime environments with the same criteria

AI workloads can run on GPU nodes based on Kubernetes Engine or on GPU nodes based on Virtual Machine. Operators need to check GPU status and key metrics using the same criteria, regardless of the runtime environment.

AI Insight is designed to support both Kubernetes Engine (KE)-based GPU nodes and Virtual Machine (VM)-based GPU nodes.
After you install Metric Exporter or a monitoring agent in the target environment, AI Insight collects GPU metrics and displays them in the console.

However, if metric collection components are not installed or are not working properly, the corresponding resource may appear in Agent Missing status. In this case, refer to the Metric Exporter installation documentation and check the collection configuration first.

Expanding into an AI observability service

Starting with GPU monitoring, AI Insight helps users view the status of key resources required for AI workload operations at a glance and analyze the causes of abnormal signs more quickly.

As AI workloads become more complex, what operations need is not more information, but visibility: the ability to find the right information at the right time and identify causes quickly. Starting with AI Insight, KakaoCloud will continue expanding operational visibility across AI workloads and enhancing AI observability services.


👉 Learn more about AI Insight
👉 Start KakaoCloud now

KakaoCloud service updates - VM and Hadoop performance improvements, IAM security settings, and more

· 4 min read
Mia (정혜원)
Technical Contents Manager
update

This year, KakaoCloud is continuing to move forward without pause to provide users with a more convenient and secure cloud environment. With the warm arrival of spring, we are sharing a roundup of major service updates from March.

If the recently announced user-centered console renewal was a major change to screen structure and experience (UX), this post focuses on service feature enhancements that strengthen the foundation. Along with work to improve system stability, review the details of this update, which further improves resource management efficiency and security.


🖥️ Infrastructure management efficiency and service scalability

  • GPU service integrated into Virtual Machine (VM): For more intuitive resource management, the previously separate GPU service has been integrated into the Virtual Machine service.

    • Integrated environment provided: You can now select and manage general instances and GPU instances within the same workflow when creating a VM.
    • Automatic notification policy conversion: As part of the service integration, Alert Center notification policies previously configured in the GPU service have been safely and automatically converted into Virtual Machine service policies. You can continue using the existing monitoring environment without separate reconfiguration.
  • Virtual Machine supports "start credits" for t1i instances: To improve workload processing efficiency, the start credit feature has been added to t1i, a burstable instance type. Instances can now temporarily maintain high CPU utilization during boot, dramatically improving initial startup speed.

  • Hadoop Eco expands node volume size up to 16 TB: To support large-scale data analysis, the maximum volume size per node (master, worker, task) in Hadoop Eco has been significantly increased from 5 TB to up to 16 TB. Analyze larger volumes of data without storage constraints.

  • Object Storage product name changed: To make it easier for users to recognize the storage services they are using, Object Storage product names have been changed as follows. Pricing remains the same, and changes will be applied sequentially starting with March billing statements.

    • Data capacity: Hot Bucket → Standard Storage Class
    • API calls: The Standard- prefix is added before existing request names (for example, Standard-PUT, Standard-GET, and so on)

🔑 Security enhancements

  • IAM security settings enhanced: To protect valuable organizational resources, various security settings have been added to Account settings and IAM service items in the console.

    • Password reauthentication when deleting resources: When deleting a user account or project service account, a password reauthentication step has been added to prevent simple mistakes.
    • Immediate session and token expiration option: When changing a password, all currently logged-in sessions and issued access tokens can be invalidated immediately. This helps respond quickly to security incidents in emergency situations where account leakage is suspected.
    • Expanded Cloud Trail audit logs: 17 new event types have been added so that security policy and account management history can be tracked in more detail.

🛠️ Improved developer convenience

  • New OpenAPI support for MySQL: OpenAPI support for developers has been expanded further. With this update, MySQL OpenAPI has been newly added, allowing KakaoCloud MySQL to be controlled directly by API and used for management automation. For detailed OpenAPI updates, see OpenAPI Changelogs.

That is all for this update. In addition to the feature improvements introduced here, detailed changes for each service and previous update history can be found in the service-specific release notes in the technical documentation.

KakaoCloud will continue doing its best to provide stable infrastructure and user-centered features.
If you have any questions about using the service, please contact KakaoCloud Support anytime.

👉 Start KakaoCloud now

Building MLOps workflows with Kubeflow

· 7 min read
Update Kubeflow


Hello. In this post, we introduce Kubeflow, a core platform for machine learning operations.

Kubeflow is an open-source project designed to reduce the complexity of machine learning and help data scientists and developers develop and deploy machine learning models more easily and quickly. In the first sentence introducing Kubeflow on the official Kubeflow site, it is described as a project that helps comprehensively manage and operate various open-source tools for machine learning on Kubernetes.

Starting from TensorFlow Extended (TFX), which Google used internally in the past, Kubeflow has now expanded into one of the most widely known end-to-end solutions for running machine learning workflows in various Kubernetes-based environments.

One of Kubeflow's most innovative approaches is the integration of AutoML and Kubeflow Pipelines. This allows users to automate and optimize the training, evaluation, and deployment stages of models, reducing repetitive work in machine learning projects. In addition, multi-tenant support has been strengthened so that multiple teams can effectively share the same Kubeflow instance while isolating resources. The Kubeflow service provided by KakaoCloud is also designed to maximize the efficiency of machine learning work and make it easy for users to access.

In this post, we introduce Kubeflow's major components, latest features, and various tutorial scenarios for using Kubeflow on KakaoCloud.

Kubeflow features

Kubeflow supports the following tasks in Kubernetes environments with the goal of flexible scaling and easy, convenient production deployment of machine learning models.

  • Easy, repeatable, and portable deployment: Pipelines created through Kubeflow make deployment easier across multiple environments, including cloud and on-premises environments.
  • Independent microservice deployment and management system: Based on a microservices architecture, Kubeflow enables independent management of each component.
  • Responsive scaling based on user requirements: Resources are automatically scaled according to user requirements to ensure optimal performance.

Key Kubeflow components

Kubeflow consists of multiple open-source components such as Central Dashboard, Jupyter Notebooks, Tensorboard, and Pipelines, each supporting a specific stage of the machine learning workflow. These components are designed to help users manage machine learning projects more efficiently.


Source: Kubeflow Ecosystem

Using these key components on Kubernetes, Kubeflow efficiently supports the entire process from machine learning model development and deployment to resource management.

Key Kubeflow componentDescription
Central Dashboard   Provides a dashboard web console for accessing and monitoring multiple components.
NotebooksProvides a Jupyter Notebook environment where data scientists can code directly within a cluster.
TensorboardCreates and manages Tensorboard Server, a tool for visualizing model training processes and training data provided by frameworks such as Tensorflow and PyTorch.
PipelinesSimplifies complex machine learning workflows through scalable Docker-based pipelines.
KatibAutomates hyperparameter tuning for model training through AutoML components such as Katib.
Training OperatorSupports various machine learning frameworks and enables flexible training jobs.
KServeEnables efficient model deployment and serving through model-serving add-ons such as KServe, and provides them as real-time APIs internally and externally.

KakaoCloud Kubeflow

KakaoCloud supports the latest features, including Kubeflow 1.6, and provides an optimized cloud environment that enables users to perform machine learning tasks easily and quickly. In particular, KakaoCloud Kubeflow has the following features.

Support for all Kubeflow 1.6 features

KakaoCloud Kubeflow lets you use all major Kubeflow components and add-ons introduced above. You can also install and use frameworks and libraries such as Tensorflow, PyTorch, Apache MXNet, MPI, XGBoost, Chainer, HuggingFace, and OpenAI SDK.

Granular access management

By providing RBAC, users can be assigned namespaces according to their tasks and roles, and permissions can be managed efficiently by user or group. Administrators can also assign quota features by namespace and allocate CPU, memory, GPU memory, and storage resources according to configured usage.

Flexible storage options

In addition to the independent MinIO type, KakaoCloud supports storage repositories of the Object Storage type, enabling more flexible serving of model result files.

Optimized for Nvidia MIG instances

KakaoCloud Kubeflow provides optimized MIG (Multi Instance GPU) instances based on Nvidia A100. MIG instance settings allow GPU resources to be partitioned, enabling users to run multiple workloads efficiently on the same GPU.

Multi File Storage support

Users can dynamically use as much independent File Storage as needed by user or group, making it easier to share files between work pipelines and notebooks.

Usage examples with Kubeflow

KakaoCloud technical documentation provides rich Kubeflow tutorials that cover various stages of machine learning projects, from Jupyter Notebook setup to building parallel training models and creating model-serving APIs. By referring to these tutorials, you can learn about efficient model development, training, optimization, and deployment using KakaoCloud Kubeflow.

The Kubeflow-related tutorials currently available in KakaoCloud technical documentation are as follows.

Closing

Kubeflow is currently one of the most widely used open-source MLOps platforms in Korea and abroad. As a result, educational content, experience cases, and example source code are relatively abundant, helping data scientists and working analysts who are using it for the first time adapt quickly.

KakaoCloud Kubeflow provides GPU optimization and powerful resource management features through easy provisioning that takes advantage of the cloud environment. We will continue improving the Kubeflow service so KakaoCloud users can fully benefit from an MLOps platform with machine learning efficiency and enhanced security. If you are considering using a Kubeflow service for machine learning, be sure to try KakaoCloud's service.

Thank you.