Resource Explorer released: distributed resources in one place


As cloud environments grow, one question naturally follows: "How many resources are we actually using right now?"
Where are the servers, how many volumes are connected, how many public IPs are in use...
Checking each service one by one and organizing everything in a spreadsheet takes time and is prone to mistakes.
To resolve this inconvenience, KakaoCloud has officially released Resource Explorer, a service that makes it easier to view and manage cloud resources.
Resource Explorer is a service that lets you view various resources such as instances, Block Storage, public IPs, and load balancers in one integrated screen by KakaoCloud project. You can search resources by various criteria such as name, ID, status, and tags, and move to the details page of the corresponding resource with one click to continue the tasks you need.
In this post, we announce the release of Resource Explorer and briefly introduce its key features and use cases.
🏷️ How to distinguish resources by "context" - tags!
The ability to classify and filter resources based on tags is especially useful for users.
"Who created this instance?" "Were there this many volumes running?" "Was this for testing or production?"
The simplest and most effective way to answer these questions is tags. Resource Explorer helps you systematically organize and explore cloud resources around this tag feature.
You can assign desired metadata to each resource as key:value tags and give them clear meaning and purpose, as shown below.
Project:Alpha– Belongs to a specific projectEnvironment:Production– Production environmentOwner:ML Team– Responsible organizationBilling:2505– Cost management
Previously, resources were distinguished only by name or resource ID. Now you can understand why a resource exists and what intent it was created with through tags. This meaning-based organization enables much faster and more accurate exploration than a simple list.
For example,
✅ Want to quickly view only AI infrastructure in production?
→ Filter by Environment:Production, Owner:AI Team!
✅ Want to view only test servers created last month?
→ Check immediately with the Environment:Dev, CreateDate:2025-04 tags!
Users can freely create custom tags by combining the keys and values they want, and can easily add tags to selected resources or edit existing tags. System tags automatically attached when resources are created, such as kc:platform, can also be used together.
Check the types of tags here!
In addition, Resource Explorer provides several features that help cloud operators resolve frequently encountered situations faster and more efficiently.
📂 Understand many resources at a glance - Integrated view
Previously, to check resources scattered across services, you had to move between consoles and view them one by one. Now, in Resource Explorer, you can check instances, Block Storage, public IPs, load balancers, and backups all at once. Because you can view the entire resource structure within a project, it can be used as a starting point for asset identification.
"I need to extract a list of all running VMs and public IPs." → Just select the project and the list is generated automatically!
⏱️ Find resources immediately and respond immediately - Fast condition-based search
Finding one or two resources among many can take more time than expected. Resource Explorer provides an exploration feature that lets you combine various conditions such as name, ID, tag, region, and creation date, save search conditions, and quickly reuse them.
"I want to see only Block Storage created last month with 'db' in the name." → Combine conditions to filter and get results in seconds!
🚀 Cloud resource management is now lighter and smarter
Resource Explorer is like the "eyes" of cloud operators.👀 It finds resources that were not visible, visualizes structures that were difficult to understand, and makes reporting and response flows much faster.
Resource Explorer can be used immediately in the KakaoCloud console without separate configuration.
Start KakaoCloud now and experience various services directly.

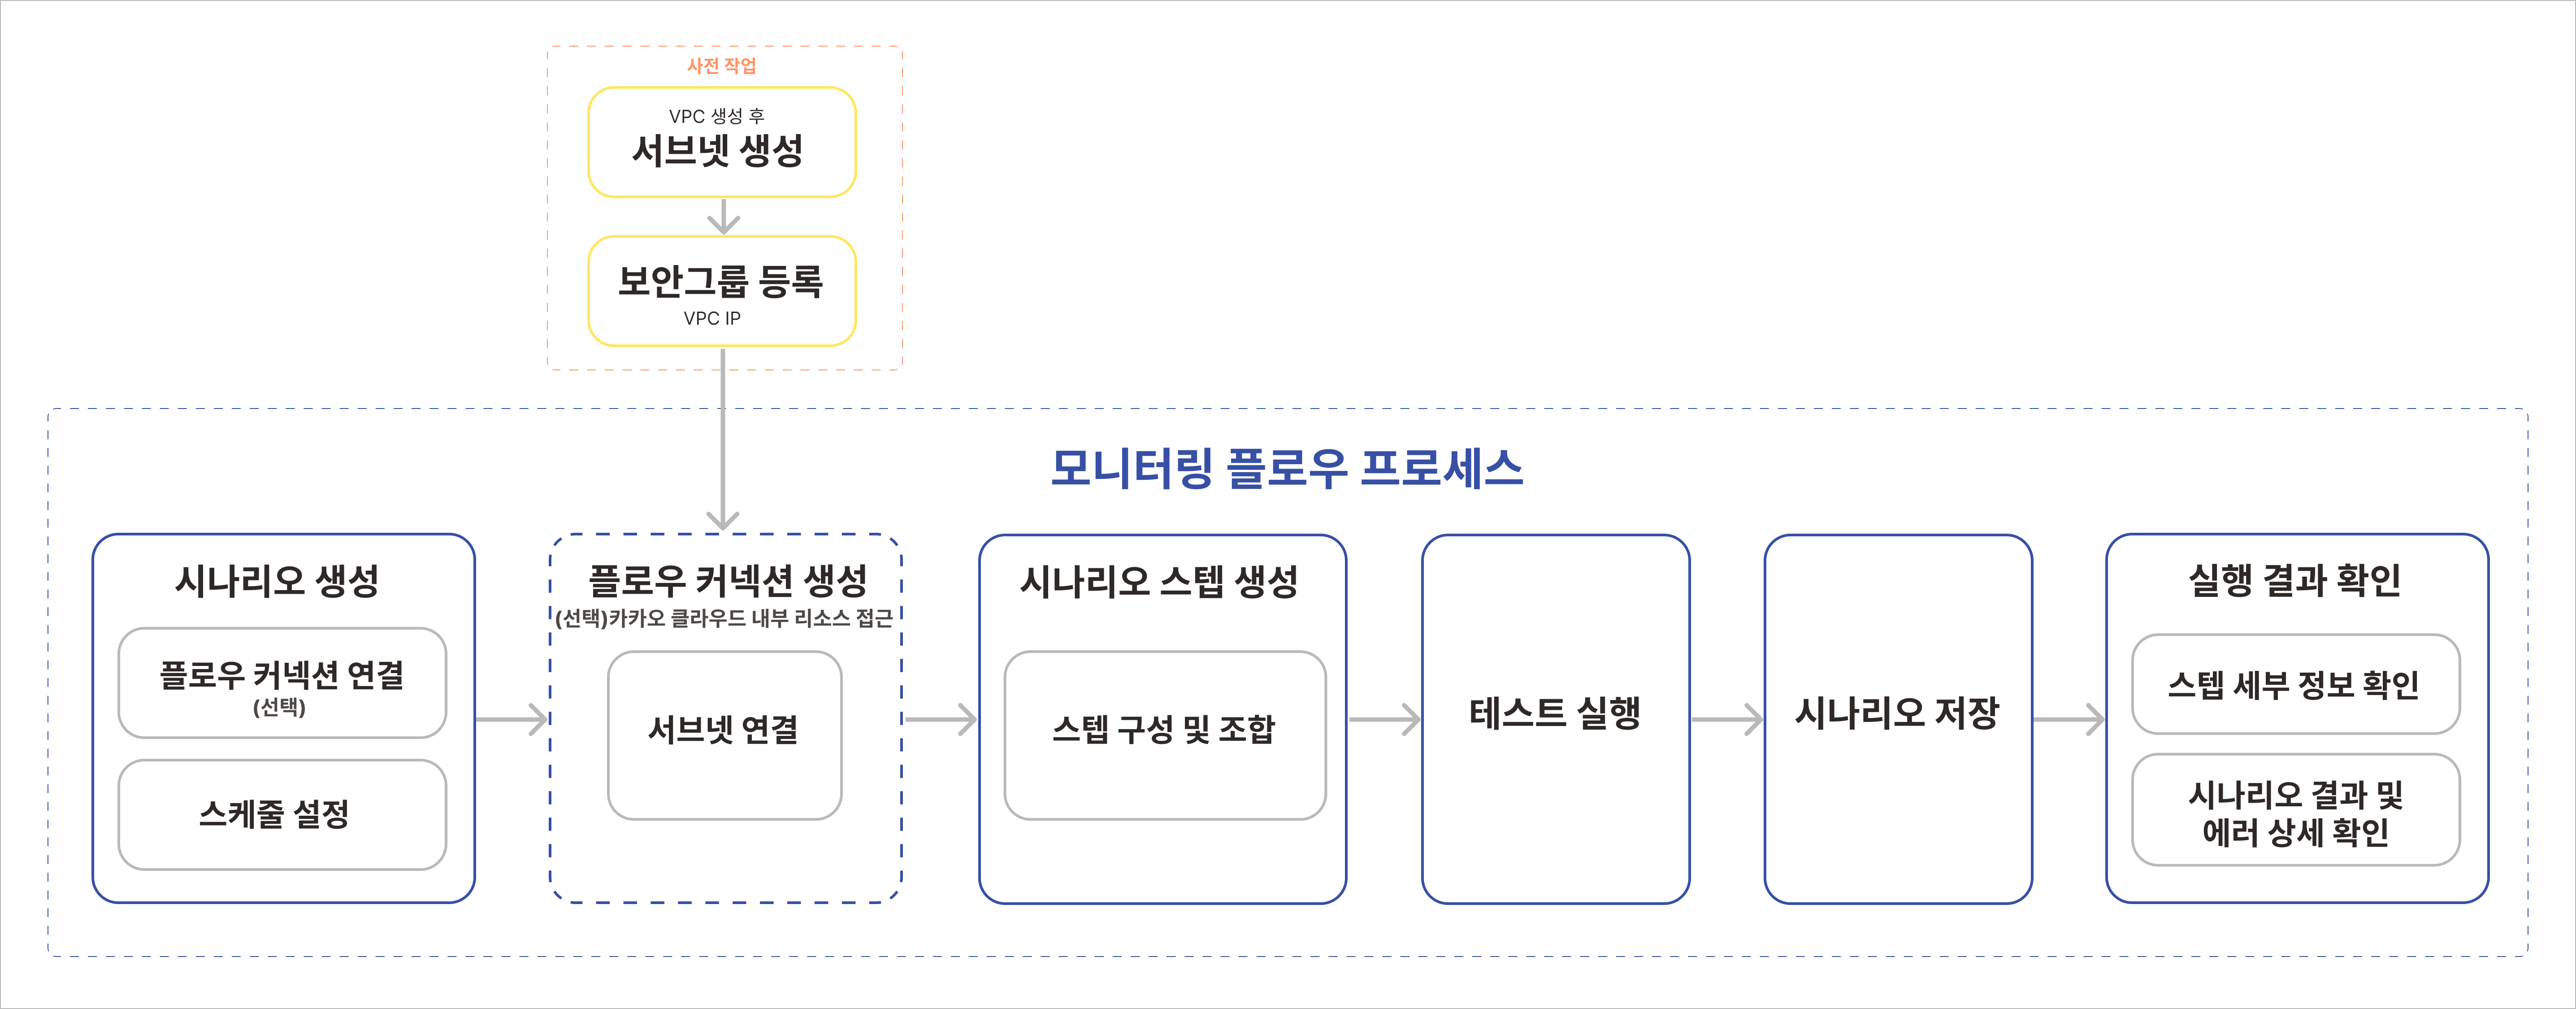 Monitoring Flow process
 Configuration in the Monitoring Flow web console
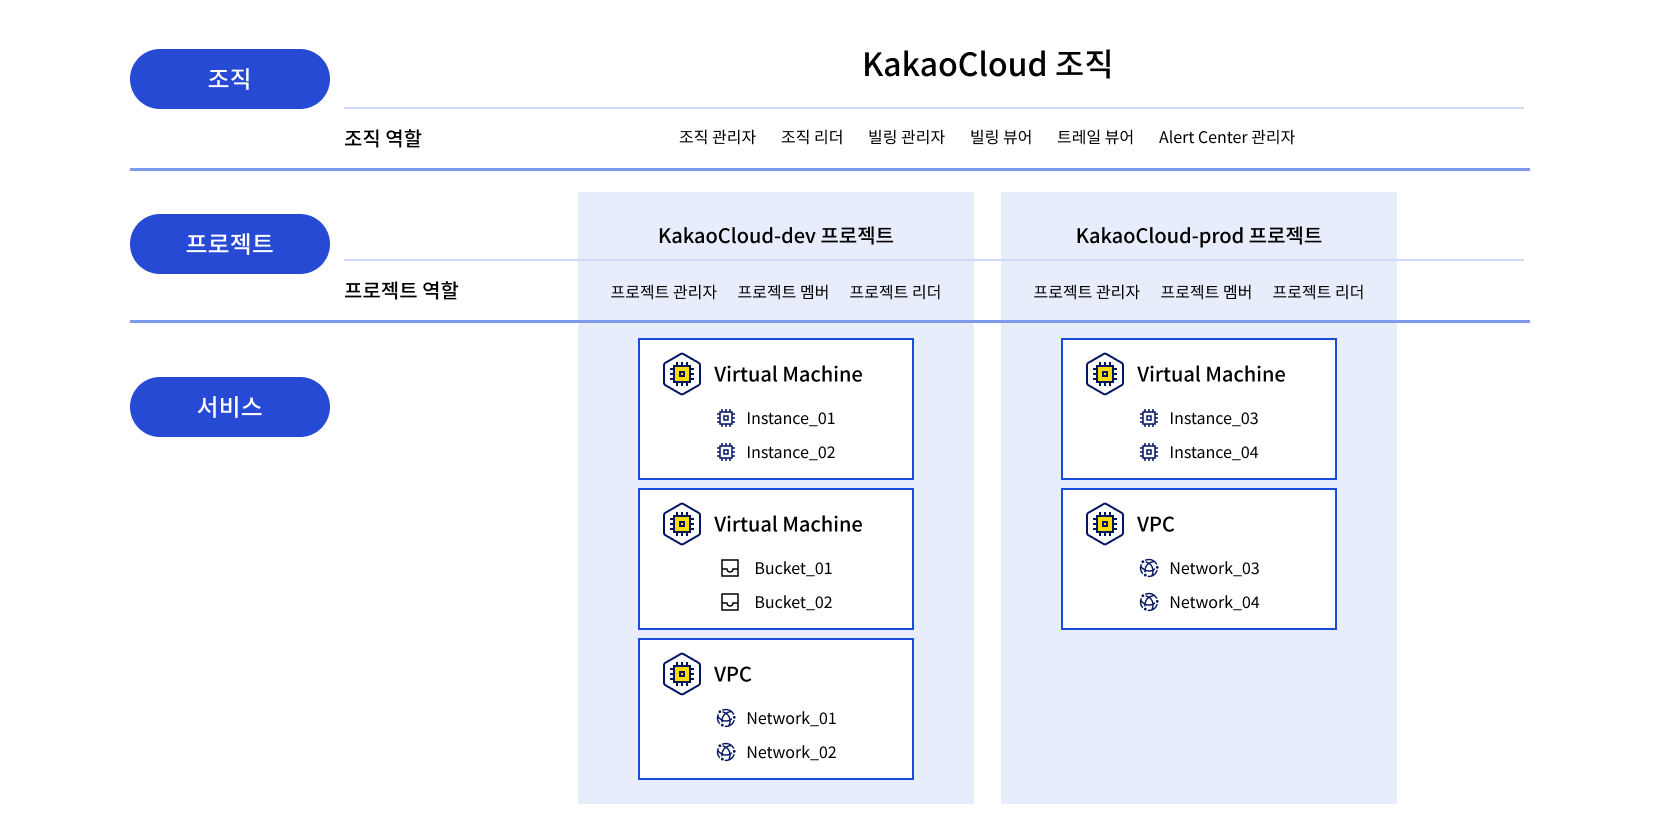 KakaoCloud resource hierarchy