Dashboard layout
The dashboard provides an integrated web UI for accessing assigned Profile and Namespace resources and Modu AI serving features. From the dashboard, you can view and manage LLM serving with InferenceService, Notebook execution, training with TrainJob, volumes, and monitoring in one place.
Dashboard menu layout
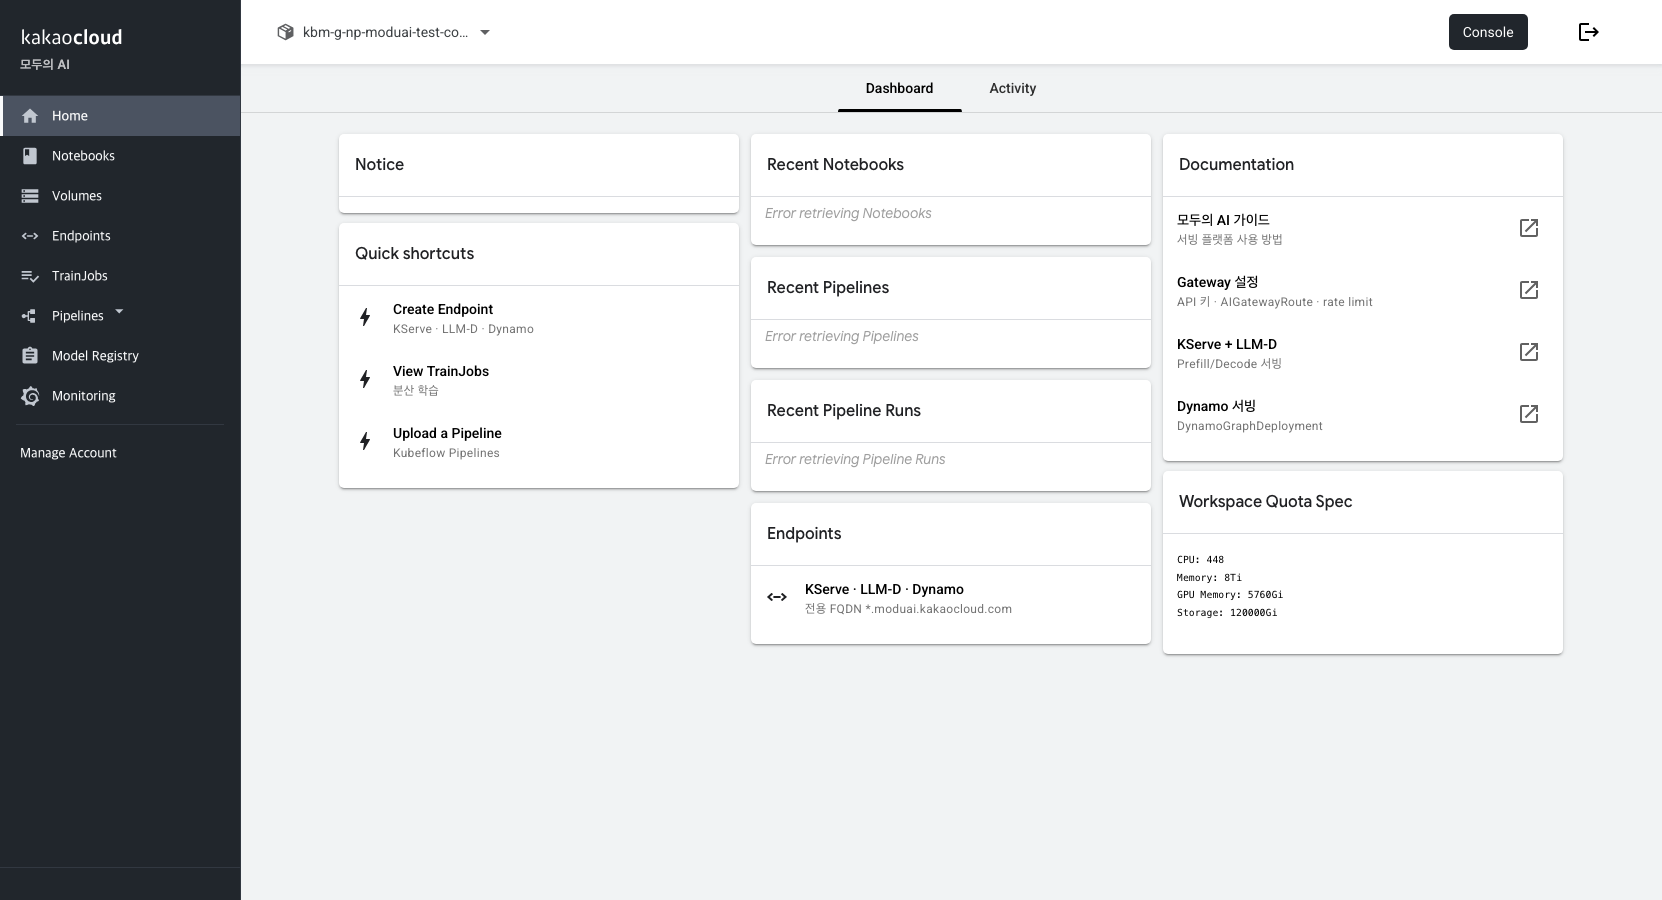 Modu AI dashboard menu layout
| Menu | Description |
|---|---|
| Home | Main dashboard page |
| Notebooks | Create and manage Jupyter Notebook and Code Server instances for development and debugging |
| Volumes | Manage volumes (PVCs) used by Notebook, training, and serving workloads |
| Endpoints | Manage KServe, LLM-D, and Dynamo serving endpoints with dedicated FQDNs |
| TrainJobs | Manage distributed training jobs based on Kubeflow Training Operator |
| Pipelines | Manage pipelines, experiments, runs, recurring runs, artifacts, and executions |
| Model Registry | Manage trained model metadata and versions |
| Monitoring | Monitor Namespace GPU, CPU, disk, and Pod usage in Grafana |
| Manage Account | Manage your user account, including password changes and SSH password verification |
| Manage Group Users | Manage users in the group Namespace. This menu is visible to users with Admin permissions. |
Check Namespace
You can check the Namespace at the top of the dashboard.
 Namespace selector
| Field | Description |
|---|---|
| Namespace | kbm-g-np-<organization-name> — Workspace assigned through a Profile |
| GPU Quota | Maximum number of GPUs allocated to each organization. For example, 128 GPUs are equivalent to 16 nodes with 8 GPUs each. |
managed label | Namespace integrated with Modu AI serving and Gateway features |
Select your assigned Namespace before creating InferenceService, Notebook, or TrainJob resources.
Guides and notices
Guide links and Modu AI notices are available on the right side of the dashboard.
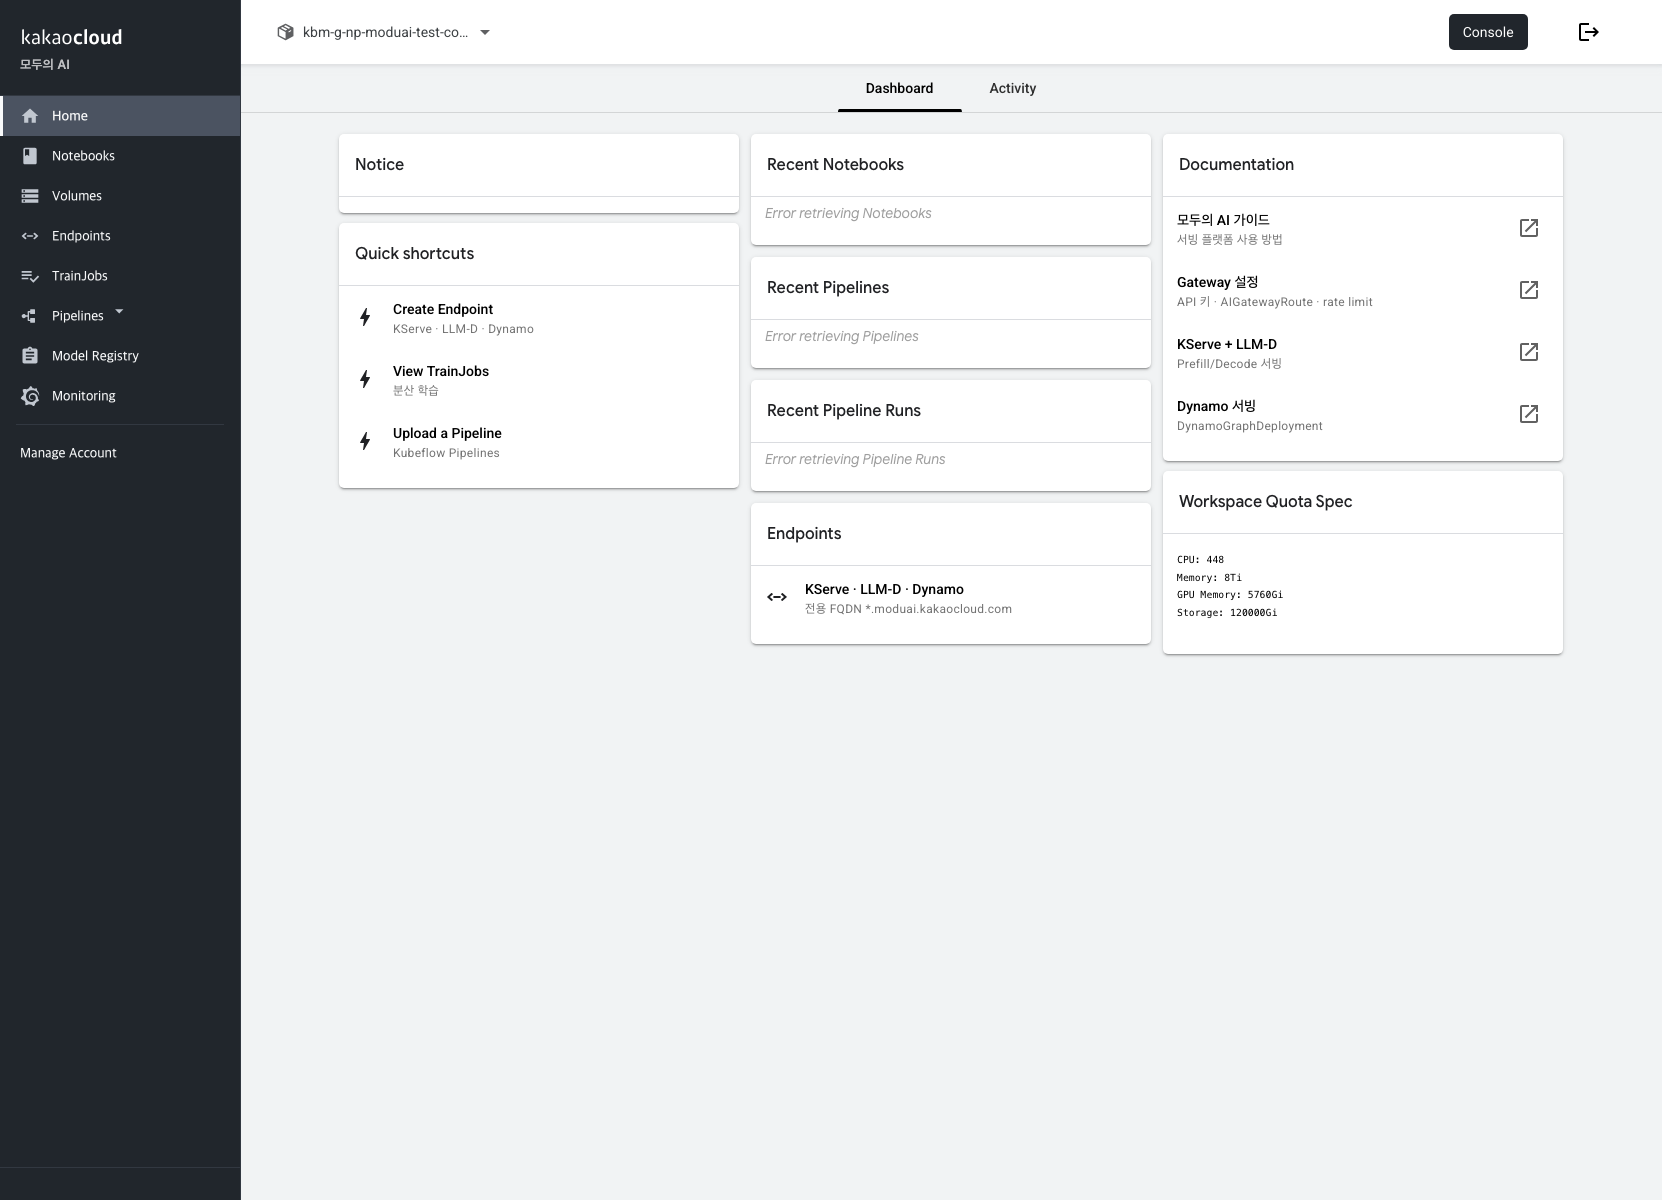 Guide cards on the right side of the Home page
Serving architecture (reference)
Client
  → Dedicated LB → Envoy Gateway
       → HTTPRoute → InferenceService (such as vLLM)
       → Pod (dedicated B200 node pool)
From Endpoints in the dashboard, check the status and URL for each endpoint type. Use the dedicated FQDN (*.moduai.kakaocloud.com) for API calls.