Dashboard setup
Dashboard
The dashboard provides a web-based integrated UI that allows users to access assigned Kubeflow resources and features. Through the dashboard, users can view and manage notebook execution, training job management, AutoML (Katib) experiments, pipeline runs, and model deployment status in one place.
Dashboard menu layout
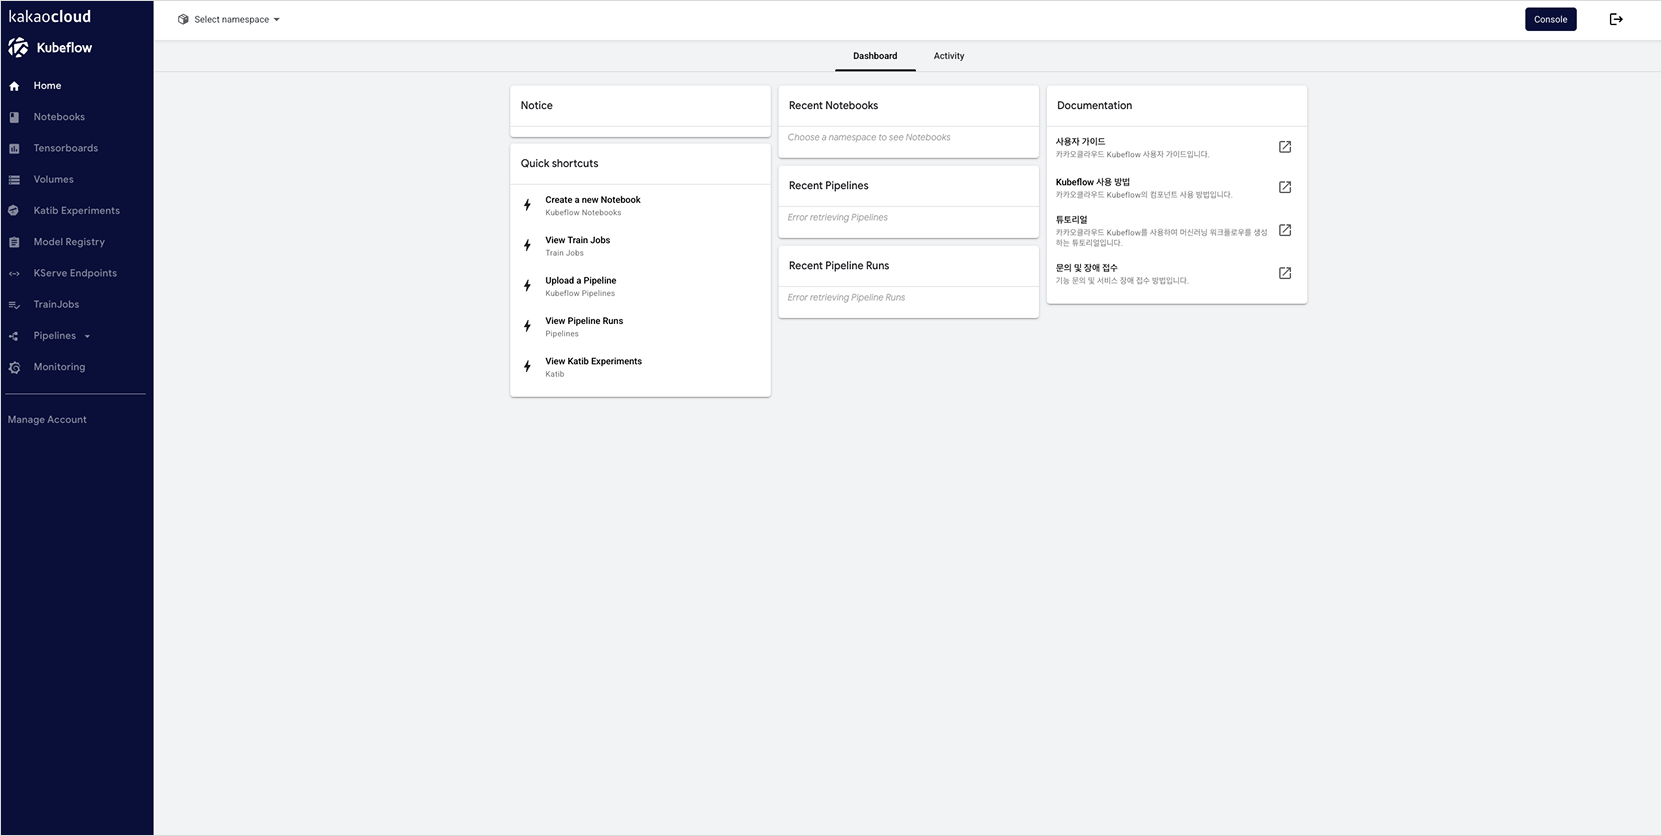 Dashboard menu layout
| Menu | Description |
|---|---|
| Home | Kubeflow dashboard main screen |
| Notebooks | Create and manage Jupyter Notebook servers |
| Tensorboards | Create TensorBoard servers and manage log visualization |
| Volumes | Manage volumes used by notebooks and training jobs |
| Katib Experiments | Manage Katib-based AutoML experiments |
| Model Registry | Manage trained model metadata and versions |
| KServe Endpoints | Manage KServe-based model serving endpoints |
| TrainJobs | Manage training jobs based on the Kubeflow Training Operator |
| Pipelines | Kubeflow Pipelines management menu |
| └ Pipelines | Manage pipeline definitions and uploads |
| └ Experiments | Manage pipeline experiments |
| └ Runs | Manage pipeline run history |
| └ Recurring Runs | Manage recurring pipeline run schedules |
| └ Artifacts | Manage input and output artifacts generated during pipeline runs |
| └ Executions | Track pipeline component execution results |
| Manage Account | Manage user accounts (such as password changes) |
| Manage Group Users | Manage group namespace users (visible when Admin permissions are granted) |
Check namespace
You can check the namespace at the top of the dashboard.
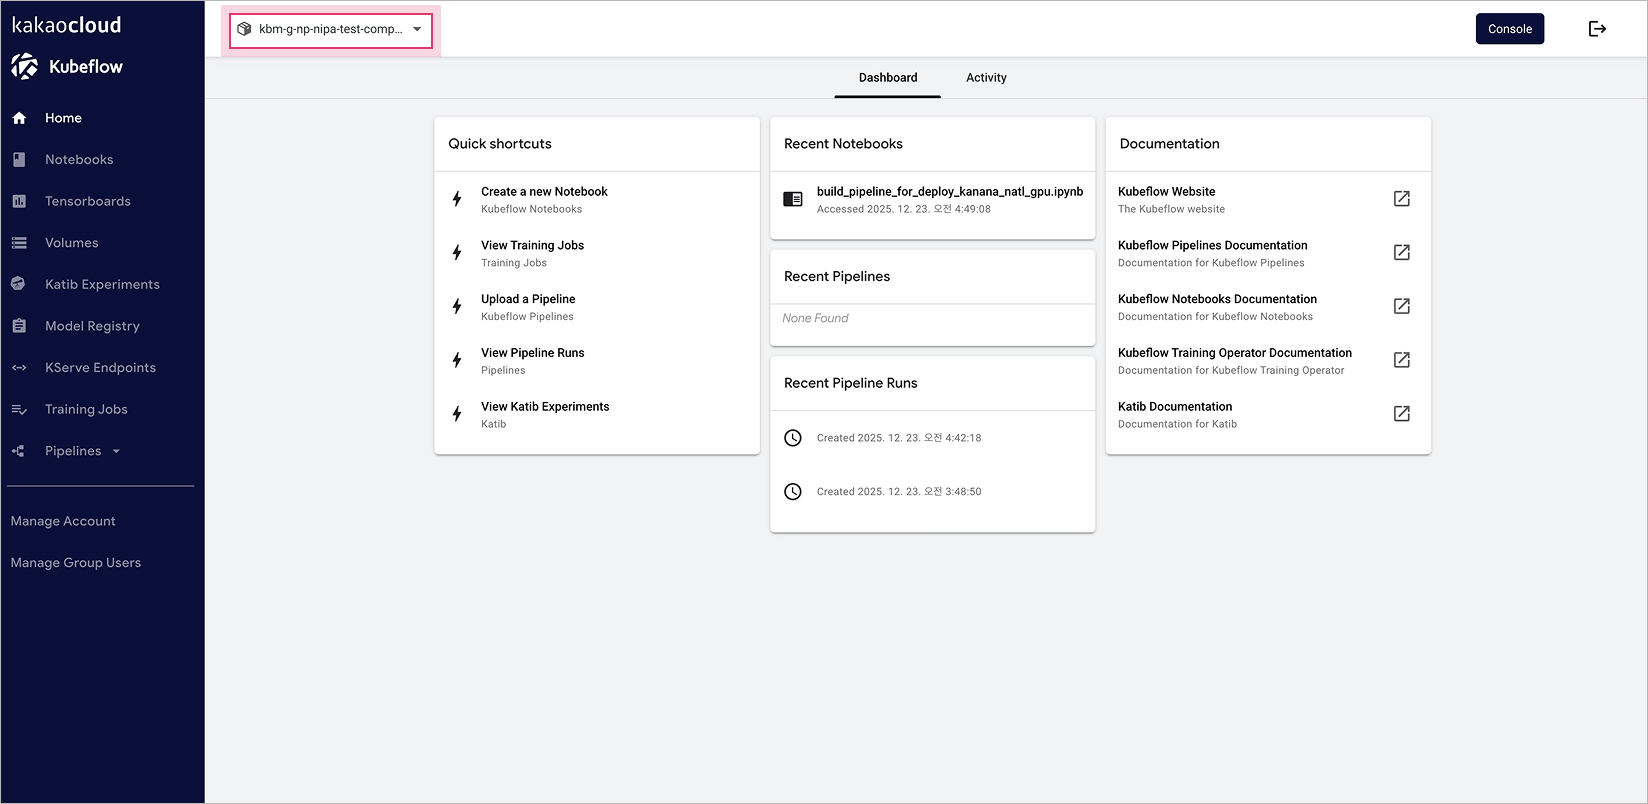 Check namespace
Kubeflow guides and notices
Kubeflow guide links and notices are available on the right side of the dashboard.
info
For detailed instructions, see How to use each menu and the Kubeflow > Central dashboard official documentation.