How to use monitoring
You can monitor in real time the available and used CPU and GPU resources allocated to a namespace, as well as disk resources and pod resource status.
The initial ID and password are both set to the assigned namespace name.
After logging in, change the password using the method described below.
Example
If the namespace is kbm-g-testnamespace, the monitoring login ID and password are both kbm-g-testnamespace.
Access monitoring
-
Click Monitoring from the menu tab in the Kubeflow dashboard.
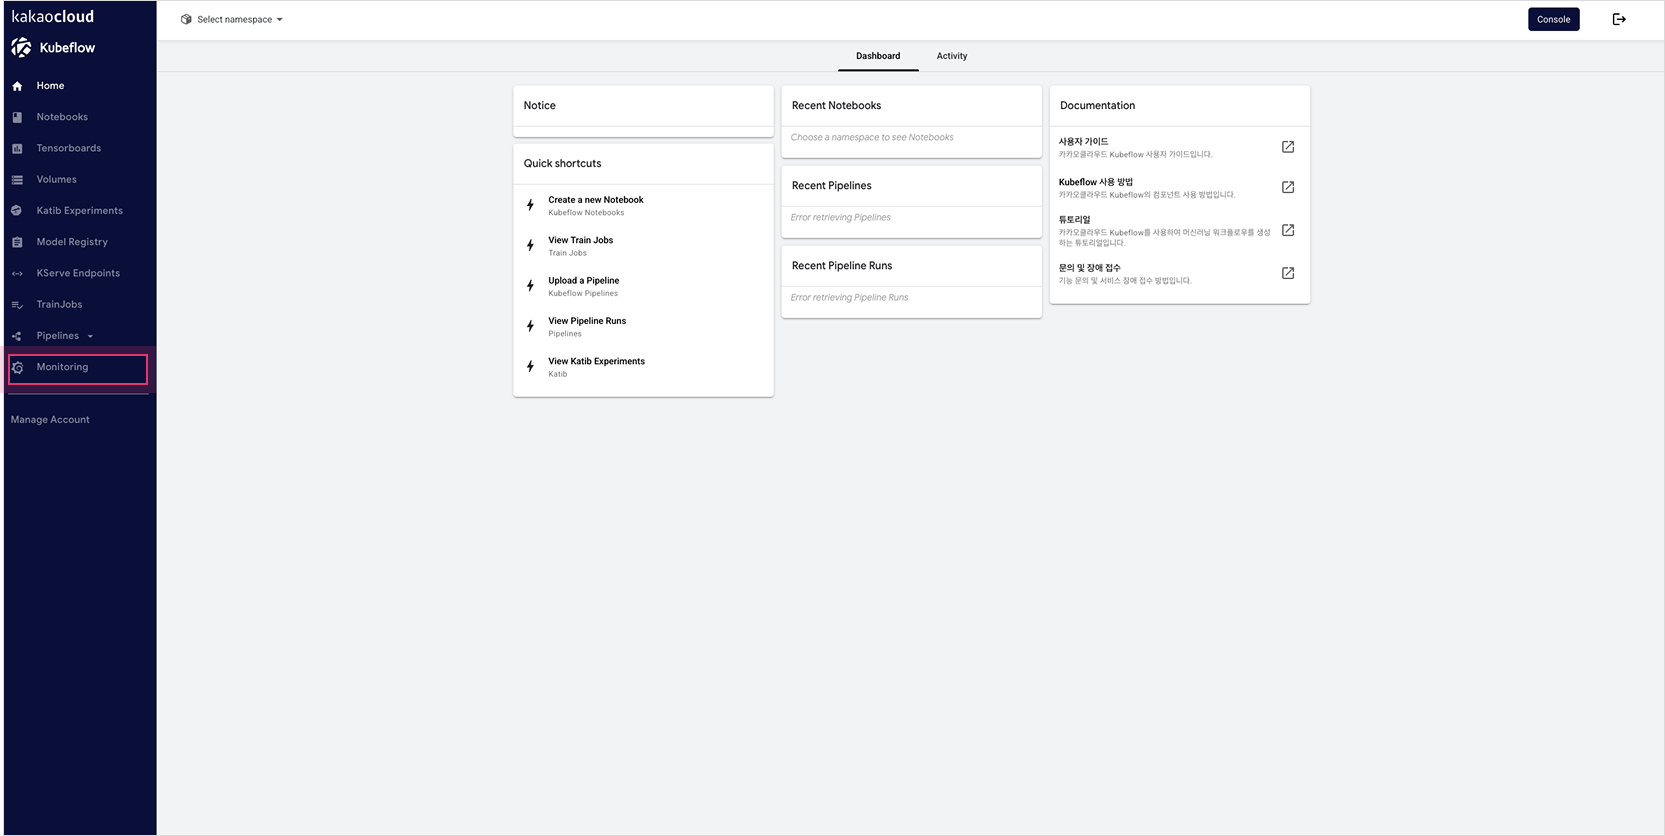 Kubeflow dashboard menu layout
 -
Log in to Grafana using the namespace name and password.
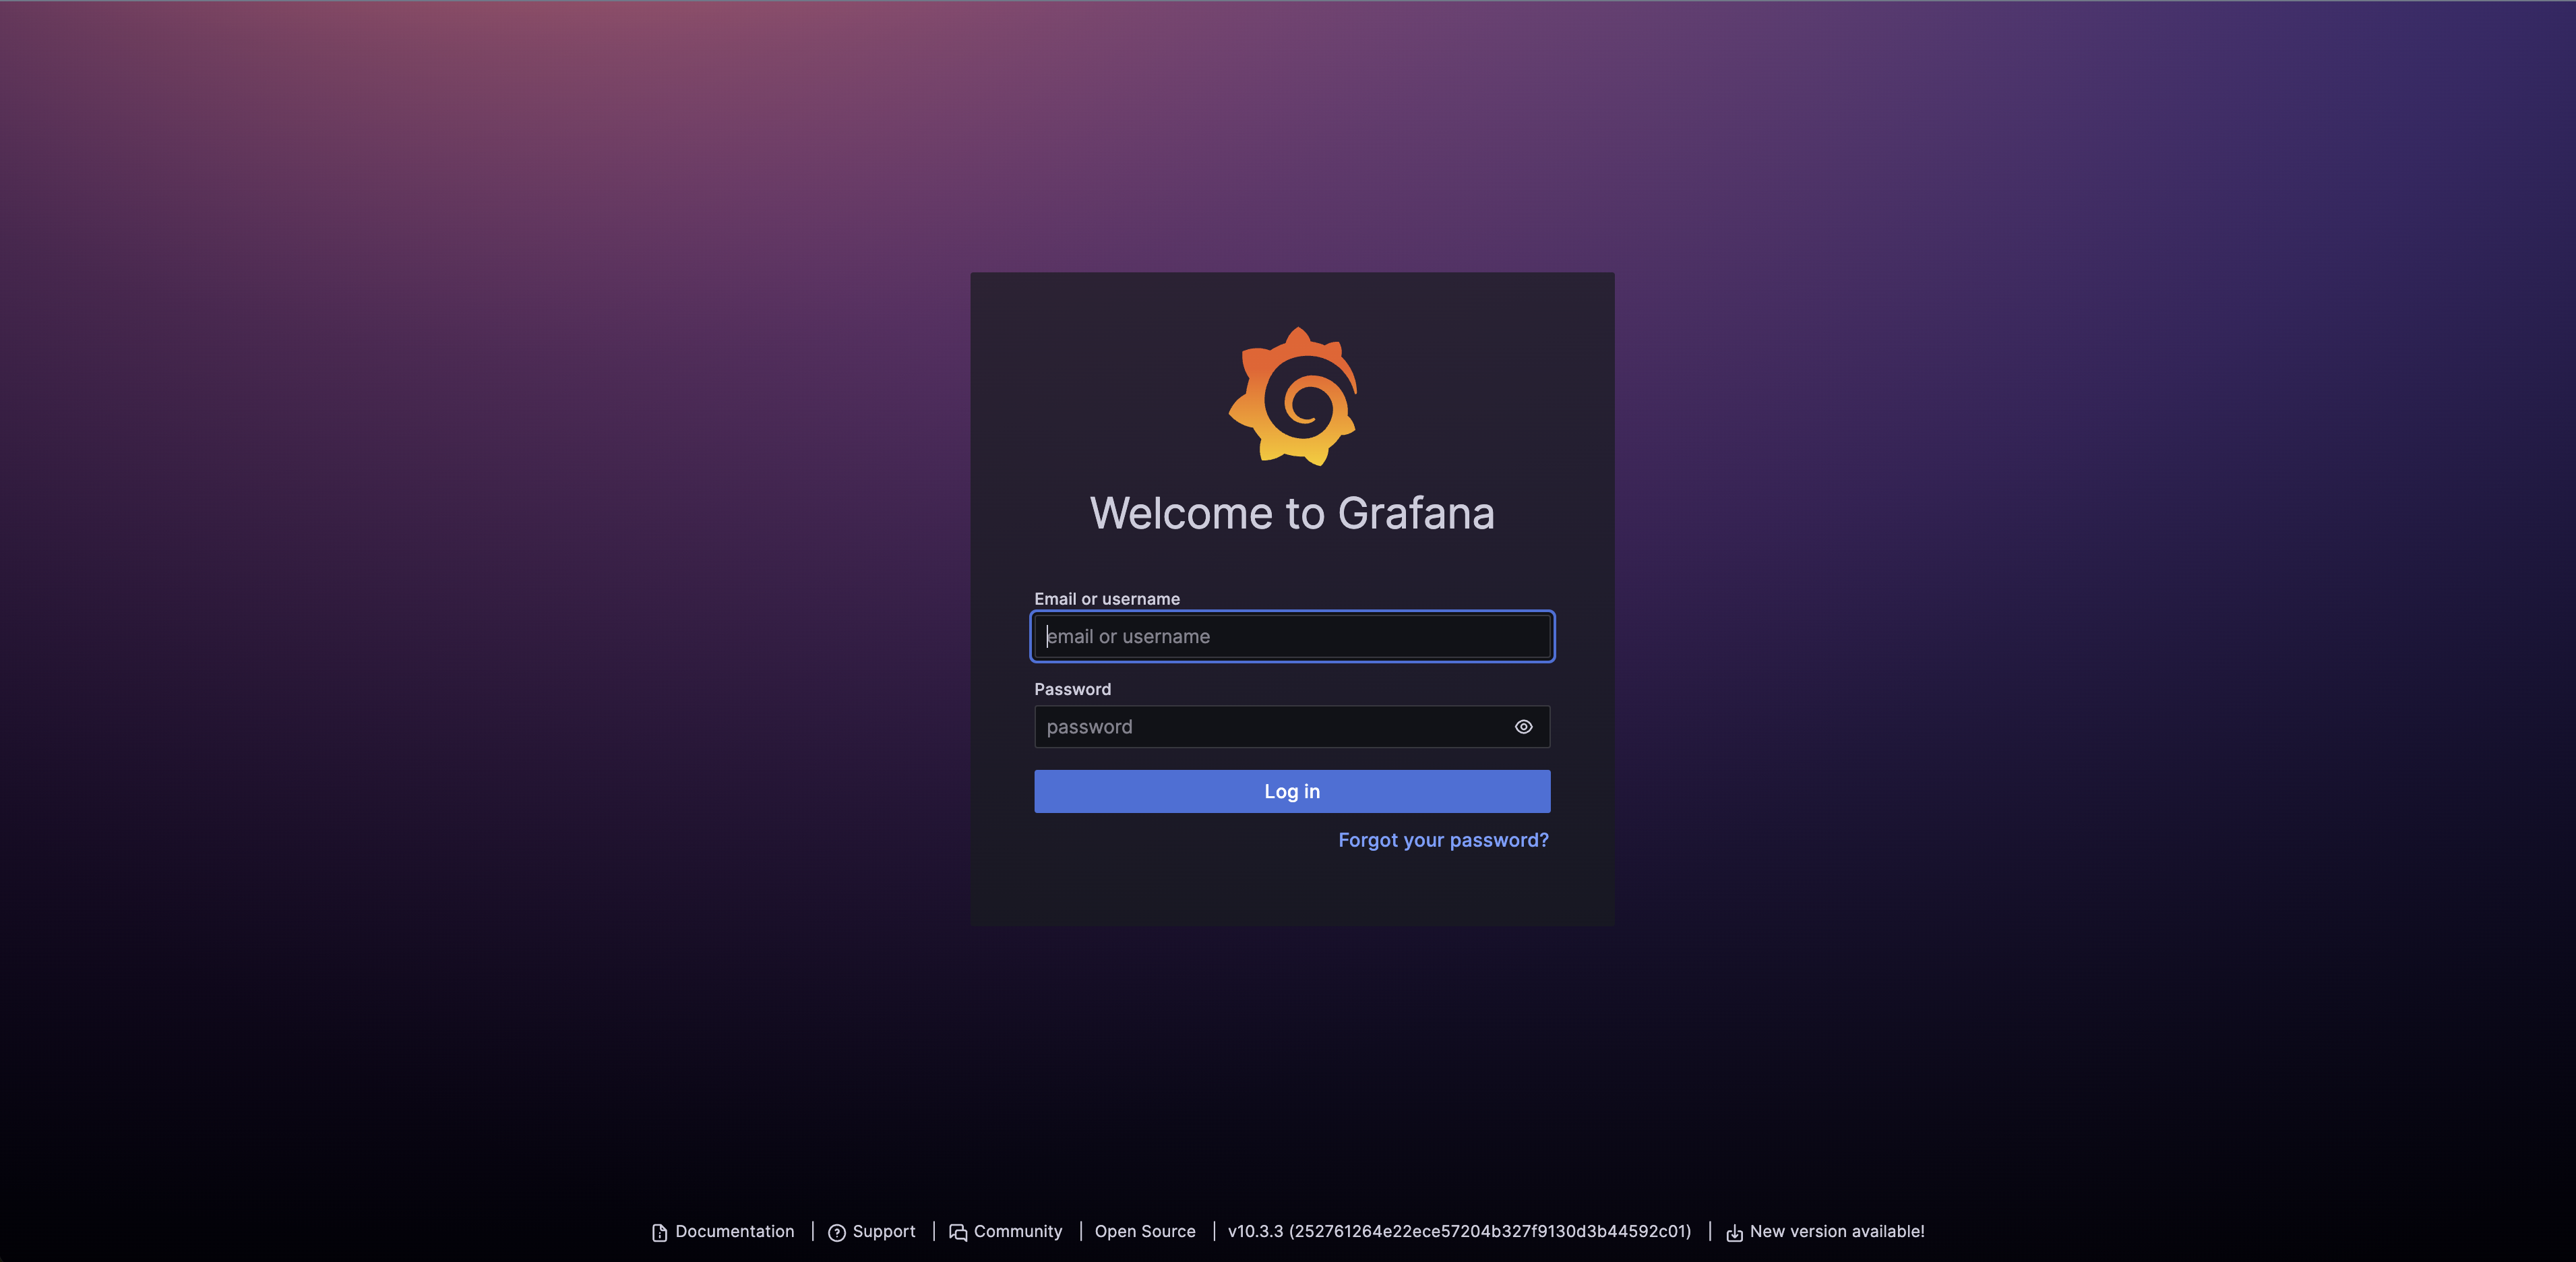 Grafana login page
 -
At the initial login, click the profile button and change the password through
Change password.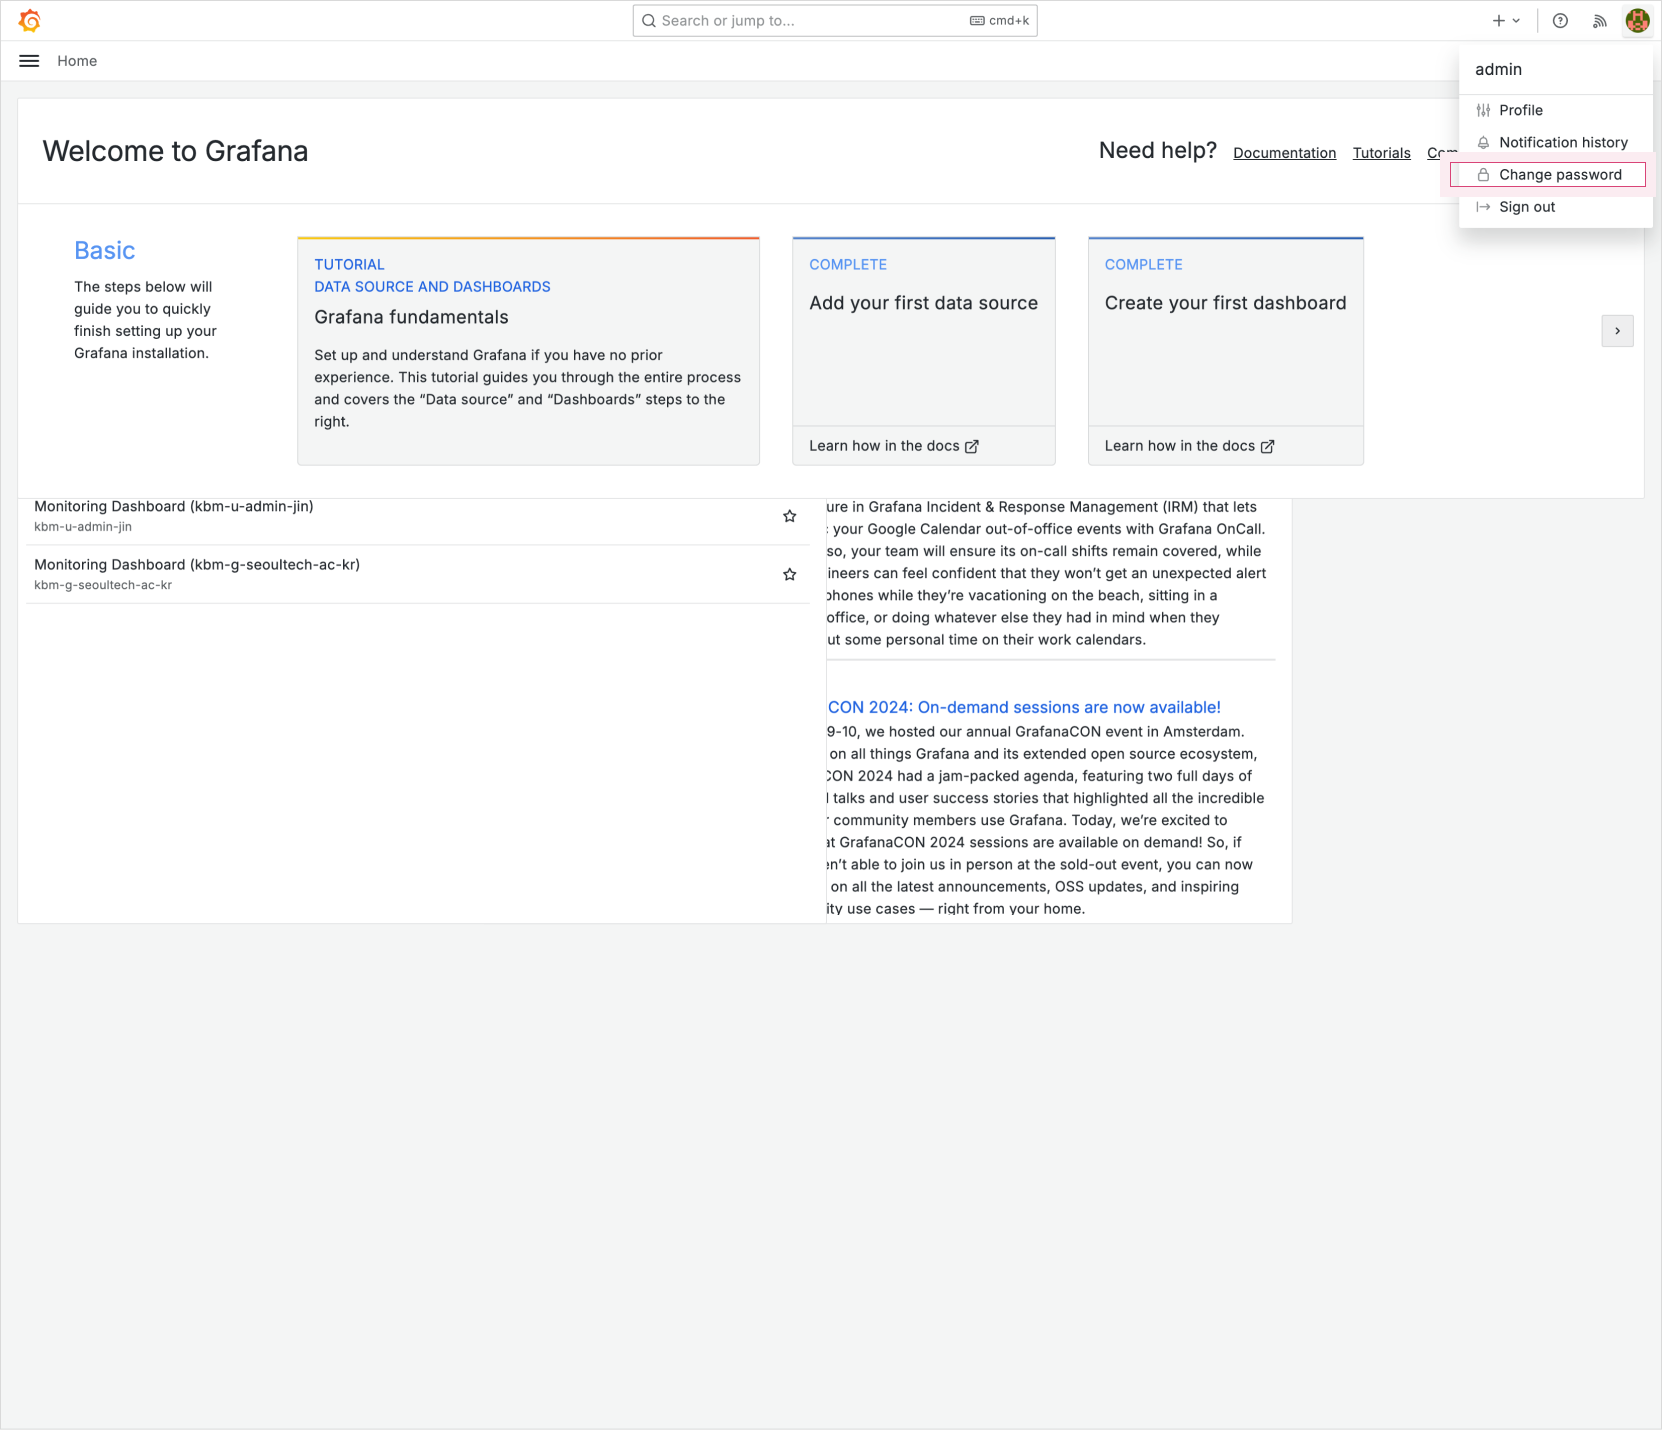 Profile button
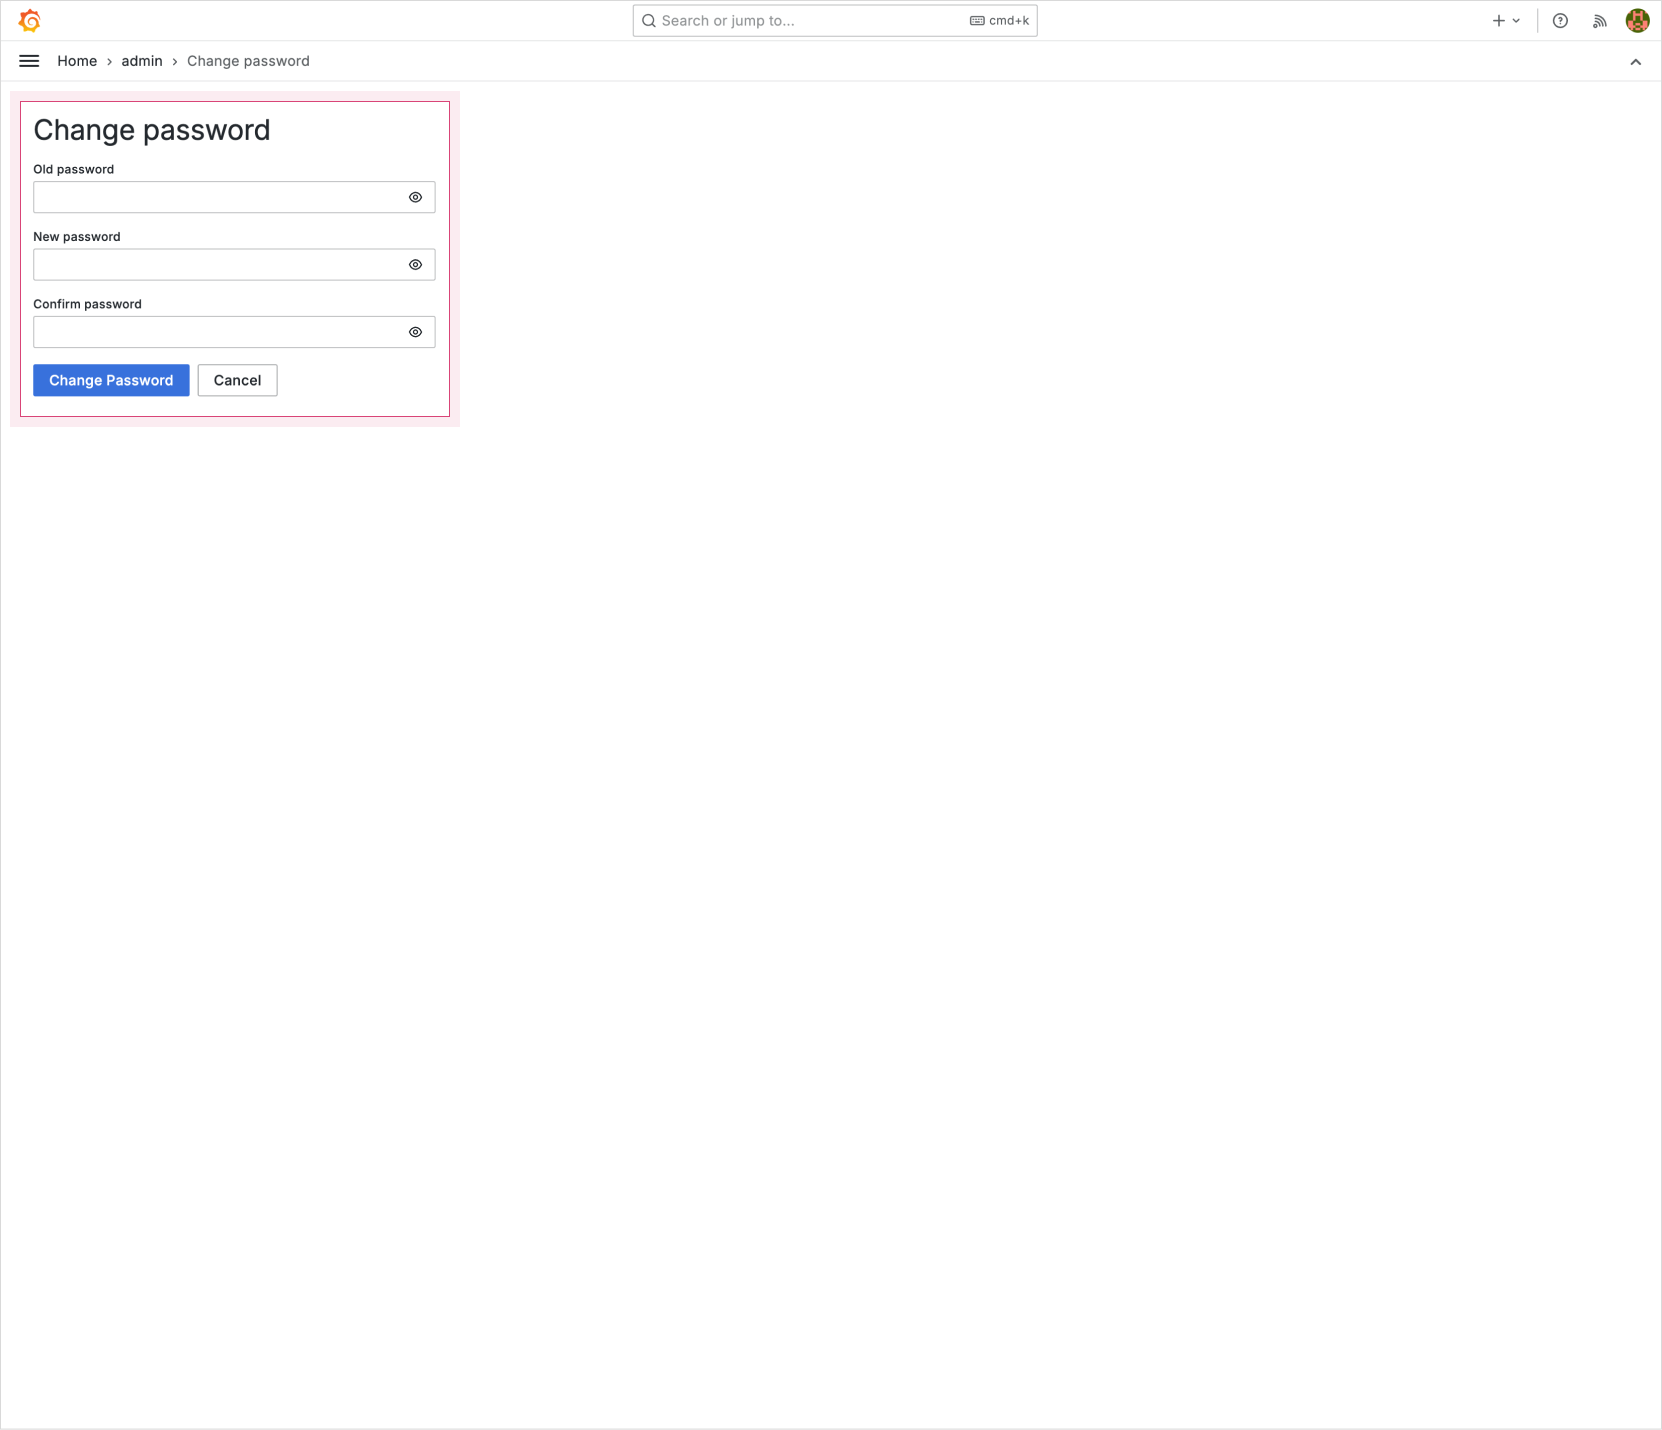 Change password
Grafana dashboard
-
After logging in and entering the dashboard, you can monitor resource usage for
Namespace resources,Disk resources, andPod resources. -
You can use additional features through the menu bar at the top right.
- You can monitor resource usage by specifying a time range.
- You can use the Auto Refresh feature to refresh the page at the configured interval.
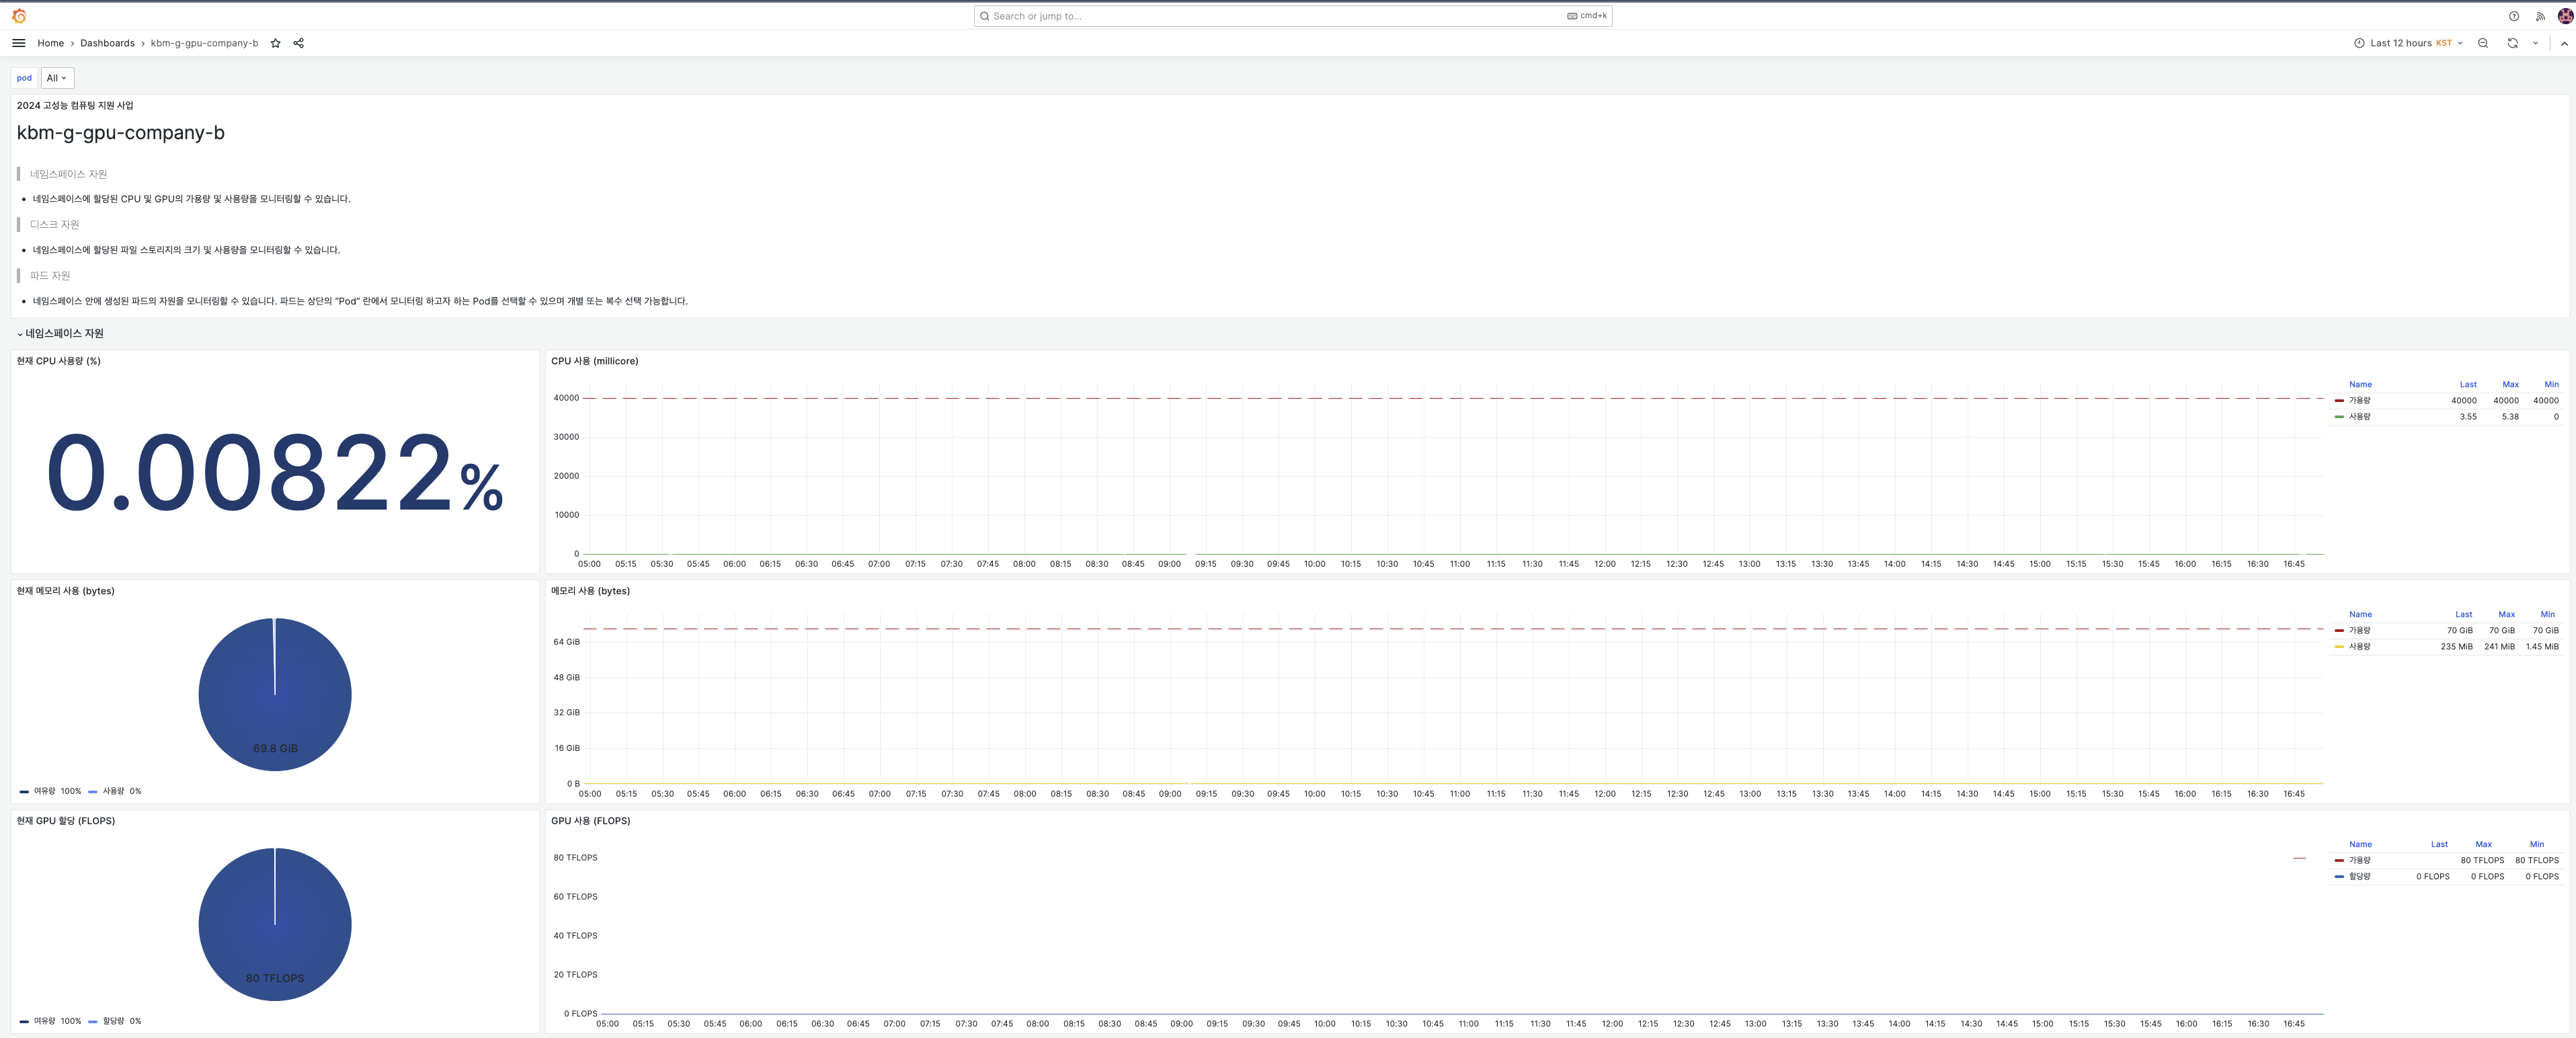
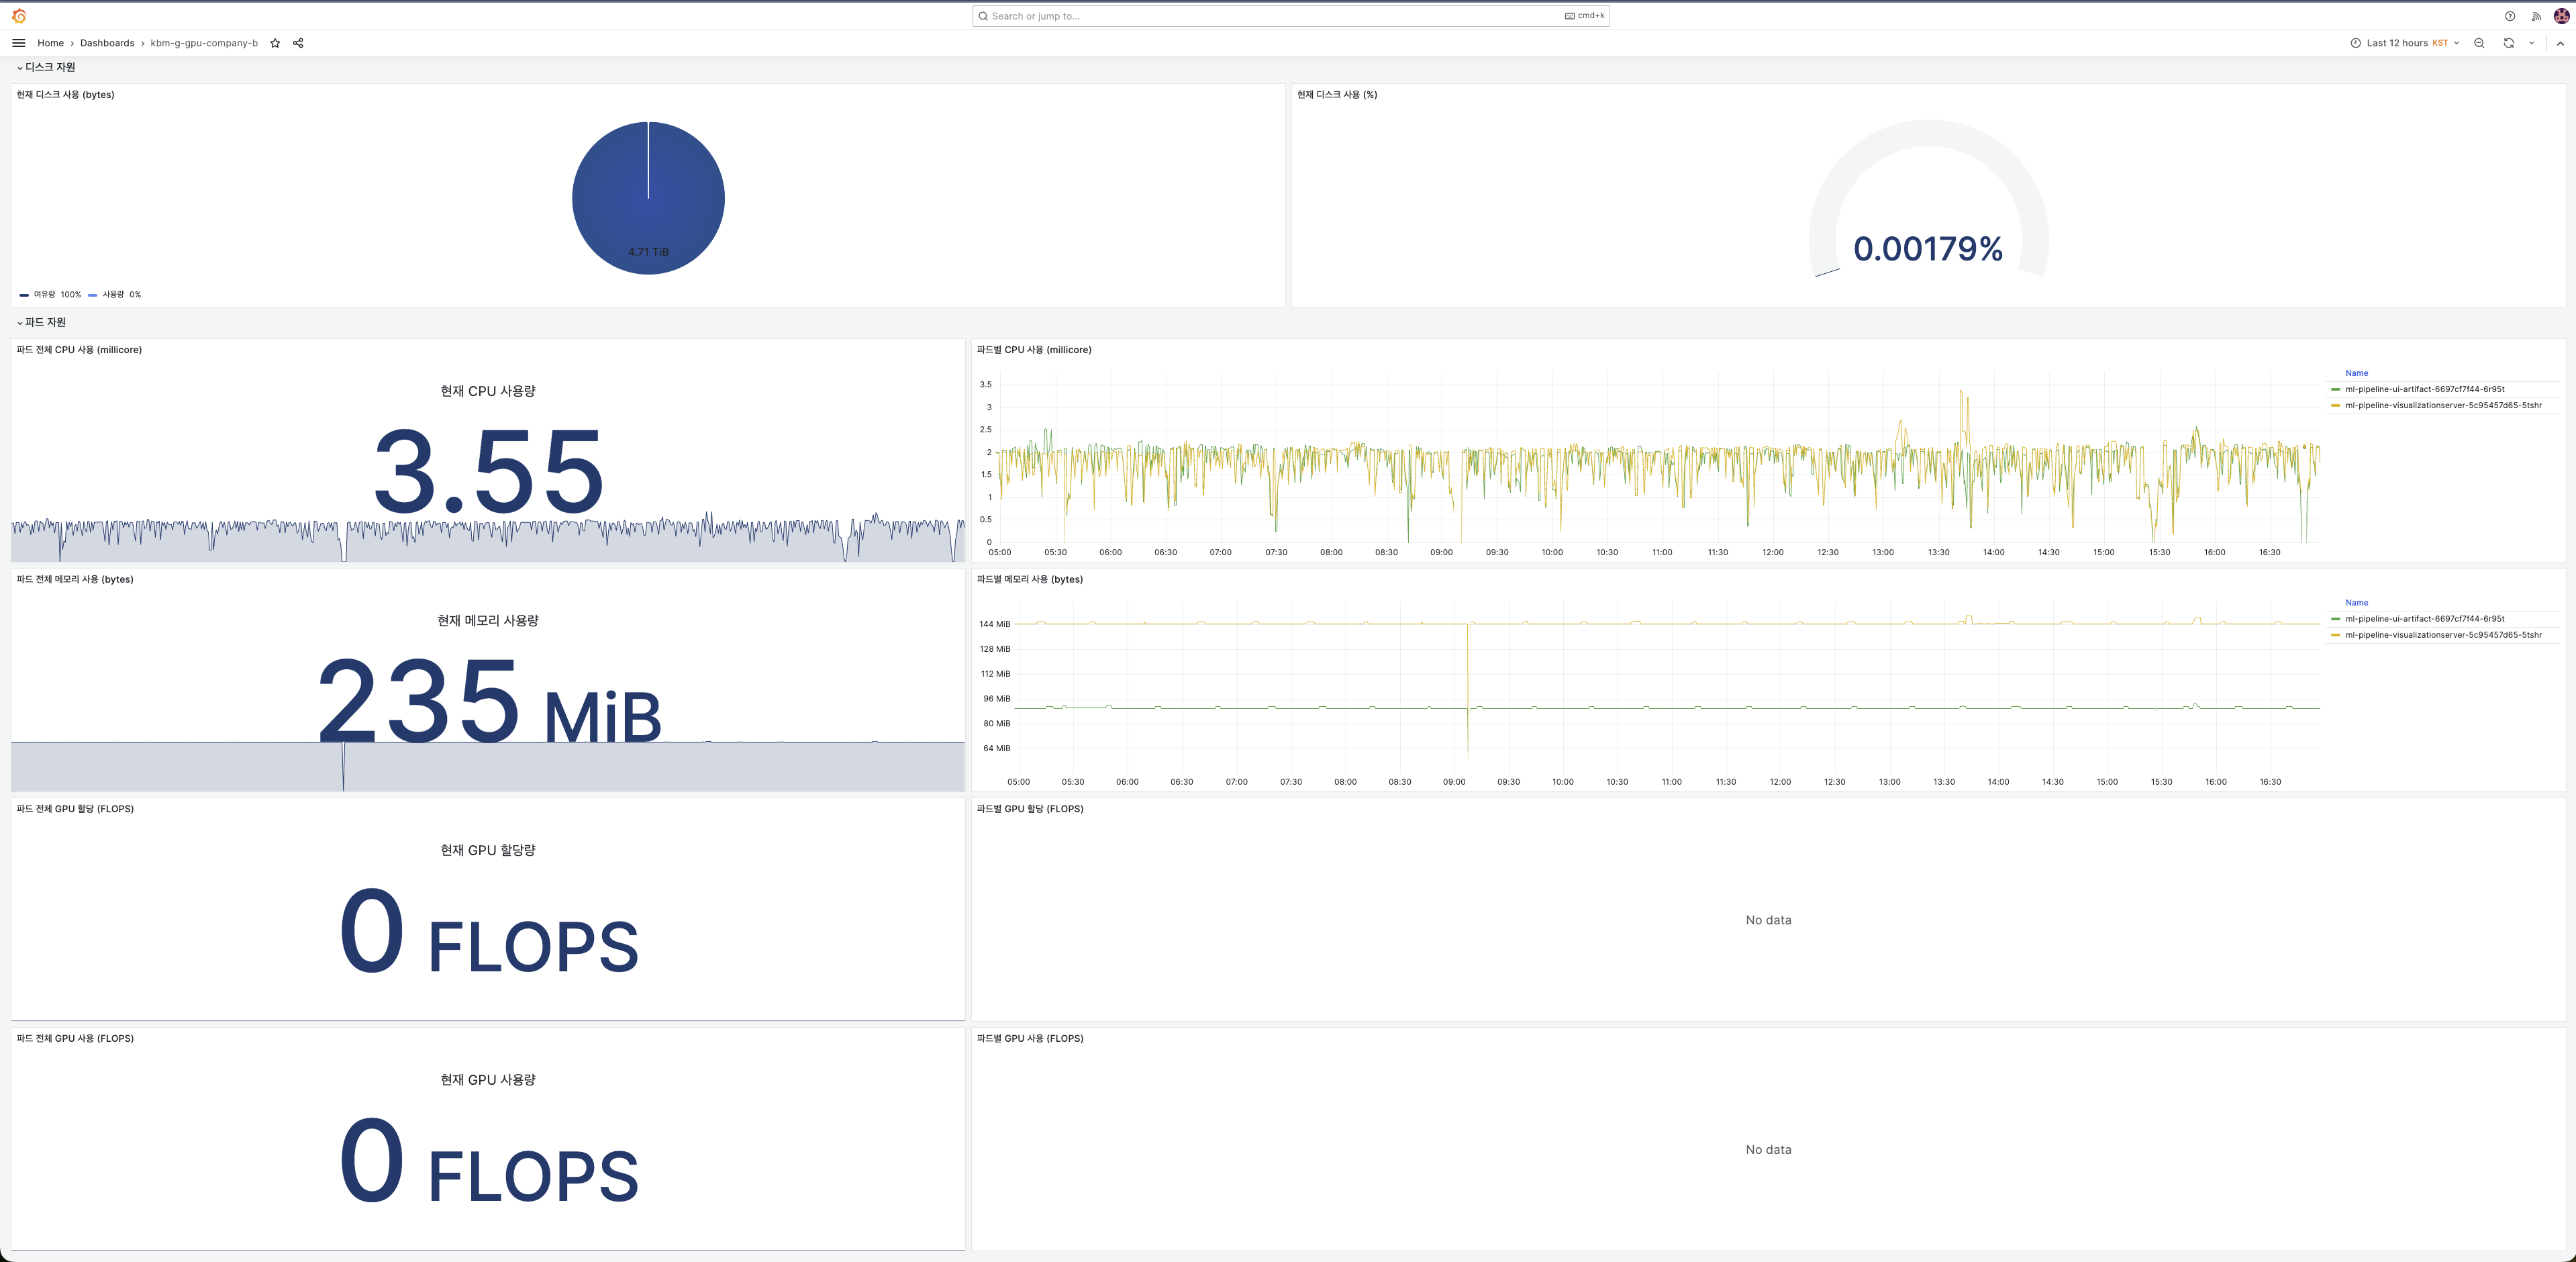 Grafana dashboard