Use monitoring
You can monitor the available and used CPU and GPU capacity assigned to a Namespace and the status of its disk and Pod resources in real time.
The initial ID and password are both set to your assigned Namespace name. After you log in, change the password as described below.
Example
If the Namespace name is kbm-g-testnamespace, both the monitoring login ID and password are kbm-g-testnamespace.
Access monitoring
-
From the console dashboard menu, select Monitoring.
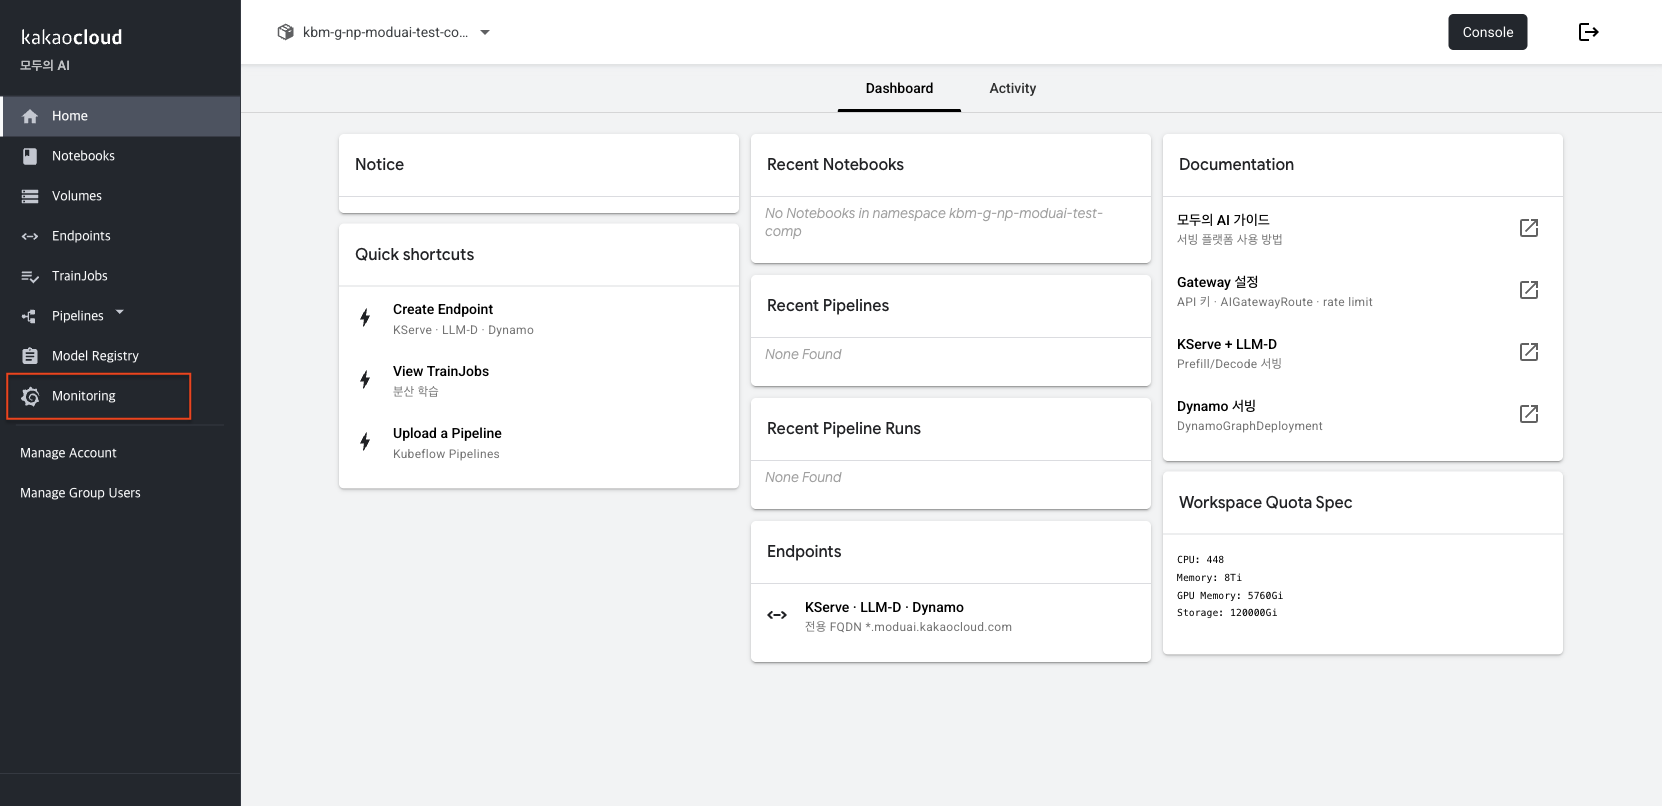 Modu AI dashboard menu layout
 -
Log in to Grafana with your Namespace name and password.
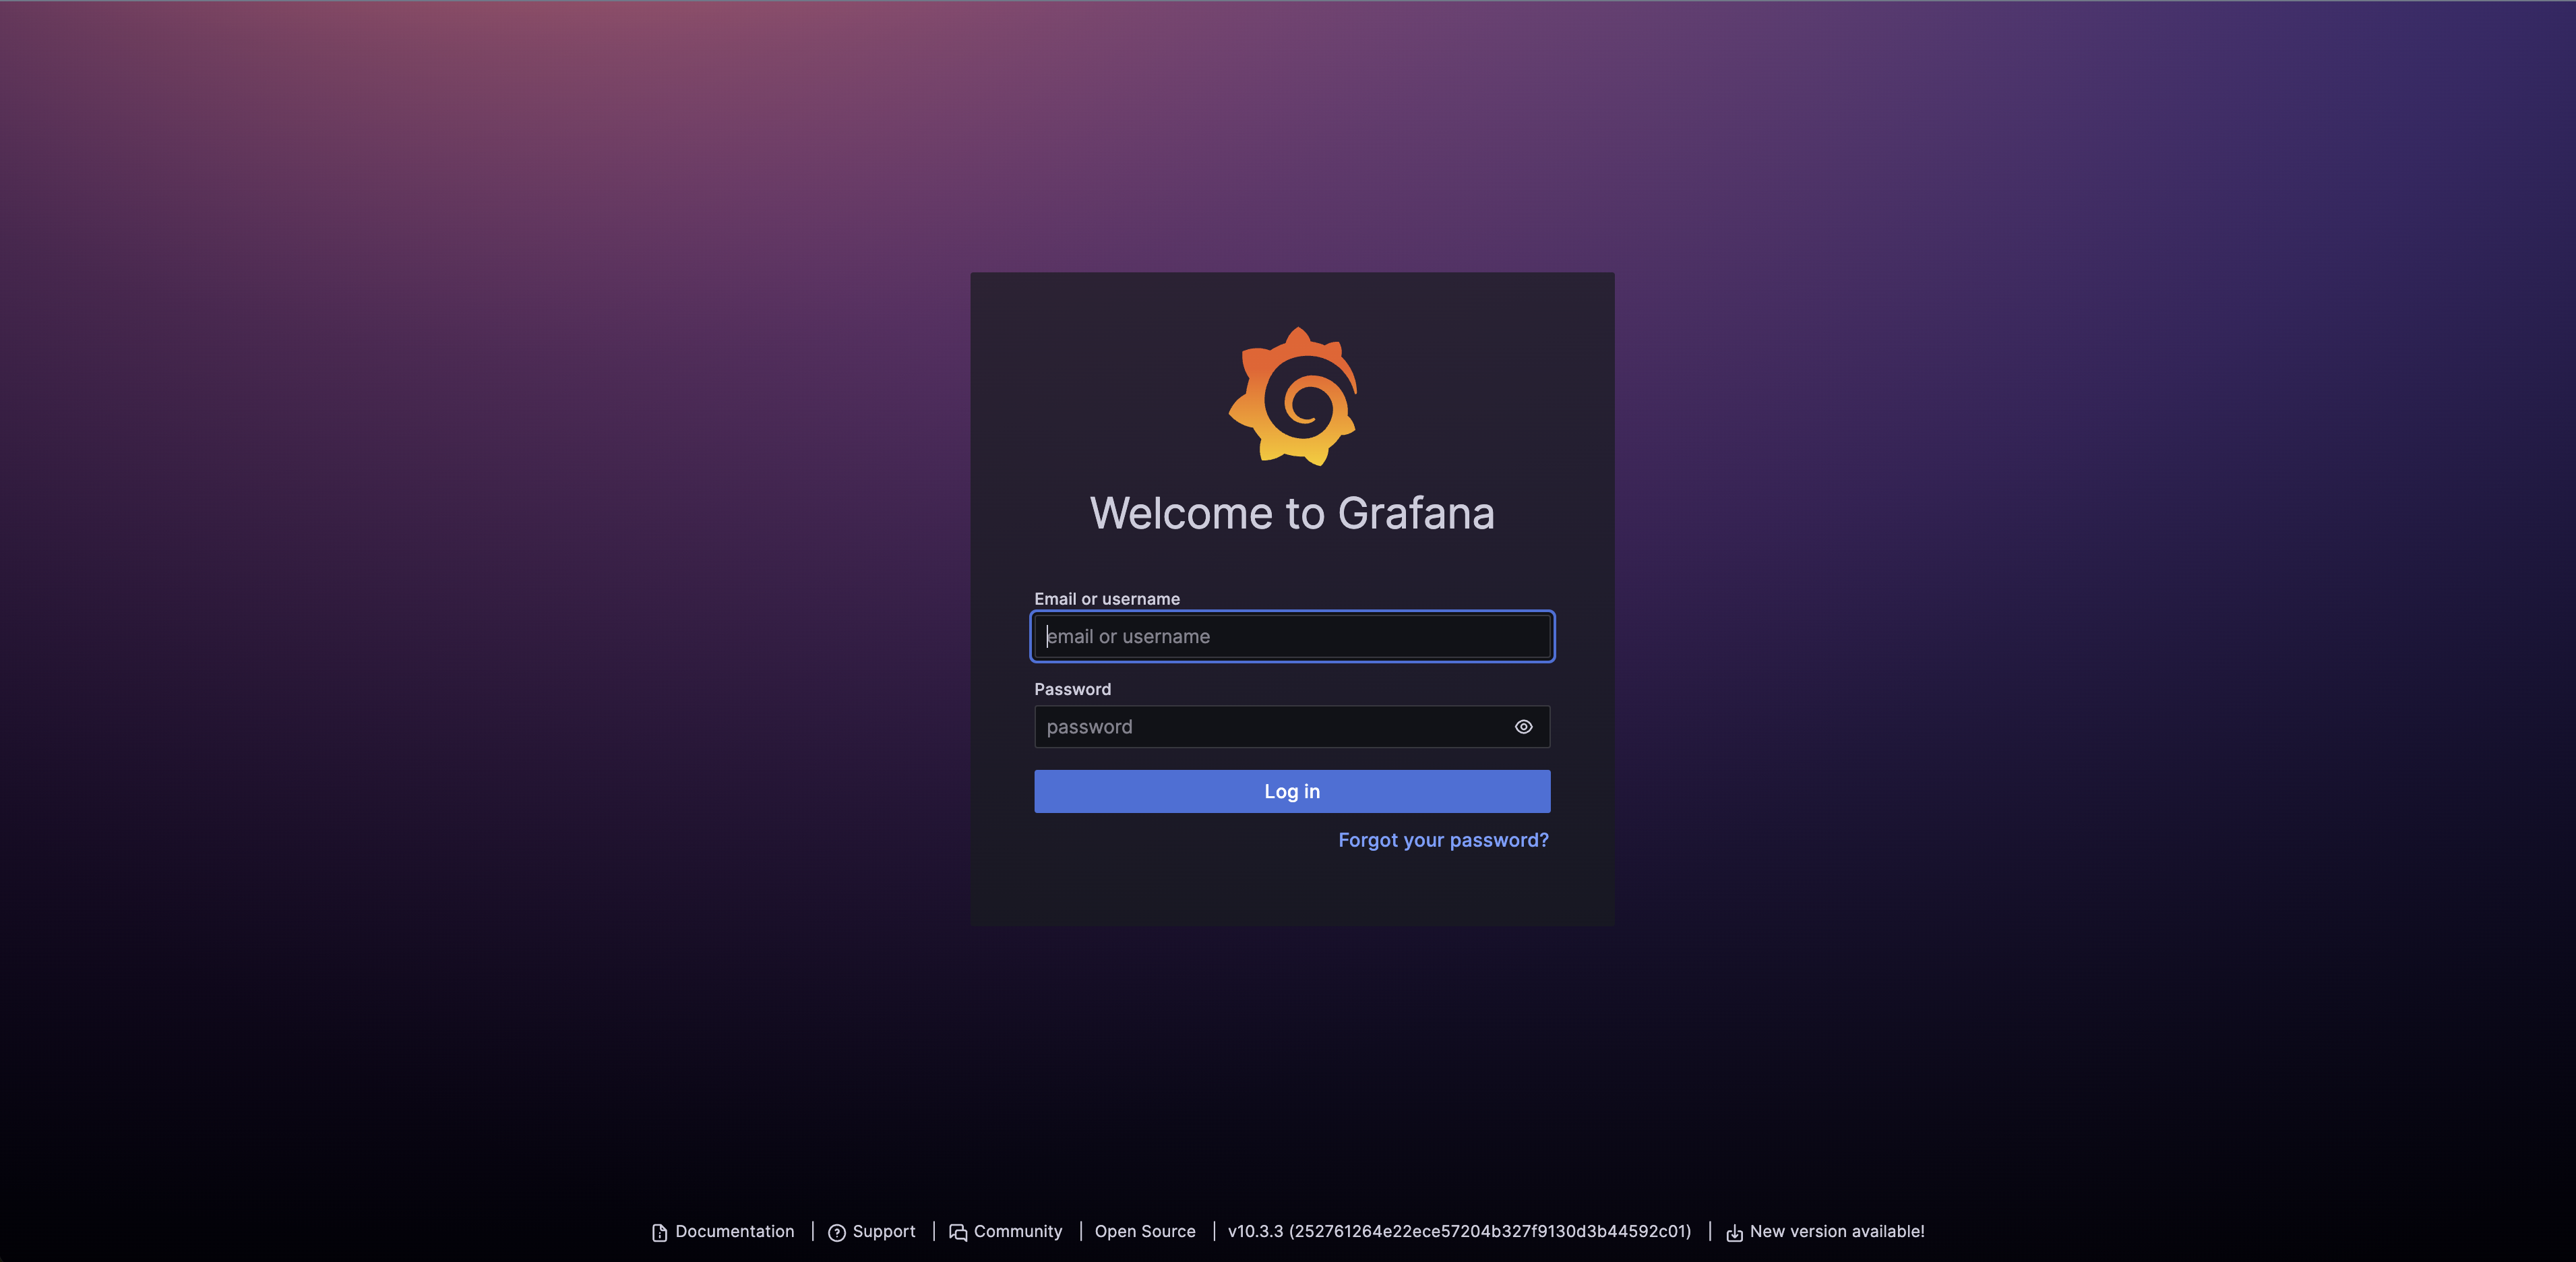 Grafana login page
 -
When you log in for the first time, select the profile button, and then select Change password to change your password.
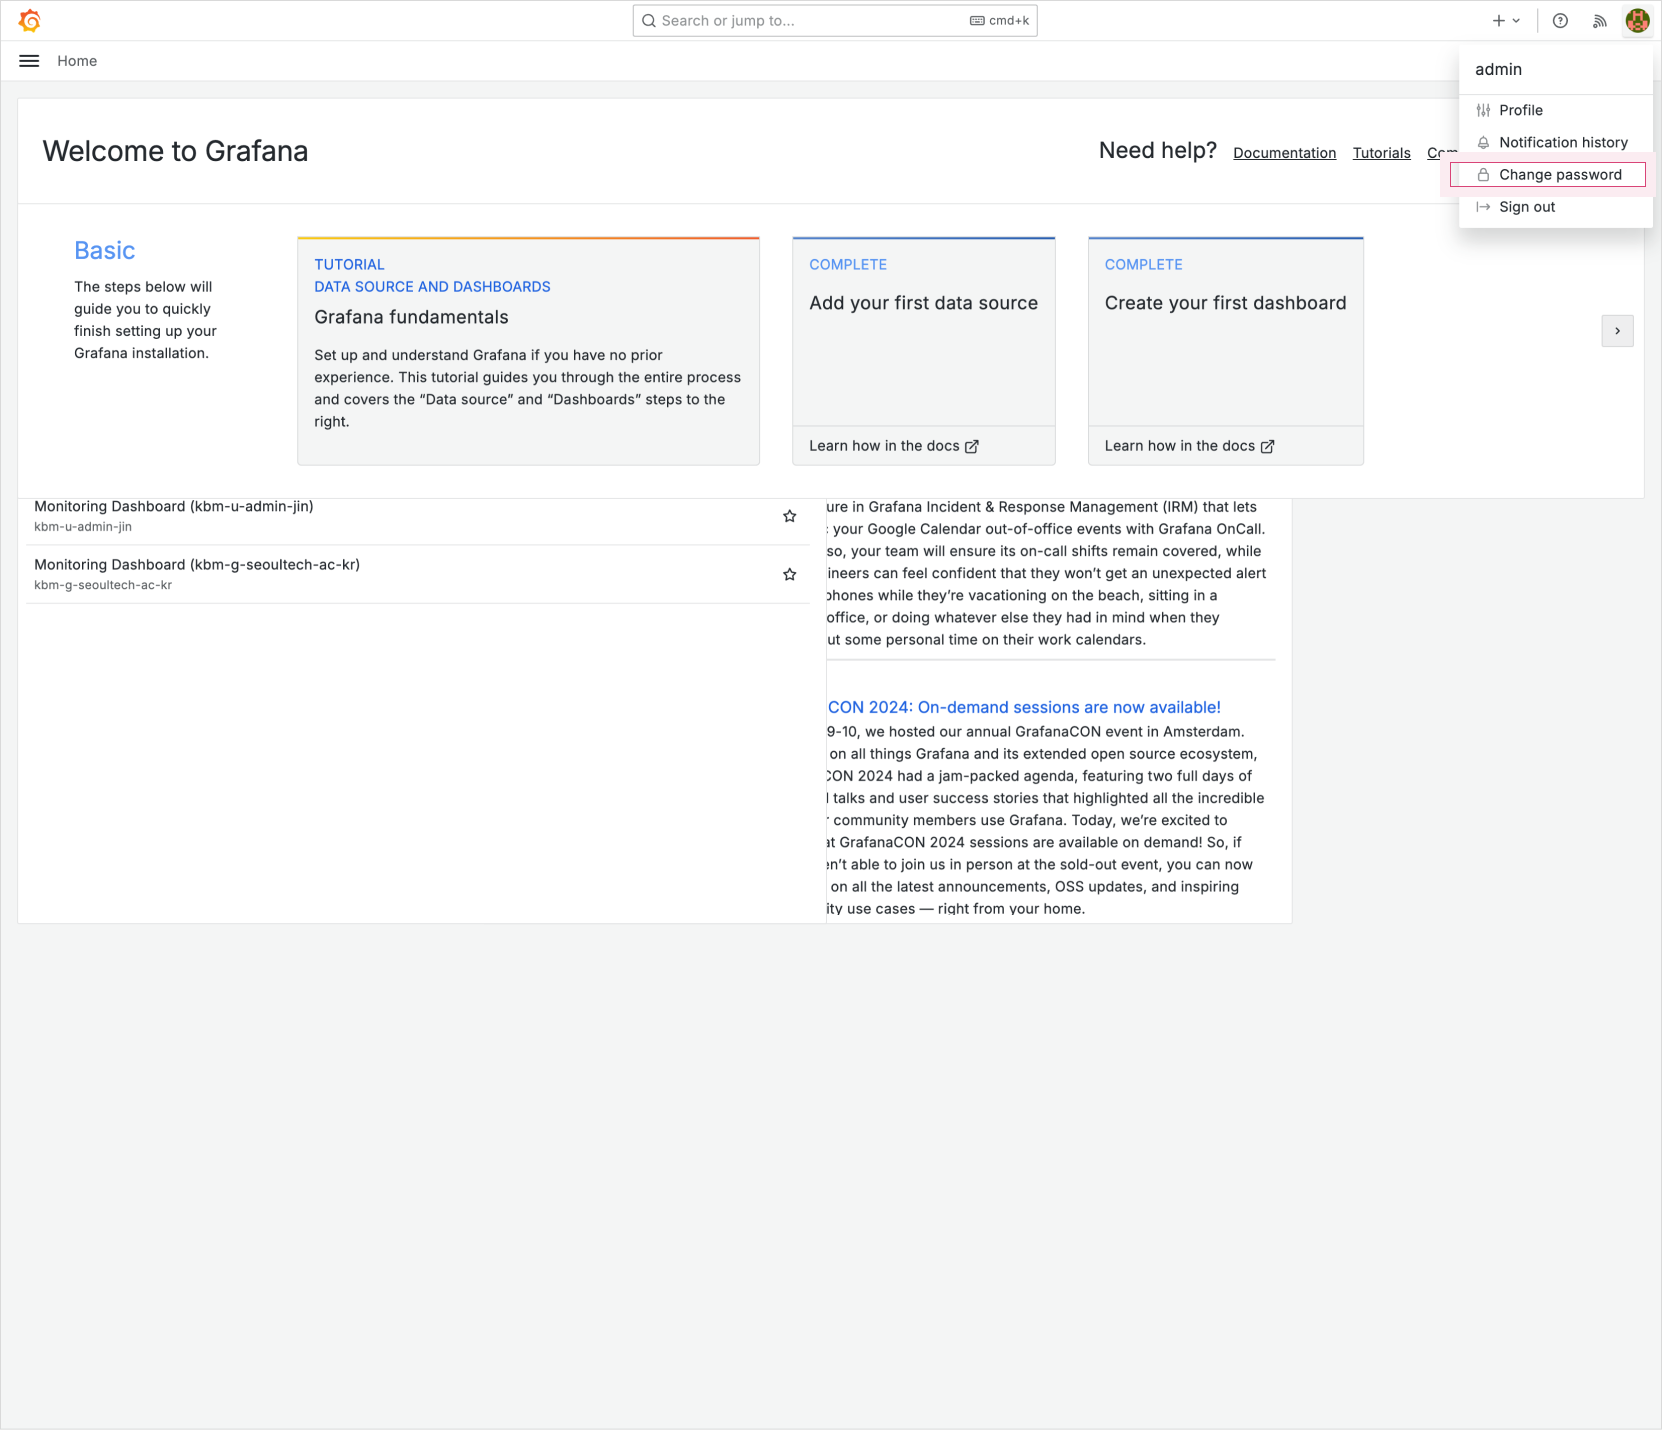 Profile button
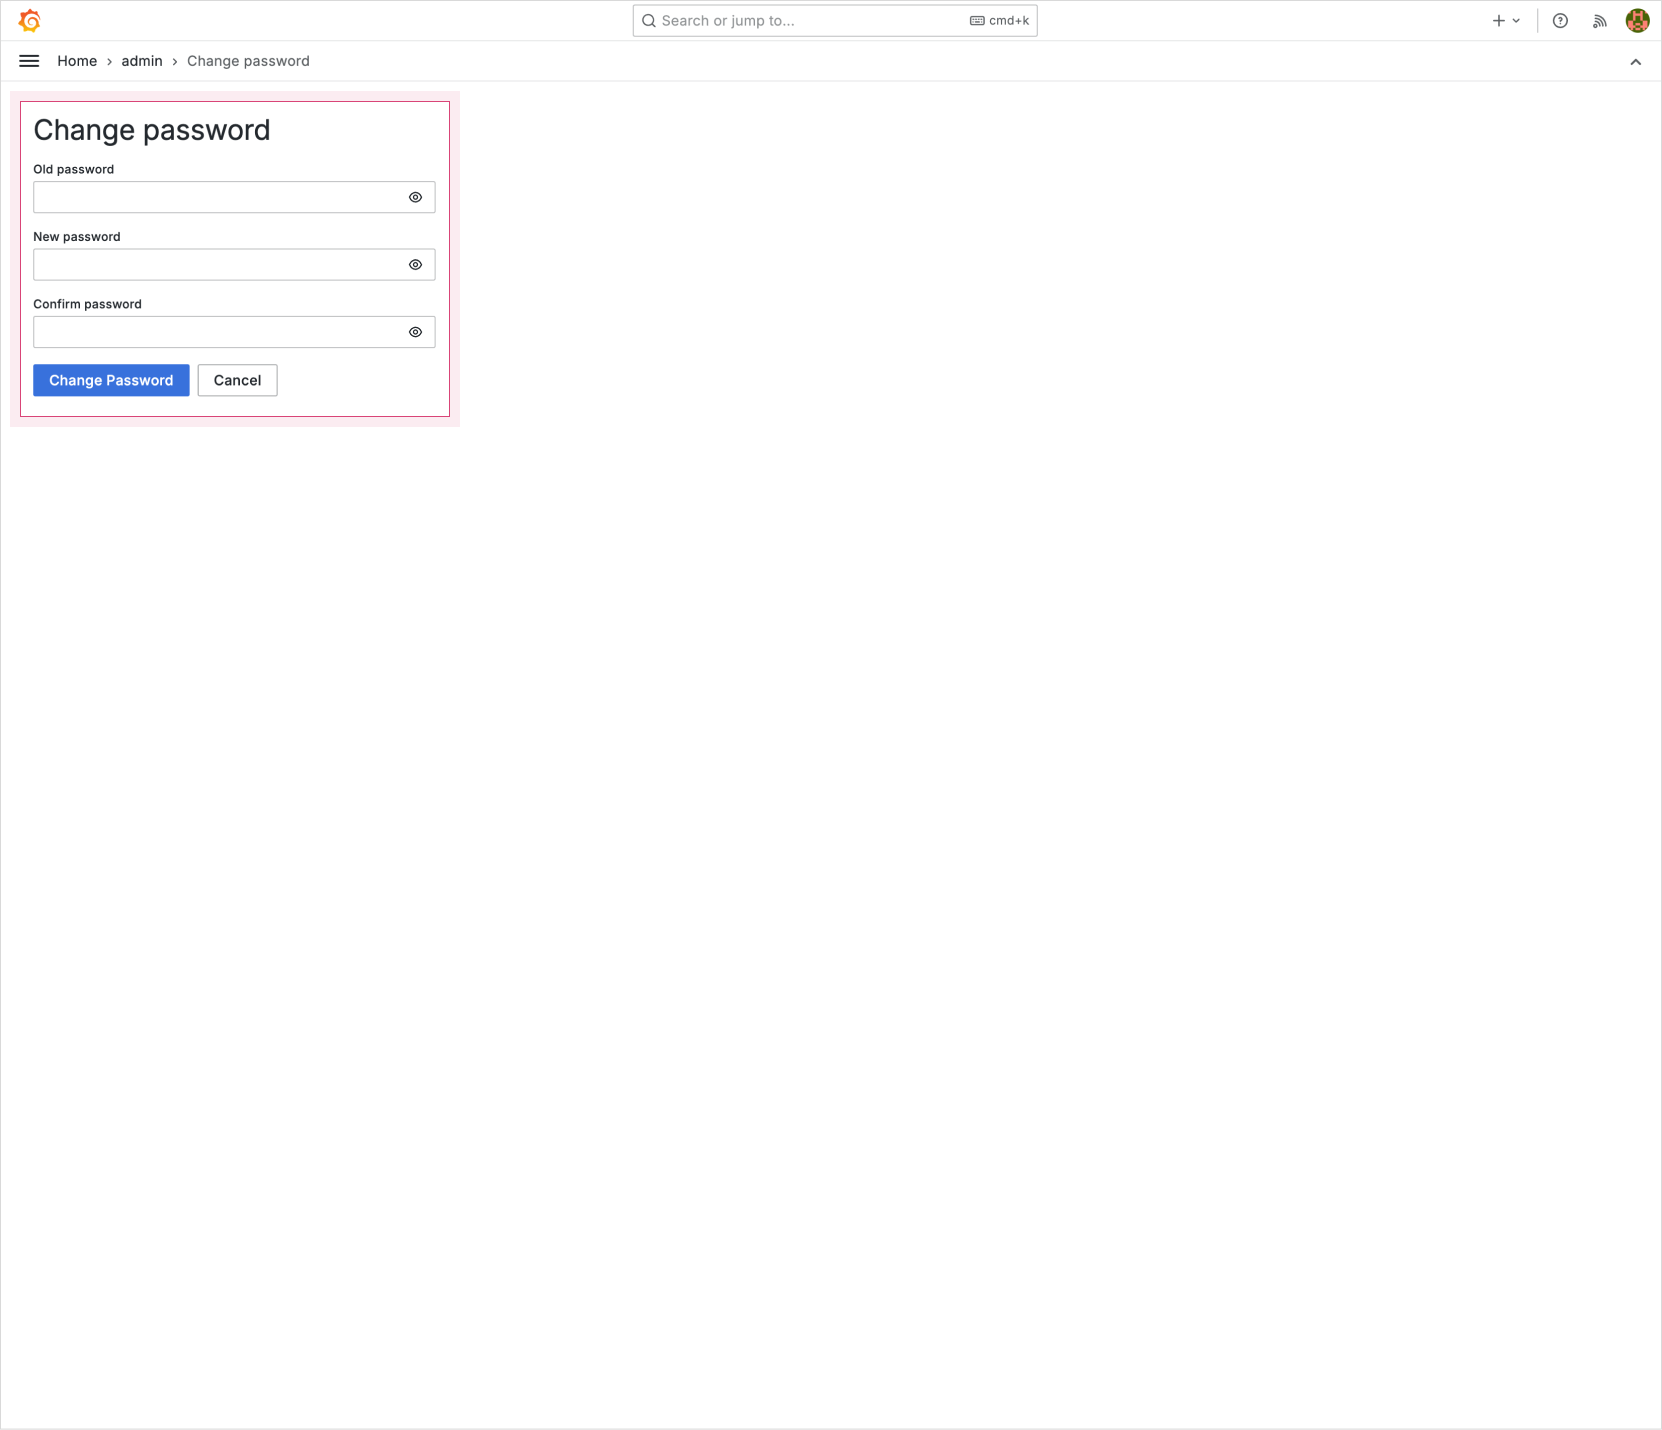 Change password
Grafana dashboard
-
After you log in, you can monitor the usage of Namespace, disk, and Pod resources on the dashboard.
-
Use the menu in the upper-right corner for the following additional features.
- Specify a time range for monitoring resource usage.
- Use Auto Refresh to refresh the page at the configured interval.
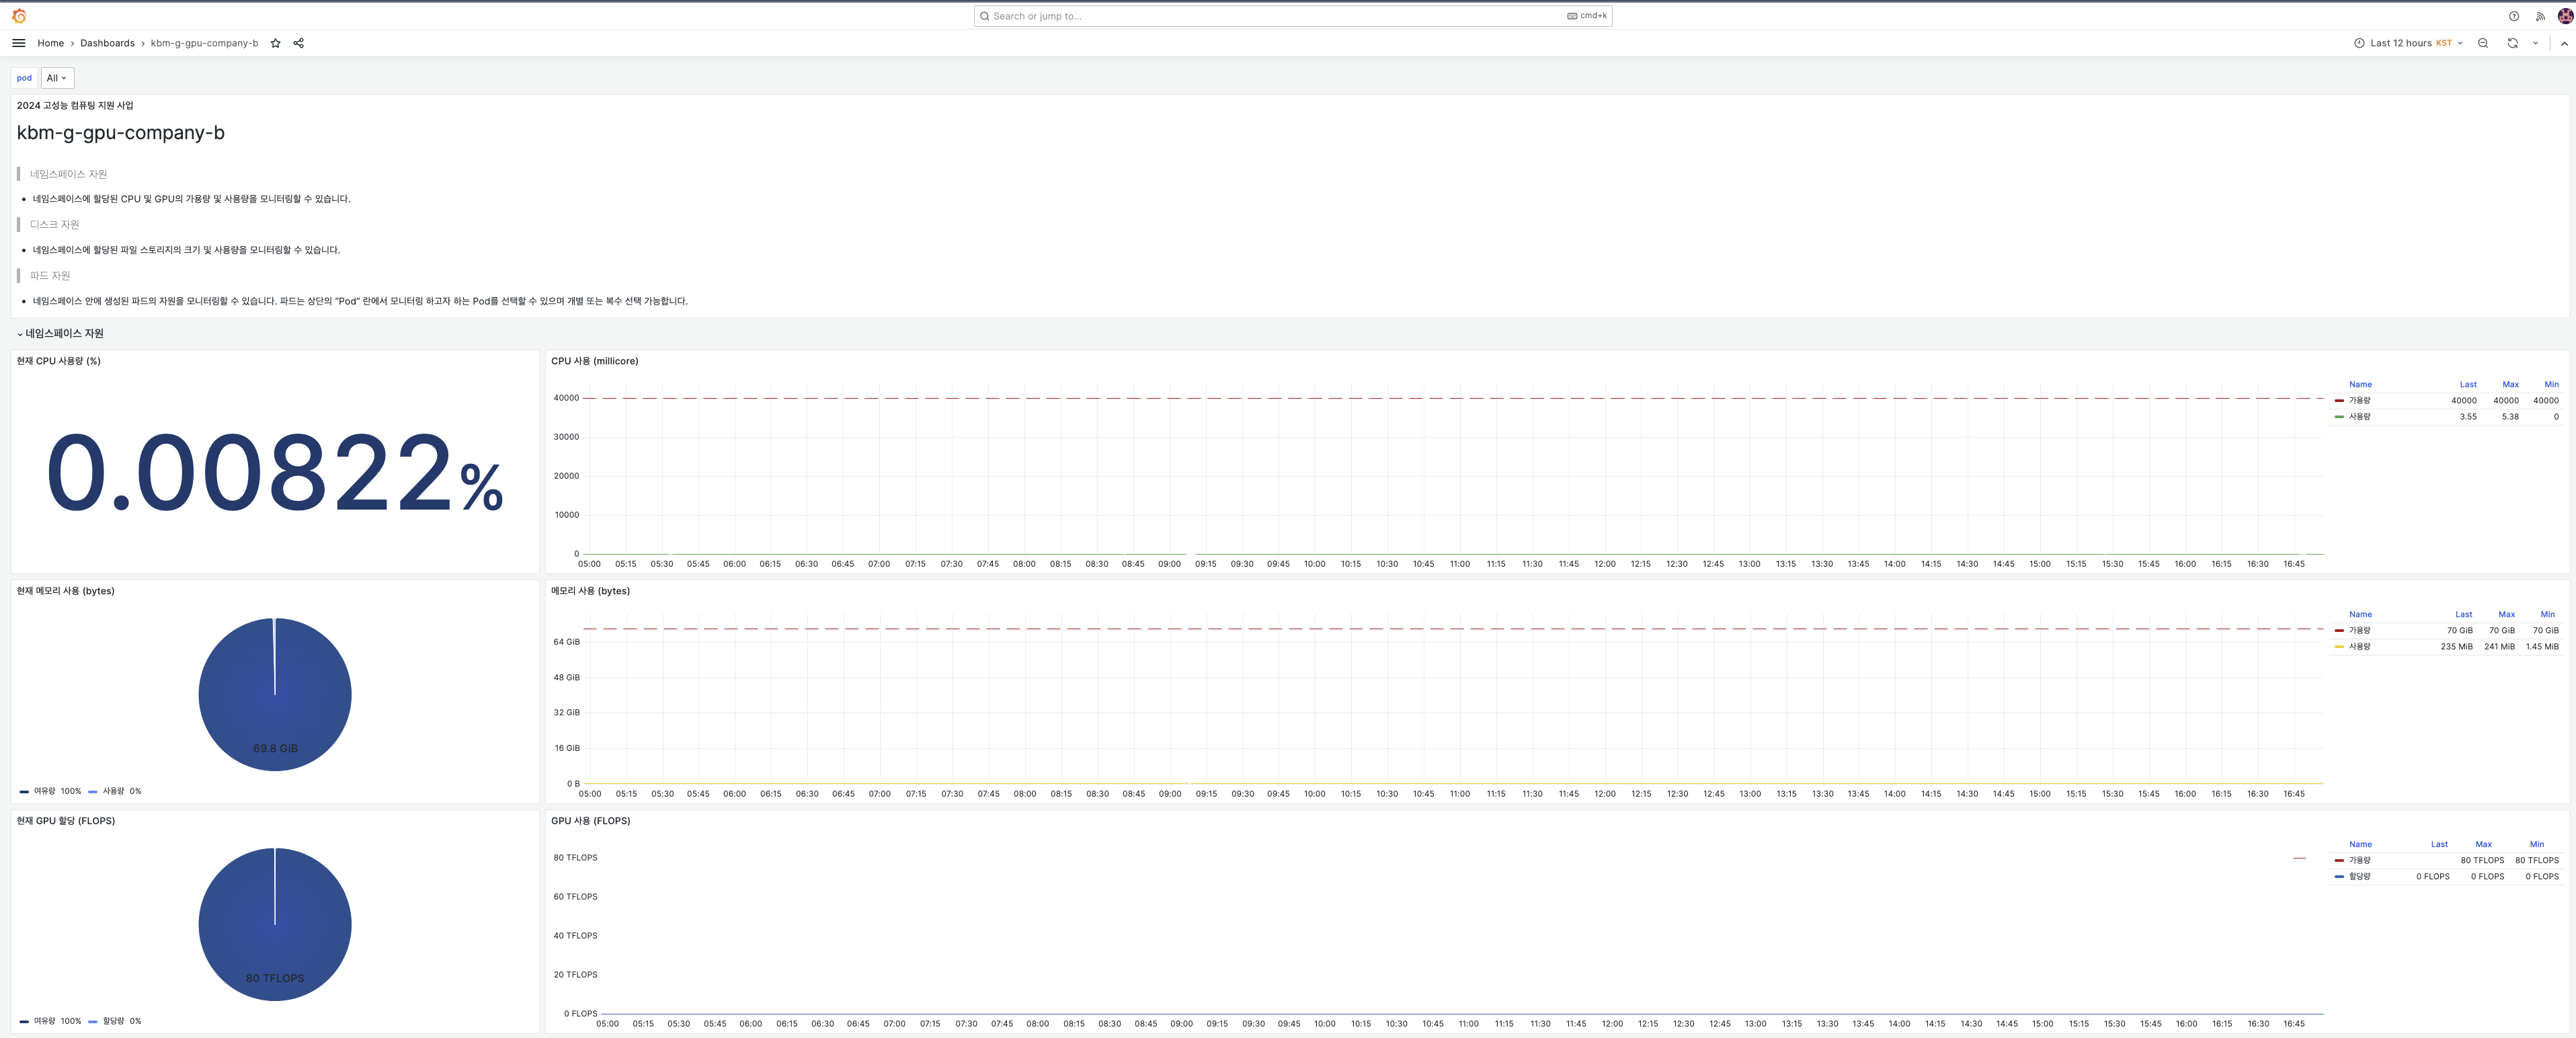
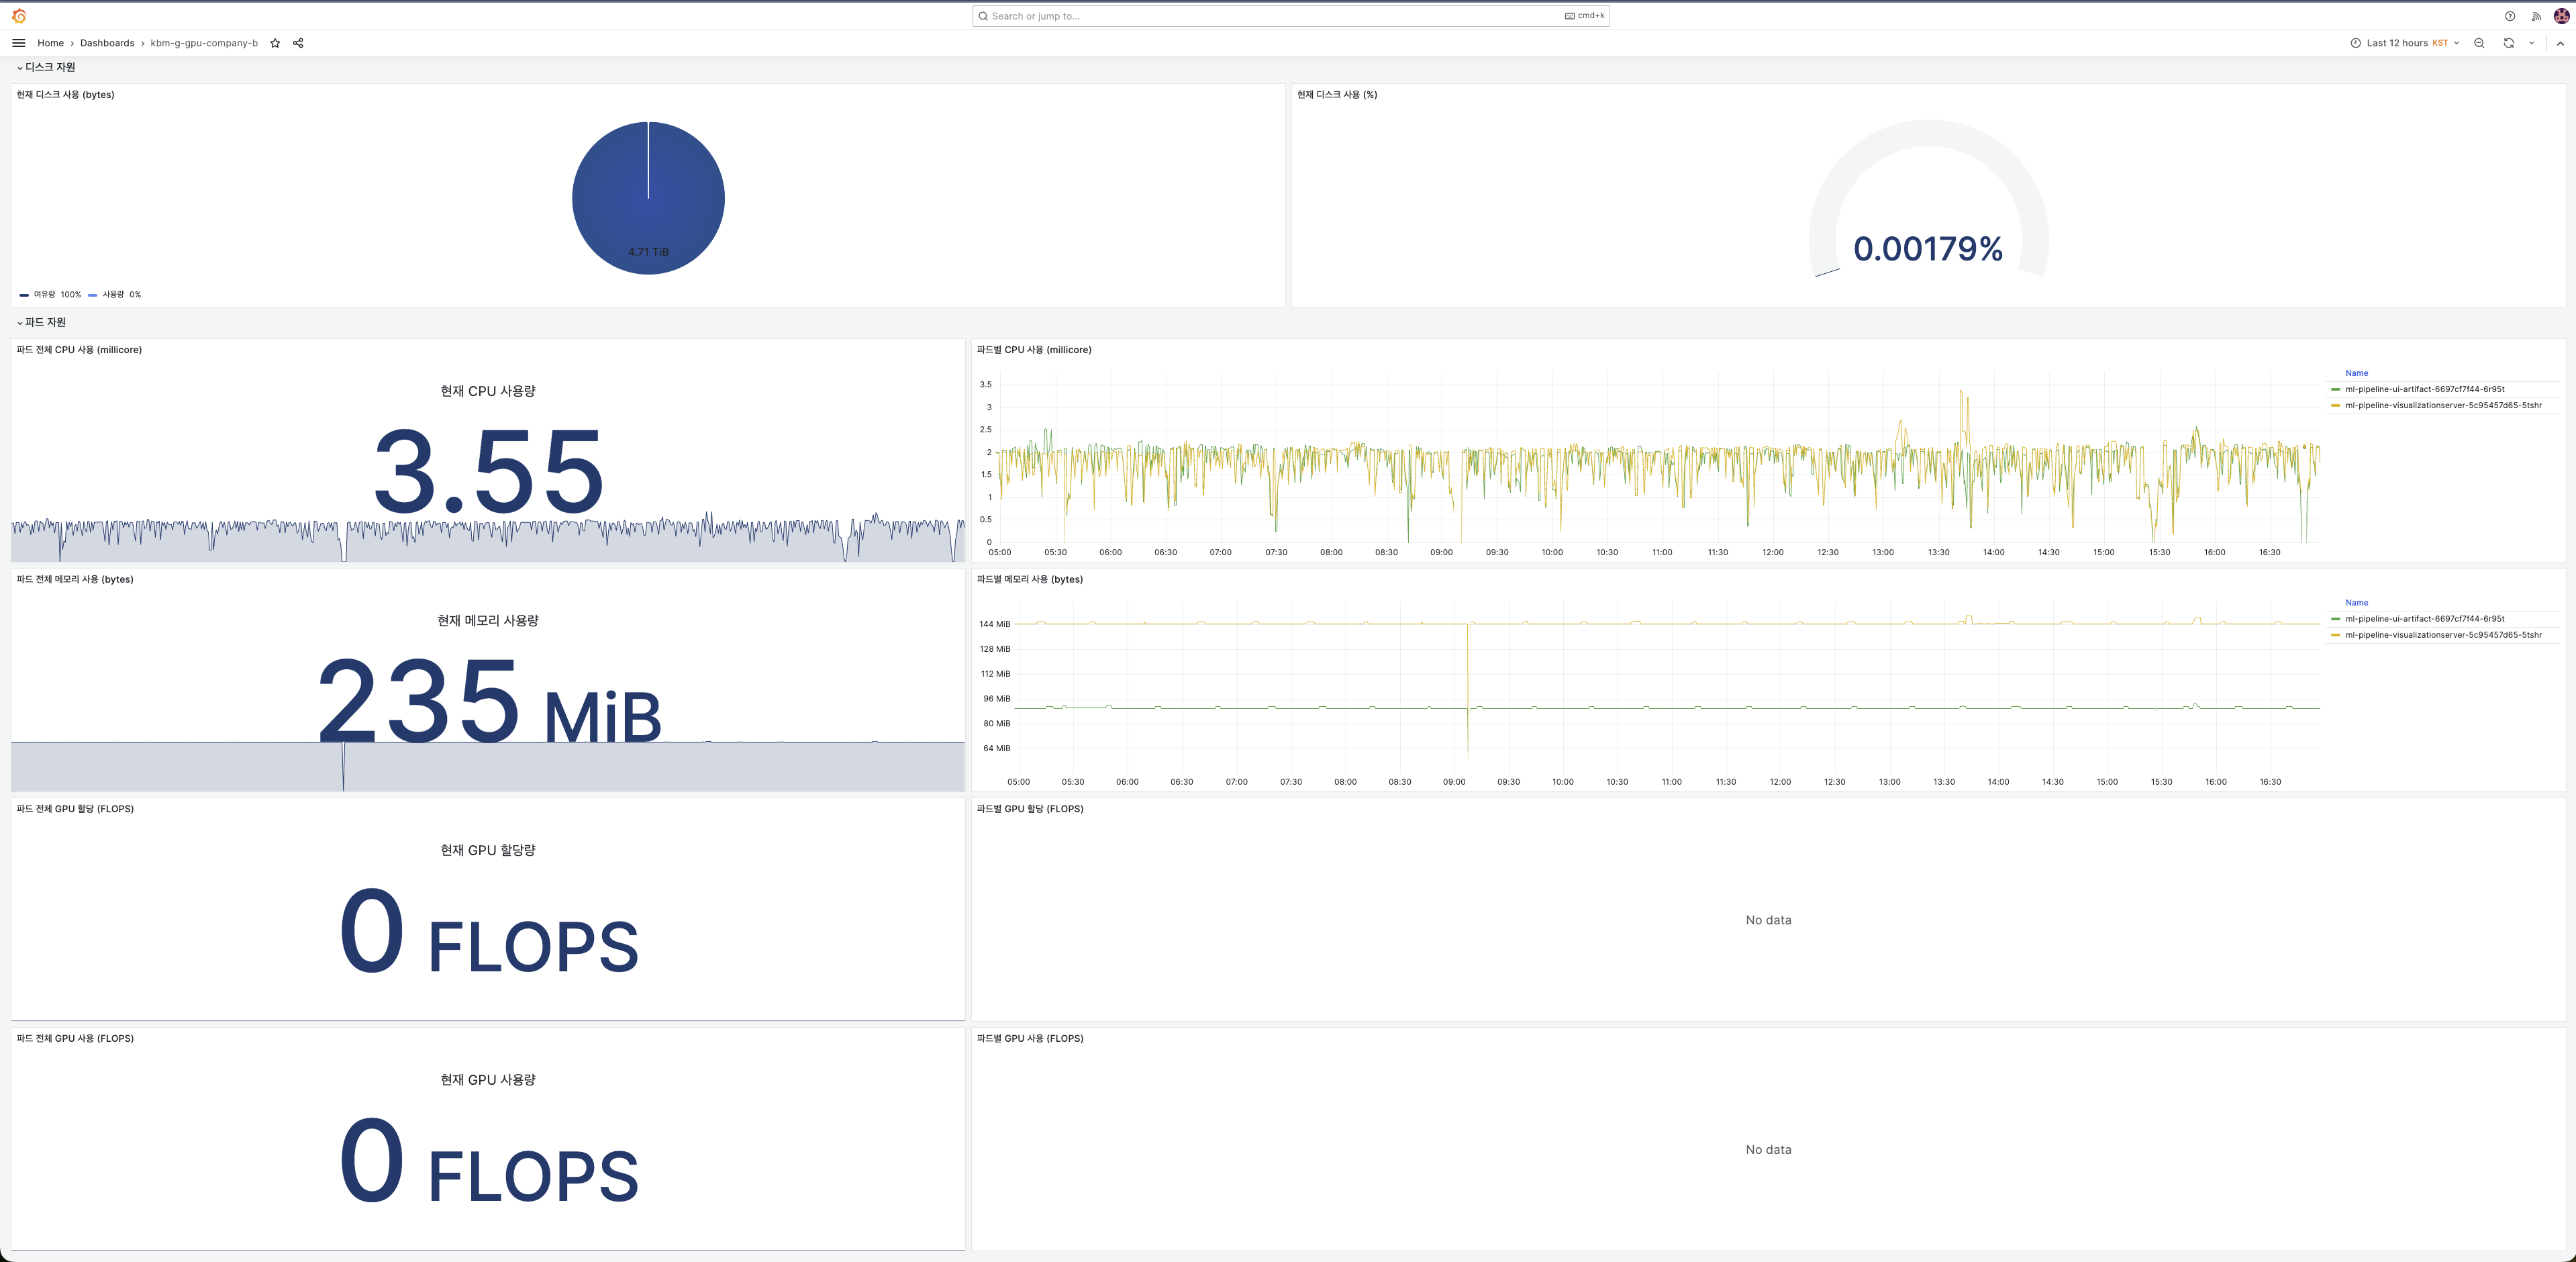 Grafana dashboard