Query history
You can view recent query history and detailed query results.
Query history is retained for 45 days.
After that, queries are no longer accessible. It is recommended to save important queries in advance.
View query history list
-
Go to KakaoCloud console > Analytics > Data Query menu.
-
In the query history menu, check the list of executed queries.
Item Description Query ID ID generated on query execution Query Executed SQL query Start time Time when the query started Result Query execution status Reuse Whether result reuse was applied
- If reused:Reused
- If not:-Execution time Time taken to execute query Scanned data size Amount of data scanned User User who executed the query [Open query] button View full query and open in a new tab of the query editor
View query history detail
-
Go to KakaoCloud console > Analytics > Data Query menu.
-
In the query history menu, select a query ID to view its details.
-
Check the information on the query history detail page.
Category Item Description Summary Result status Query execution status Reuse Whether result reuse was applied
- If reused:Reused
- If not:-Object Storage path Path where query result is stored User User who executed the query Basic info Query ID ID generated on query execution Query Executed SQL query
- [Open query] button opens full query in a new tab of the editorExecution info Input rows Number of rows scanned Output rows Number of rows returned Input size Size of scanned data Output size Size of query result Execution time Start time Time when query execution began End time Time when query execution ended Total time Execution time + internal processing time Wait time Time spent in queue before execution Plan time Time spent on query planning Execution time Time taken to actually execute and generate result
Execution flow chart
The execution flow chart visually represents how data is processed during query execution.
It helps users easily analyze the execution plan and performance of their queries.
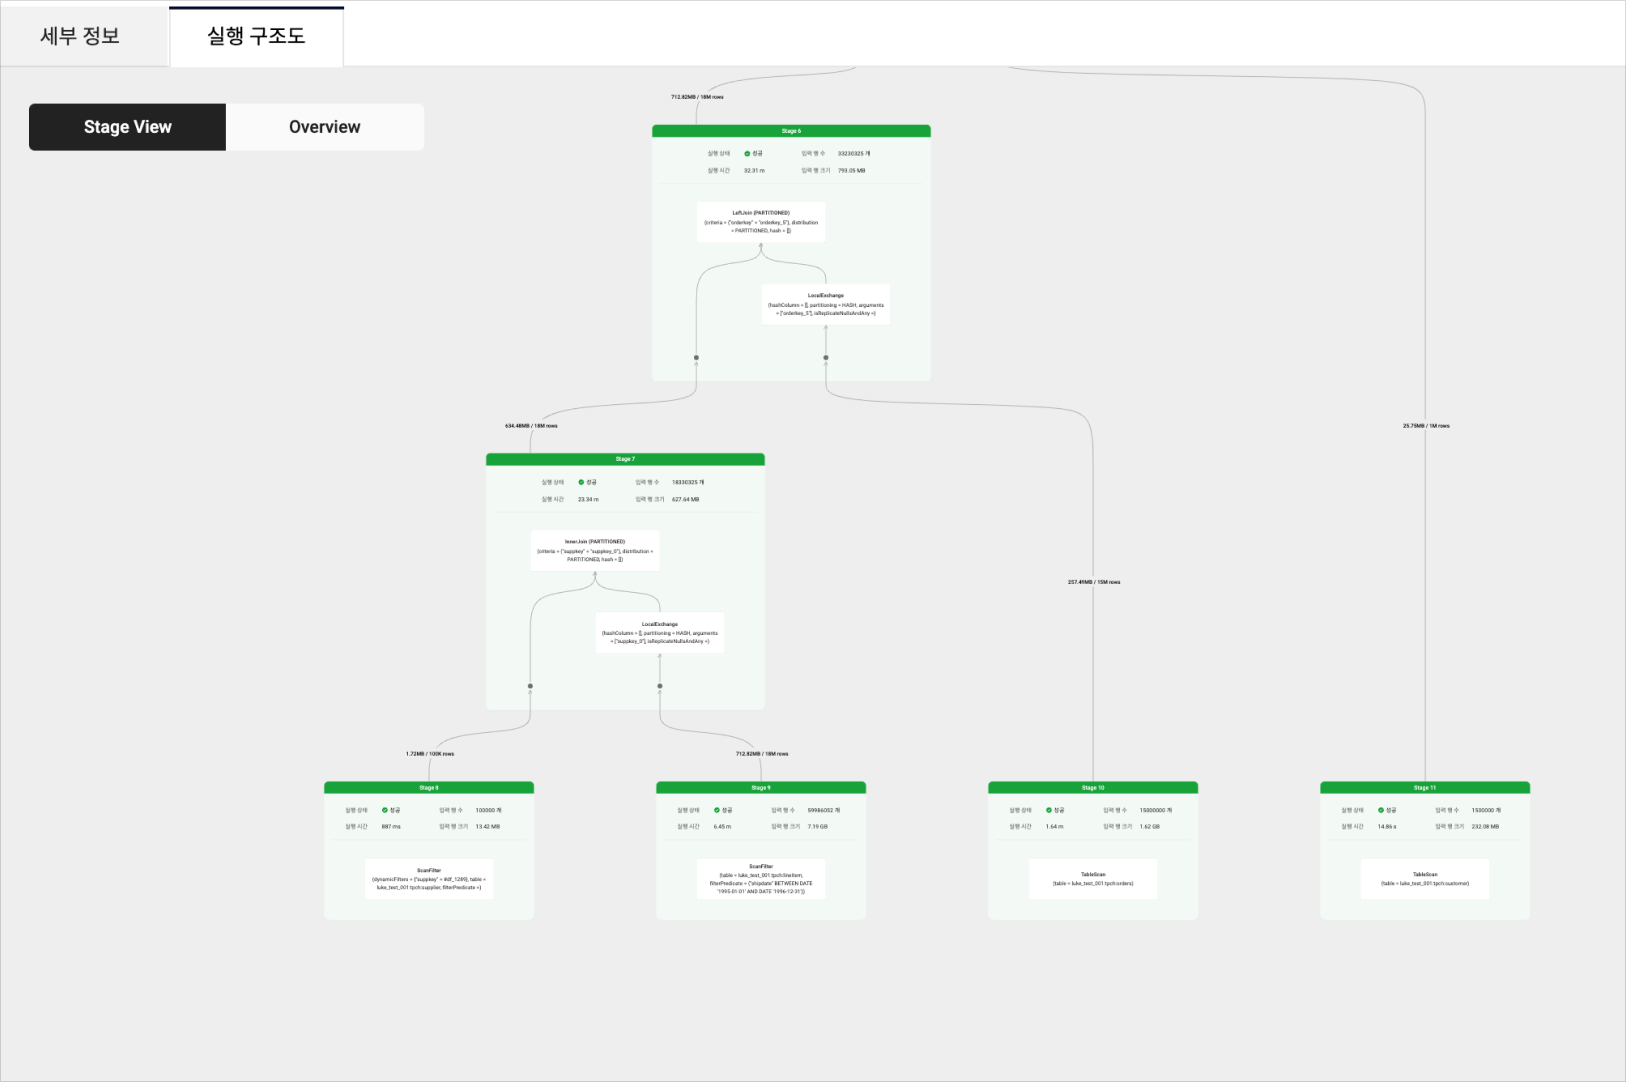
Example: execution flow chart
Stage view
Shows detailed execution info by stage.
You can monitor data flow and parallel processing in real time to optimize query performance.
| Item | Description |
|---|---|
| Status | Query execution status |
| Execution time | Total time of tasks per stage ⚠️ Different from Query result details execution time, as it includes time of parallel tasks |
| Input rows | Number of rows scanned |
| Input size | Size of scanned data |
| Aggregated values | Calculated aggregate values from grouping or summarization during execution - Multiple aggregates may appear in one stage if multiple GROUP BY operations are performed |
Overview
Shows a summarized view of execution by stage.
| Item | Description |
|---|---|
| Status | Query execution status |
| Execution time | Total time of parallel tasks per stage |
| Input rows | Number of rows scanned |
| Input size | Size of scanned data |