Use read endpoint
The read endpoint supports real-time querying and analysis of Prometheus data. It is used for integration with visualization tools like Grafana, data processing and monitoring via REST API, and leveraging metric data in scripts or applications.
You can find the read endpoint of a workspace using the workspace information API. (View workspace information)
Query data using REST API
Prometheus read endpoint provides an HTTP API and allows direct data querying using PromQL.
Example 1. Query latest data of specific metric
curl -X GET "https://advanced-managed-prometheus.kr-central-2.kakaocloud.com/workspaces/XXXXXXX/api/v1/query?query=up" \ # Enter workspace read endpoint
     -H "Credential-ID: xxxxxxx" \ # Enter user Credential-ID
     -H "Credential-Secret: xxxxxxxxxx" # Enter user Credential-Secret
- Queries the status of currently active targets (up metric).
{
  "status": "success",
  "data": {
    "resultType": "vector",
    "result": [
      {
        "metric": {
          "__name__": "up",
          "instance": "localhost:9100",
          "job": "node_exporter"
        },
        "value": [1735015596, "1"]
      }
    ]
  }
}
value: Indicates Unix timestamp (in seconds) and target active state ("1").- If inactive, it is displayed as "0".
Example 2. Query metric data over specific time range
curl -v -X GET "https://advanced-managed-prometheus.kr-central-2.kakaocloud.com/workspaces/XXXXXXX/api/v1/query_range?query=rate(http_requests_total%5B5m%5D)&start=2024-12-22T00:00:00Z&end=2024-12-22T01:00:00Z&step=15s" \ # Enter workspace read endpoint
     -H "Credential-ID: xxxxxxx" \ # Enter user Credential-ID
     -H "Credential-Secret: xxxxxxxxxx" # Enter user Credential-Secret
- Calculates metric rate over a specific time range.
- Measures change in metric per unit time for analysis.
{
  "status": "success",
  "data": {
    "resultType": "matrix",
    "result": [
      {
        "metric": {
          "__name__": "http_requests_total",
          "instance": "localhost:9100",
          "job": "web_server"
        },
        "values": [
          [1735012800, "0.5"],
          [1735012860, "0.4"],
          [1735012920, "0.6"]
        ]
      }
    ]
  }
}
- Each element in the time-value array is structured as [timestamp, value].
- Example: [1735012800, "0.5"] means request rate was 0.5 at 00:00:00 UTC on December 22, 2024.
Configure Grafana dashboard
Grafana is a powerful open-source tool for visualizing Prometheus data and building monitoring dashboards.
When integrated with the Managed Prometheus read endpoint, Grafana provides the following features:
- Create real-time dashboards
- Execute complex PromQL queries
- Set alerts and notifications
In addition to Grafana, various visualization tools that support Prometheus exporters can be used. Users can choose a suitable dashboard based on each tool’s characteristics and requirements.
Install Grafana
To integrate with Grafana, you must first install it. You can build it yourself or use a Docker image.
Refer to the Grafana official guide for detailed installation instructions.
Use the following initial login credentials to access Grafana.
| Item | Value |
|---|---|
| Email or username | admin |
| Password | admin |
When logging in to Grafana for the first time, you must change the initial password for account security.
Connect Prometheus
To connect with Grafana dashboard, configure the connection as follows:
-
In the Grafana left menu, go to Connections > Data sources.
-
Select the [Add data source] button to create a new data source.
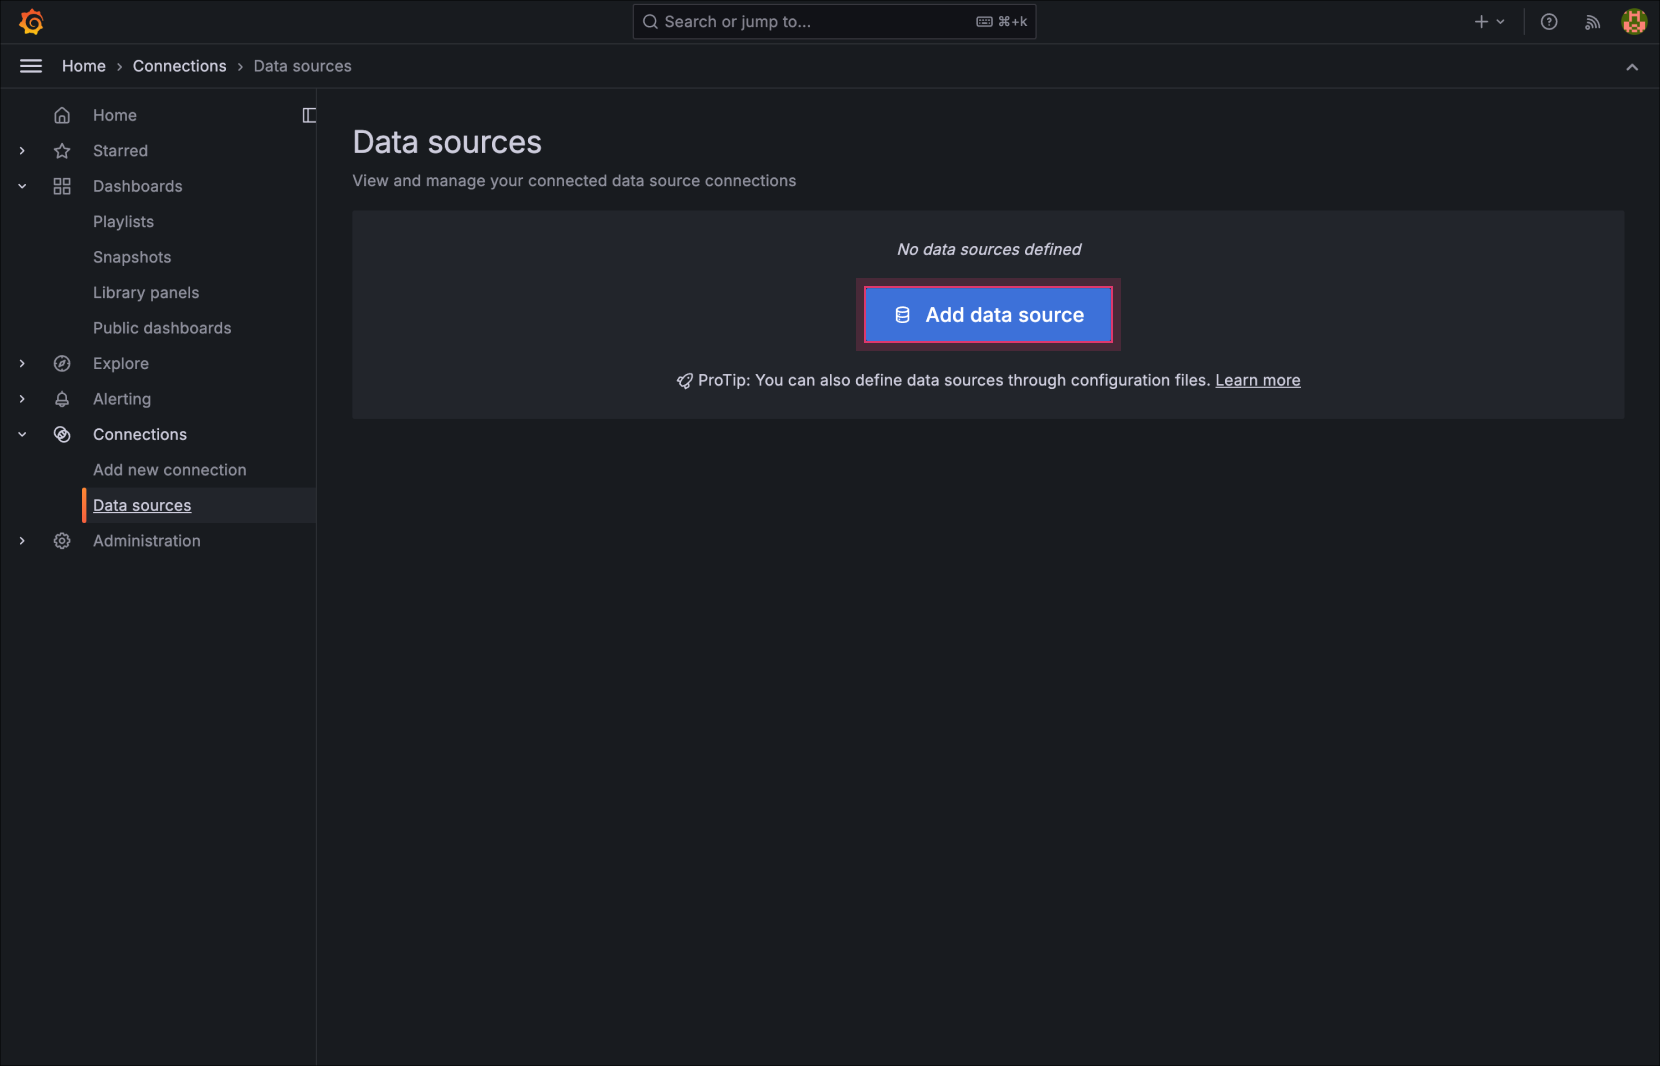
Select Add data source -
Select Prometheus as the data source type.
-
In the Connection section, enter the Prometheus read endpoint.
(Remove the/api/v1/querypart from the URL)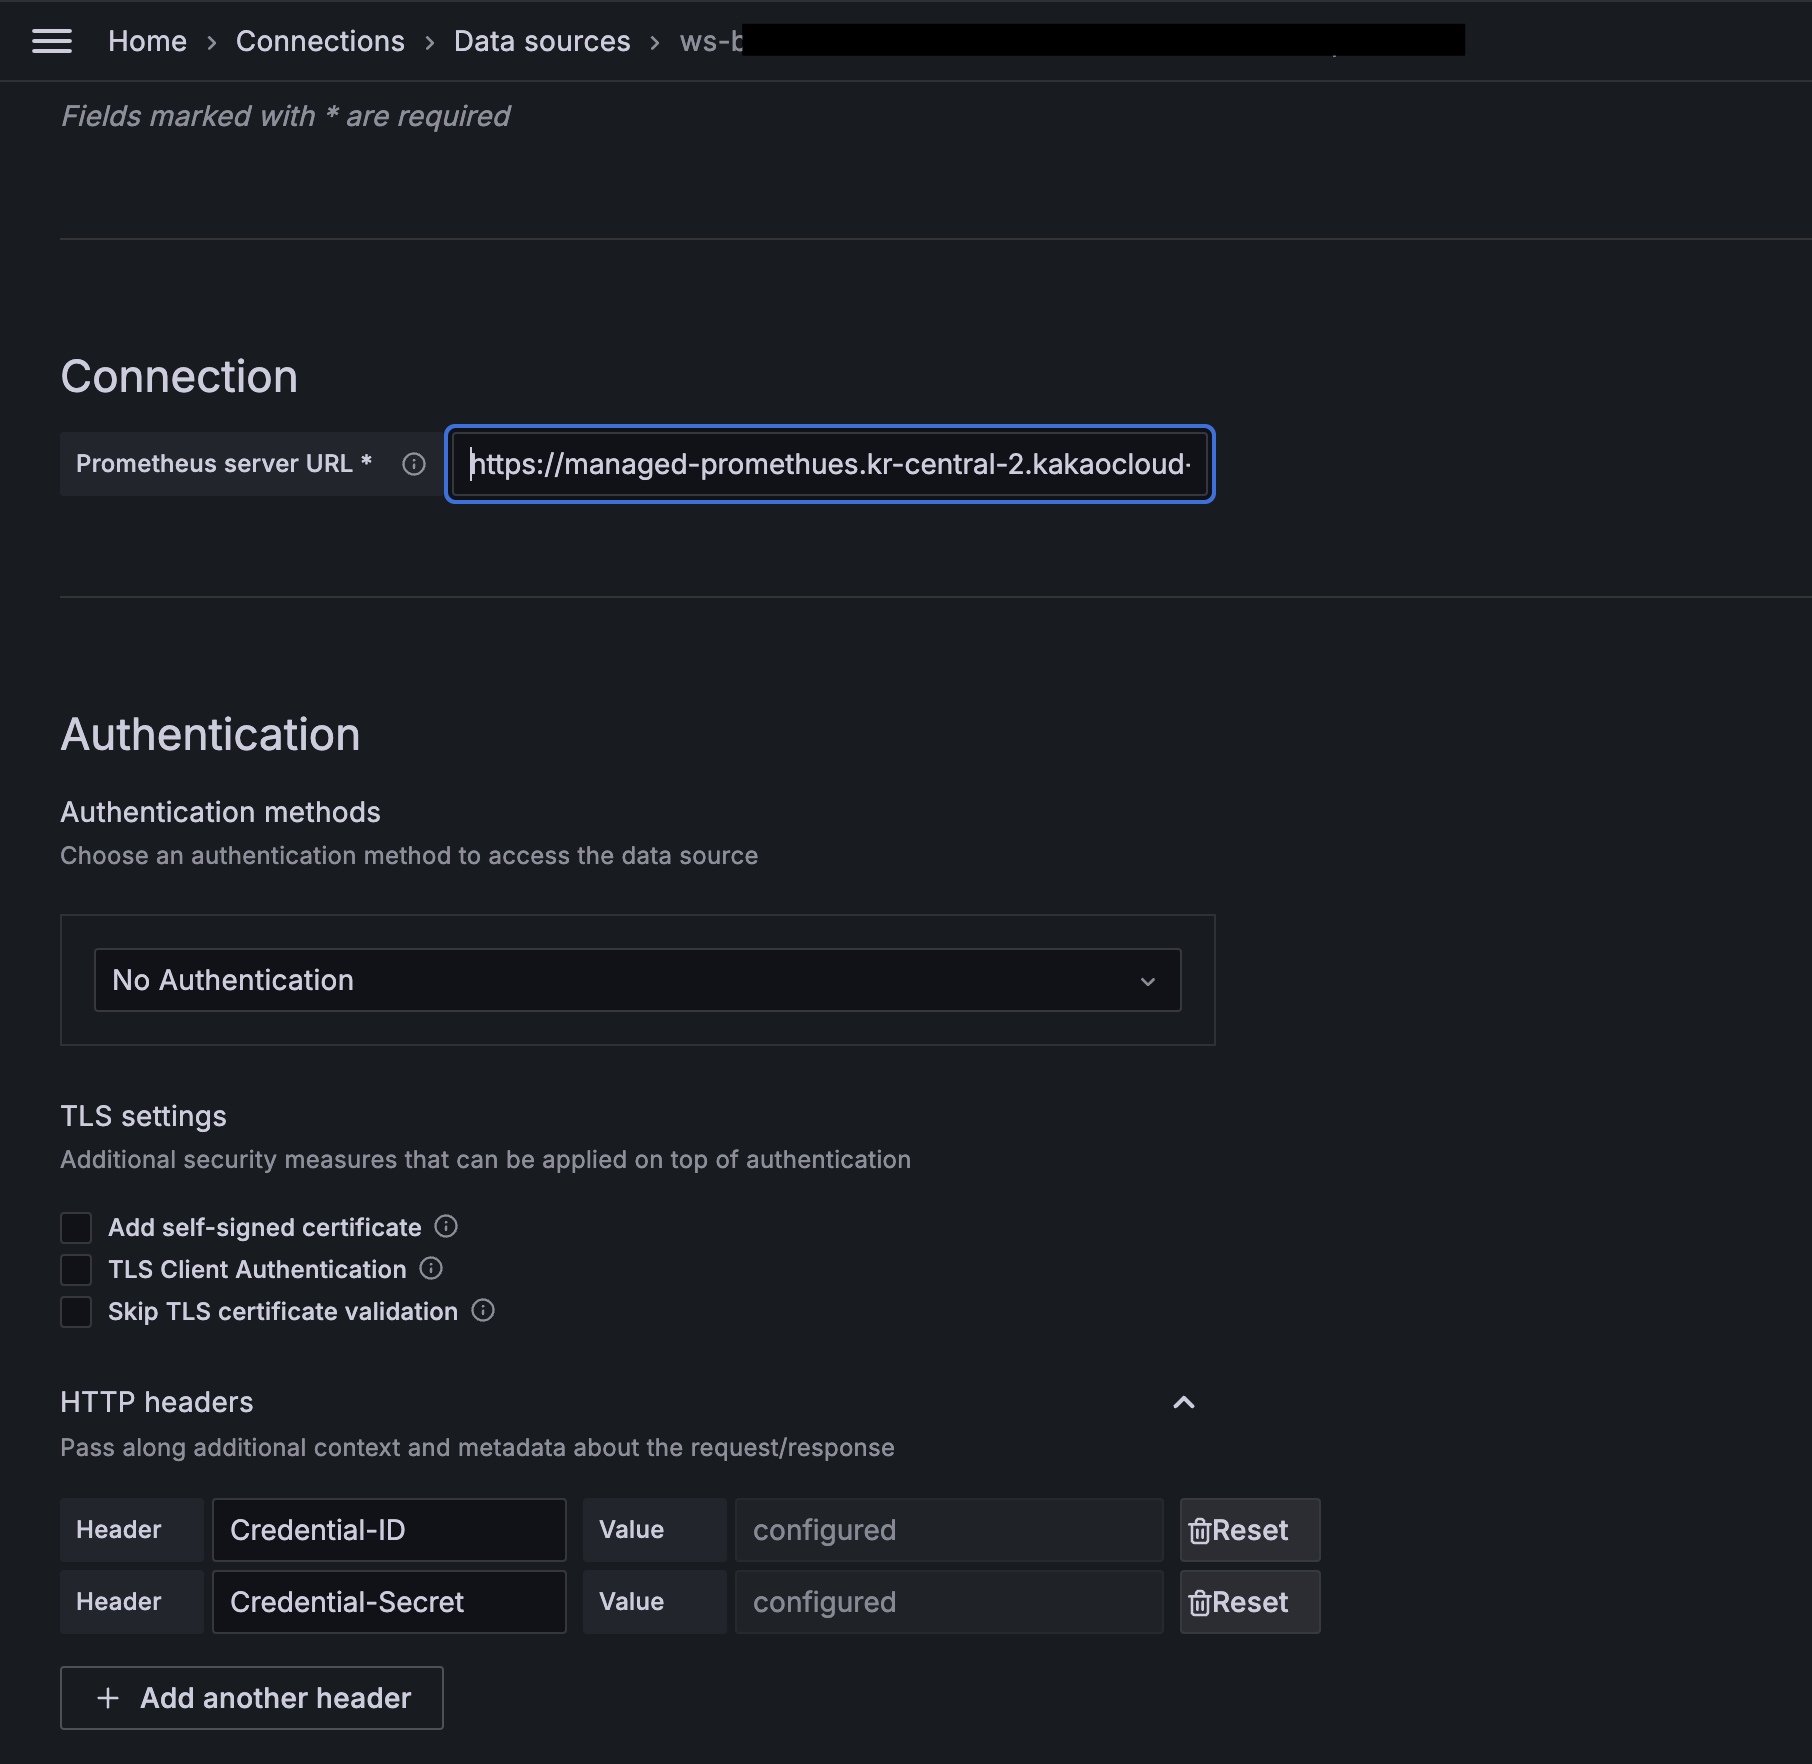
Connection / HTTP Headers settings -
In the HTTP Headers section, enter Credential-ID and Credential-Secret with user-specific values.
-
Select the [Save & test] button.
-
In Dashboards > New dashboards, select the connected Prometheus source and enter the desired PromQL.