Use Metric Export
You can use the Metric Export endpoint provided by the Monitoring service to access KakaoCloud Monitoring data from third-party applications. This section describes how to use Grafana—an open-source software for visualizing and analyzing Time Series Database (TSDB) data—to view the data.
- This service is only available to requests made from a VM with a public IP or from a VM created in a VPC with an internet gateway.
- Warning messages may appear when using features like Alarm Rules.
- The Metric Export path
/metricwill be available until December 31, 2024.
Provided APIs
Monitoring Metric Export provides the following APIs. All APIs are compatible with the Prometheus HTTP API.
| Item | Description |
|---|---|
| /metric-export/grafana/:id/prometheus/api/v1/series | Returns a list of time series matching a specified label set. |
| /metric-export/grafana/:id/prometheus/api/v1/query_range | Returns query results for a specific time range. |
| /metric-export/grafana/:id/prometheus/api/v1/query | Returns query results for a single point in time. |
| /metric-export/grafana/:id/prometheus/api/v1/metadata | Returns metadata about metrics. |
| /metric-export/grafana/:id/prometheus/api/v1/labels | Returns a list of label names. |
| /metric-export/grafana/:id/prometheus/api/v1/label/:labelName/values | Returns a list of label values for the specified label name. |
Supported metrics for export
Using Metric Export, you can view all metrics available within your KakaoCloud Monitoring project.
For more details, refer to Monitoring metrics.
Grafana guide
Prerequisites
1. Install Grafana
Grafana must be installed depending on your environment. You can either build it yourself or use a Docker image. For installation instructions, refer to the official Grafana documentation.
- This guide is based on Grafana v8.5.27.
2. Check the Metric Export endpoint
The Metric Export endpoint is structured as follows. Replace {project_id} with your project ID.
kr-central-2 : https://monitoring.kr-central-2.kakaocloud.com/metric-export/grafana/{project_id}/prometheus
3. Get access key
To use the Metric Export API, you need an access key. Refer to the Issue access key guide to obtain your Access Key ID and Secret Access Key.
Create Prometheus data source
KakaoCloud Monitoring supports the Prometheus data format. Follow the steps below to create a data source.
- kr-central-2
-
In Grafana, go to Connections > Data sources from the left-hand menu.
-
Select [Add data source] to create a new data source.
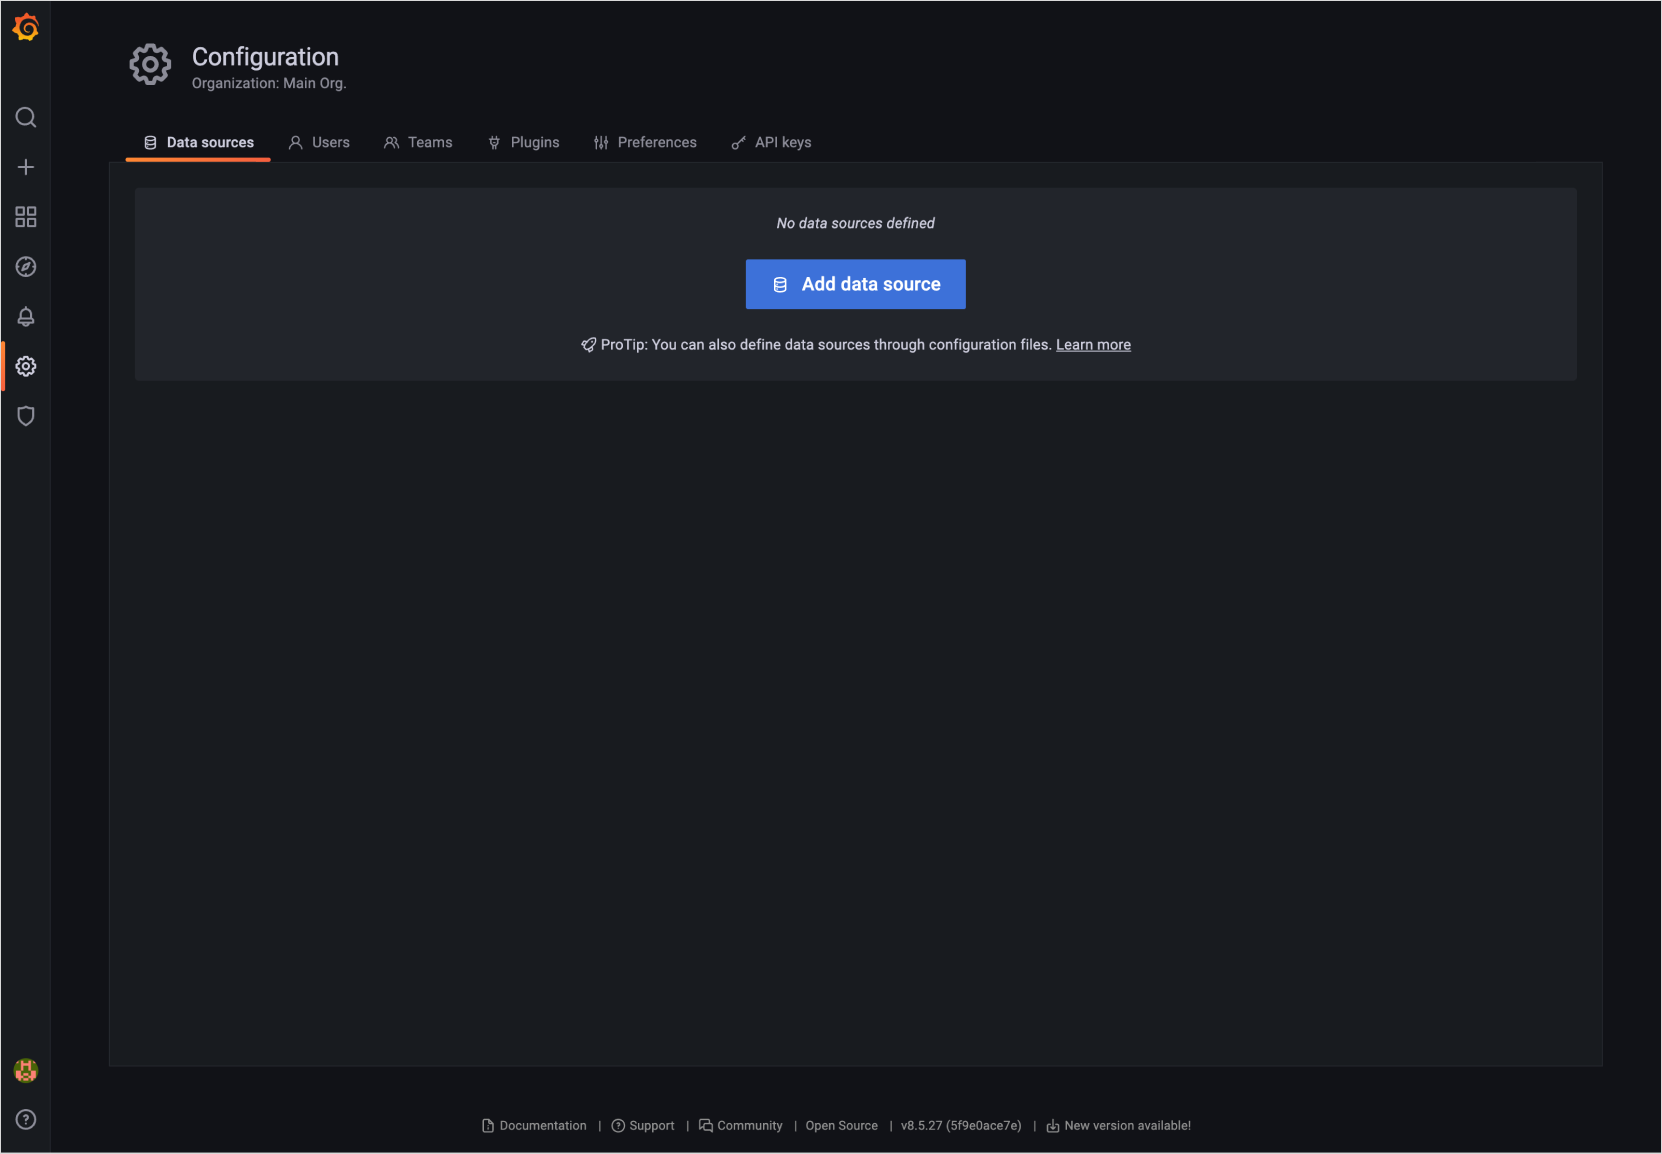
-
Select Prometheus as the data source type.
-
In the HTTP section, enter the Metric Export endpoint in the Prometheus server URL.
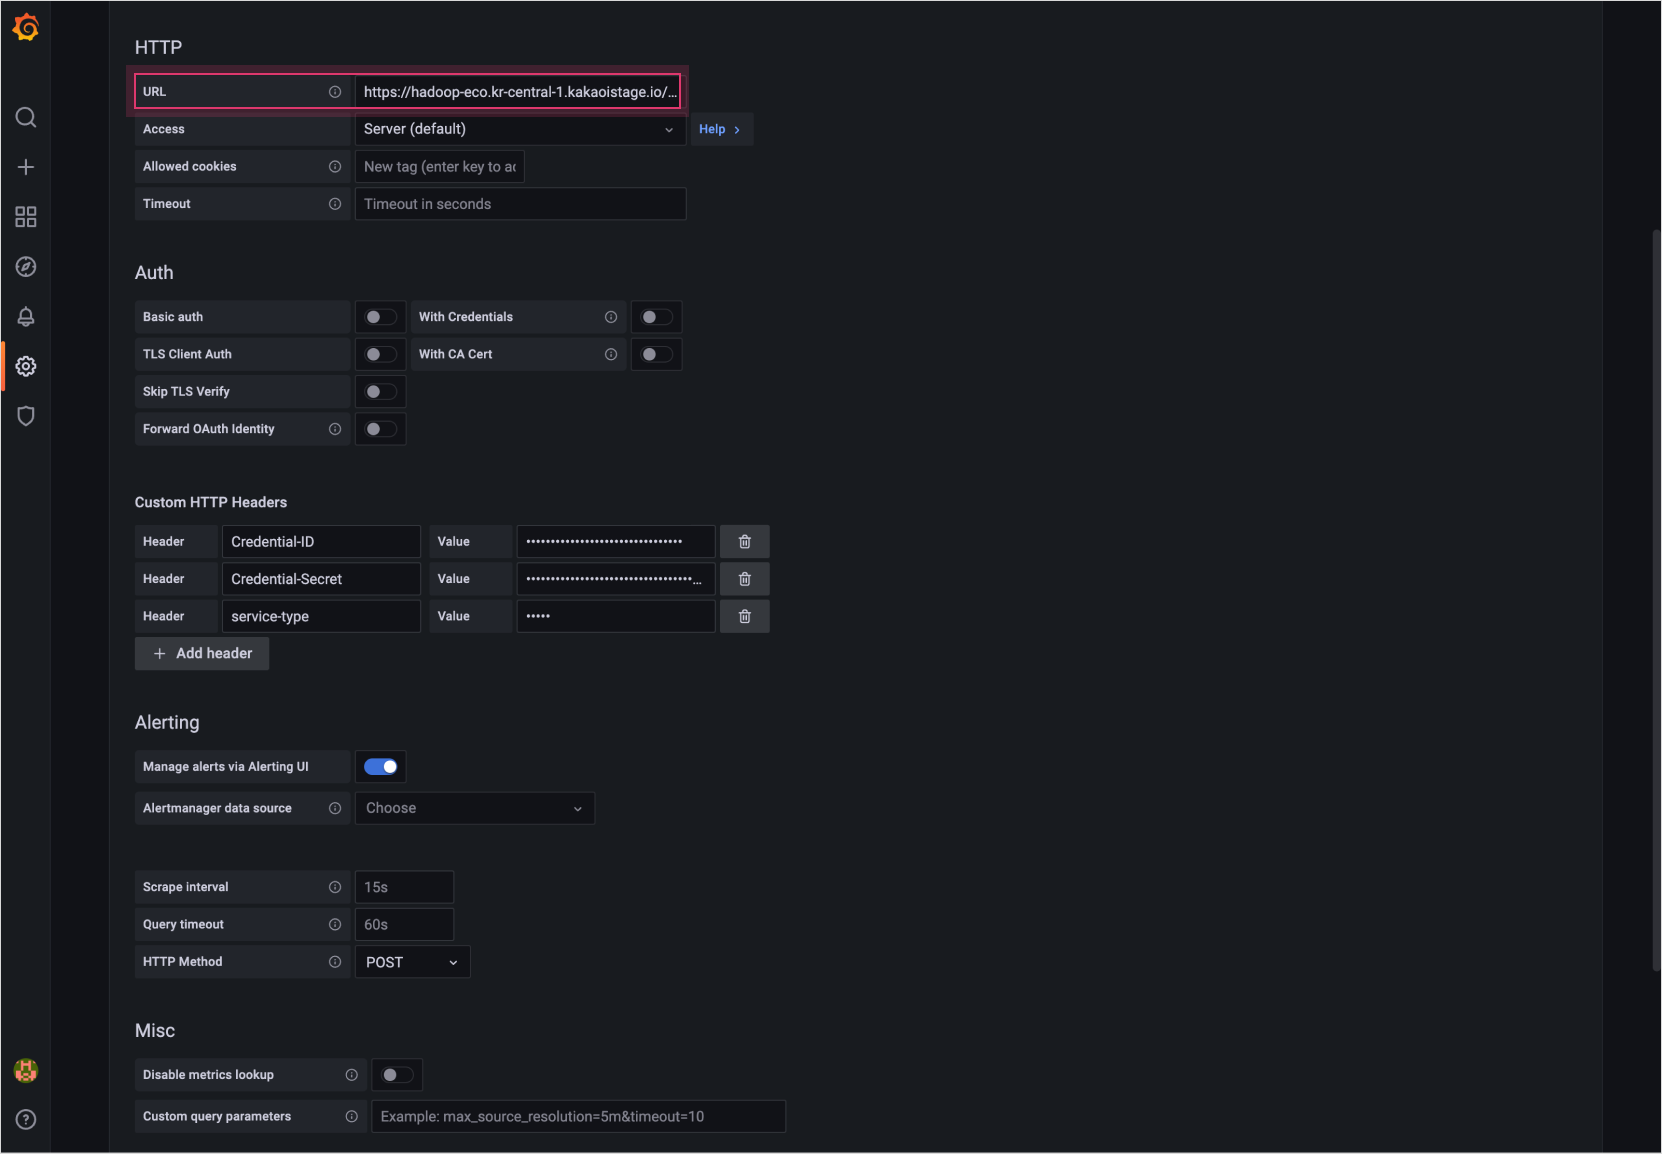
-
In Custom HTTP Headers, select [Add header] and enter the following values:
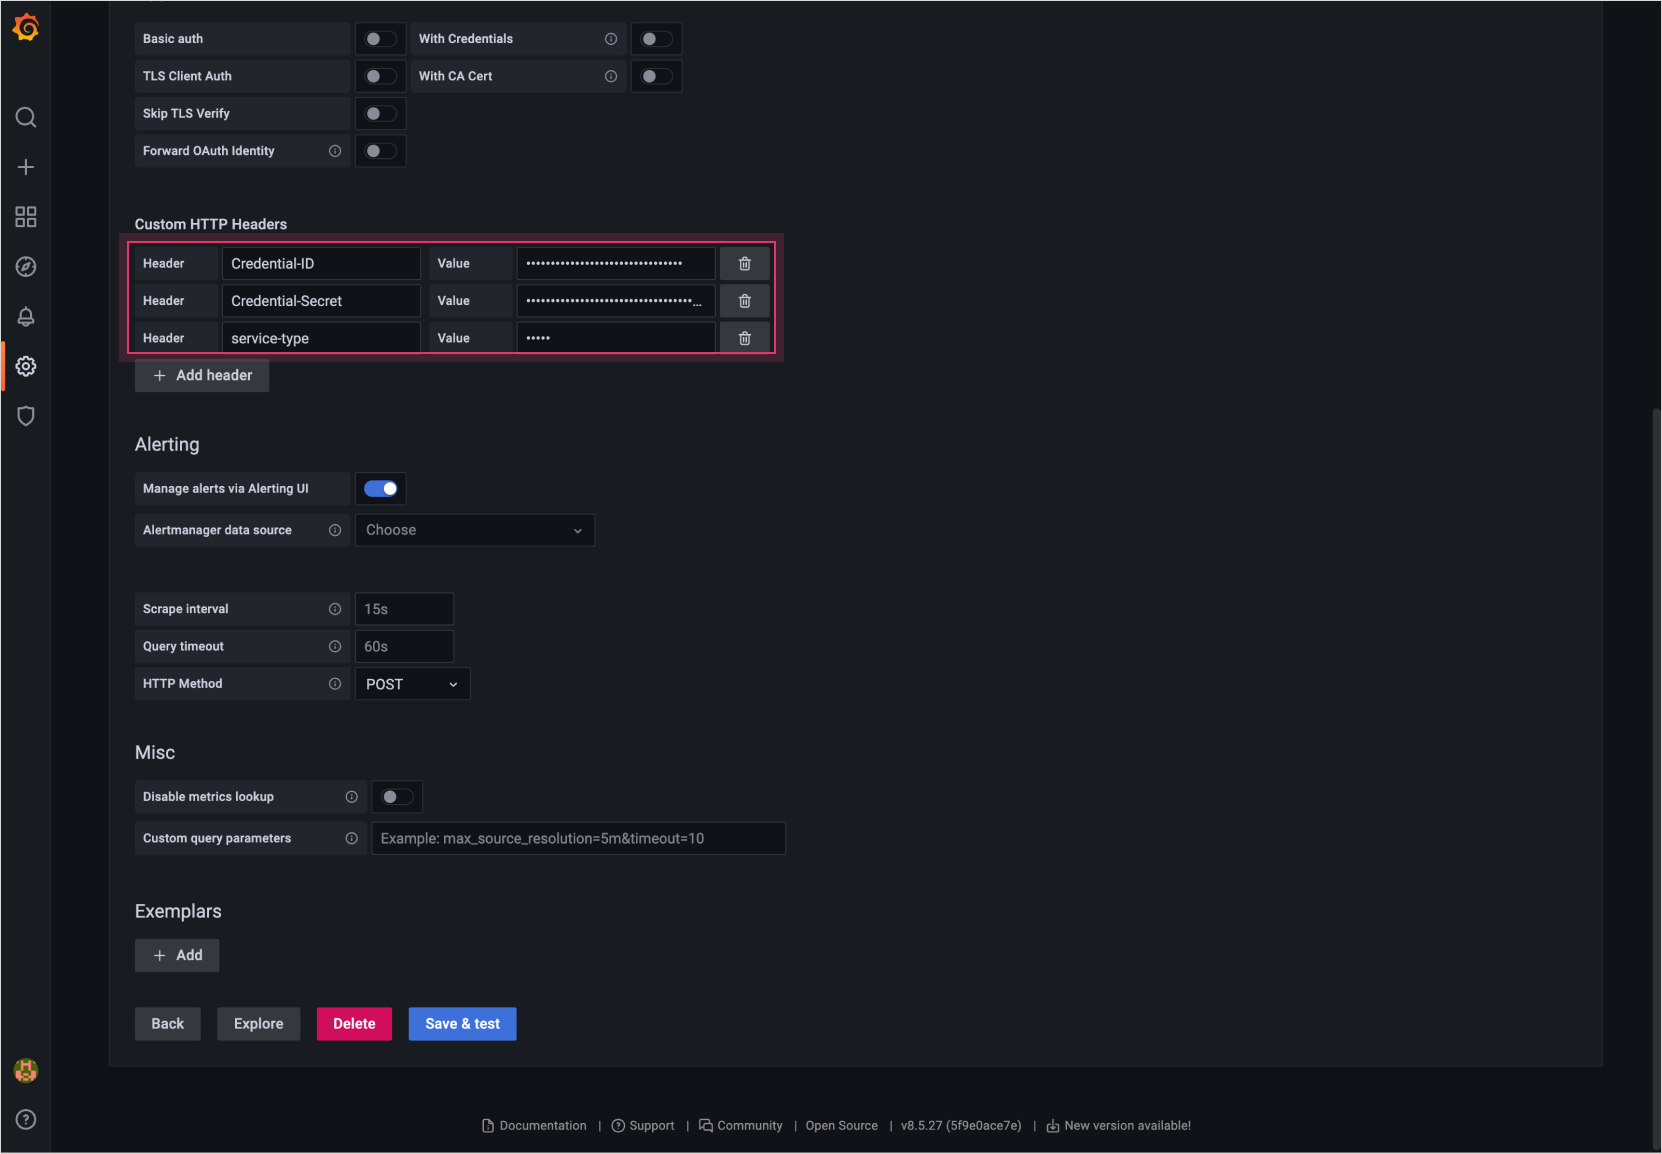
Item Description Credential-ID Your Access Key ID Credential-Secret Your Secret Access Key service-type Enter the service type to query from the corresponding data source. - Supported services (input values): - Virtual Machine, GPU, Bare metal Server (input value: server) - Libvirt (input value:libvirt) - Load Balancing (input value:lb) - Kubernetes Engine (input value:ke) - MySQL (input value:mysql) - MemStore (input value:memstore) - PostgreSQL (input value:postgresql) - Direct Connect (input value:dx) - Gateway Load Balancer (input value:gwlb) - Private Endpoint (input value:private_endpoint) -
Select [Save & test] at the bottom to save and validate the configuration.
View monitoring metrics
You can use the configured data source to view metrics provided by the Monitoring API.
- kr-central-2
- From the left-hand menu in Grafana, go to Explore.
- Select the Prometheus data source you configured.
- Choose a metric from the list.
- Select Run query at the top-right to view time-series data.
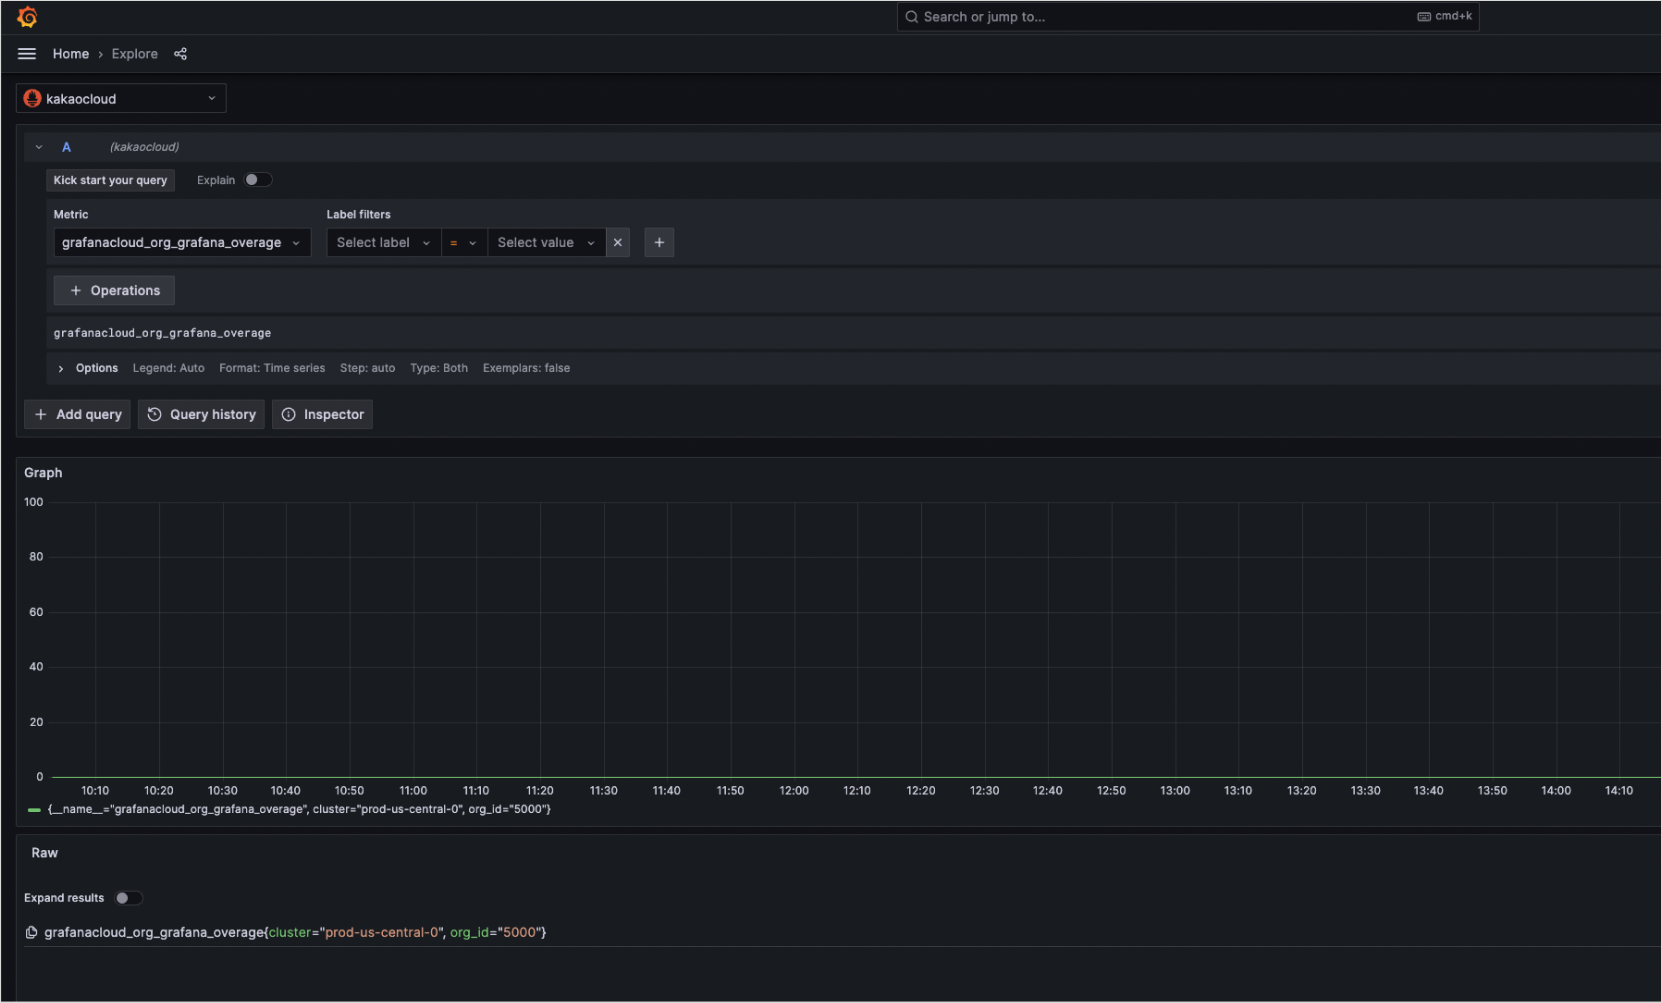
Configure custom dashboard
You can create custom Grafana dashboards using KakaoCloud monitoring data.
- kr-central-2
- Go to the Dashboards page in the left-hand menu of Grafana.
- Select [New] on the right, then select New dashboard.
- Select Add visualization and select the previously created Prometheus data source.
- After configuring your dashboard, select [Save] in the top-right corner.
Billing unit: QSS
Metric Export charges are based on Query Samples Scanned (QSS).
QSS example
QSS is calculated depending on the query type (instant or range), the minimum step value, and other user-defined settings.
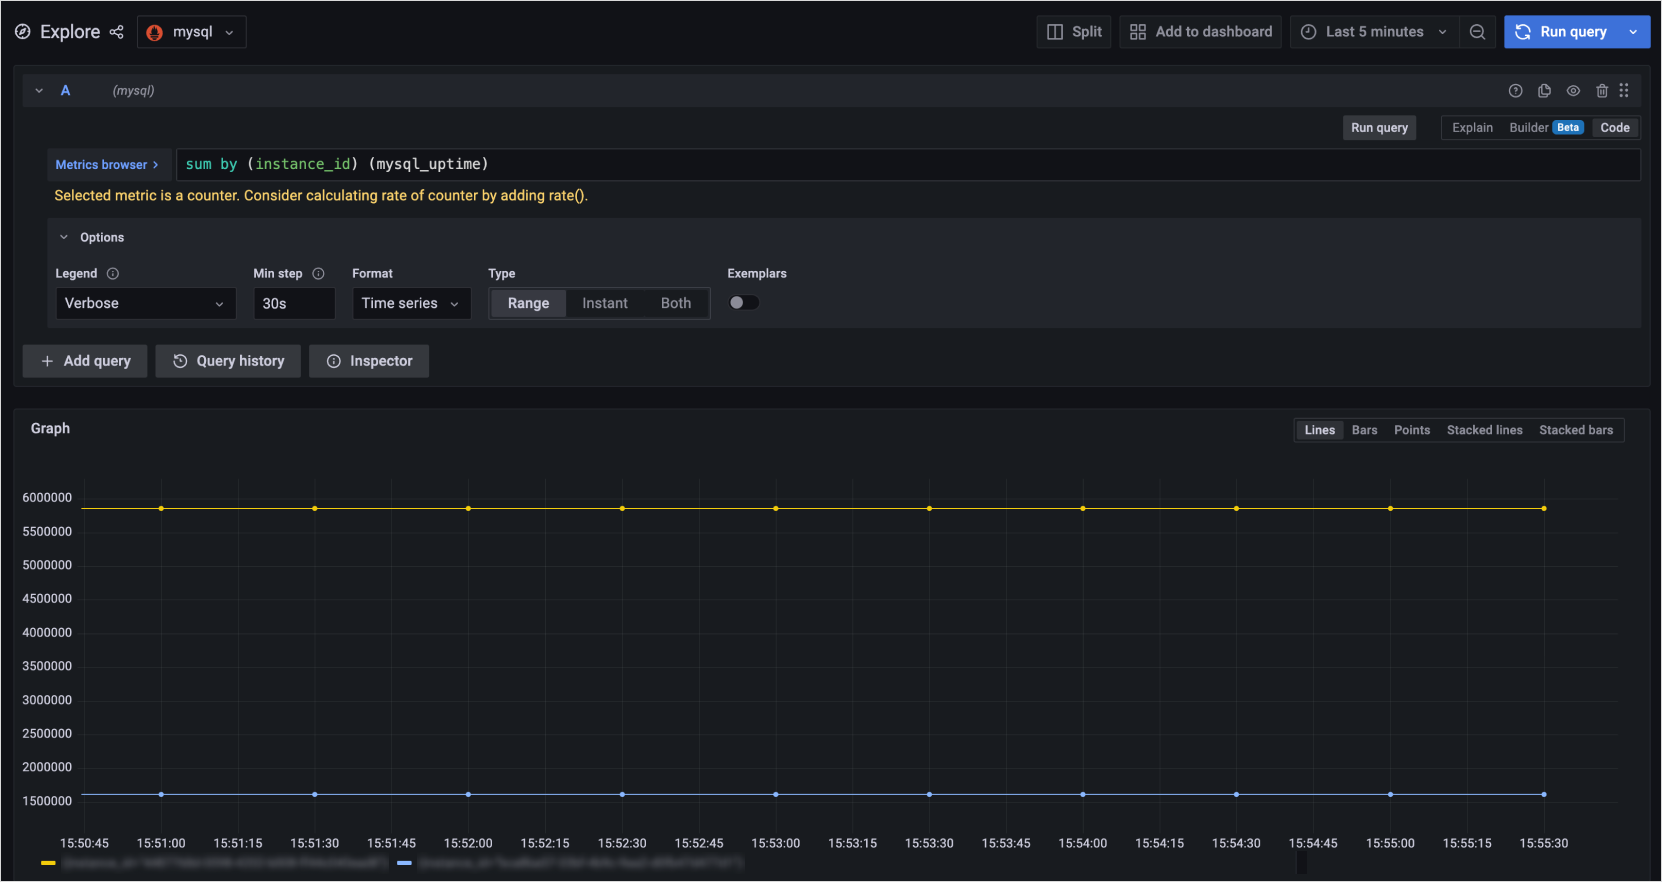
QSS calculation example
-
If you configure the query in Grafana as shown below and assume there are no missing data points for 1 hour,
the number of data points can be calculated as follows:Query example{
"query": "sum by(instance_id) (mysql_uptime)", // query
"range": "1h", // time range for query
"step": "15s" // interval between data points
}3600 seconds (range) / 15 seconds (step) = 240 data points
-
Multiply this by the number of time series in the metric:
240 × 2 = 480 QSS -
Add one initial data point per series to account for the start of the range:
480 + 2 = total 482 QSS -
When using functions like
rate, the function processes data within the specified interval before calculation.Function examplerate(cpu_usage[5m])
// Applies rate over 5 minutes
// If raw data is collected every 30 seconds, a total of 10 data samples are scanned over 5 minutes