Key Concepts
KakaoCloud’s Monitoring service monitors the status of computing resources and supports fast issue detection and response through a notification feature when events occur. Users can monitor key resources in real time via dashboards in a web environment, and configure a systematic monitoring system by setting metric and log policies. Through the Monitoring service, users can manage their resources flexibly and efficiently while minimizing the resources required for administration.
Monitoring service system architecture
The Monitoring service is designed to allow users to set various policies required for resource operation and management, so that the desired data can be collected. When a failure occurs, the monitoring history can be viewed through alerts based on preconfigured policies, allowing users to identify the issue quickly.
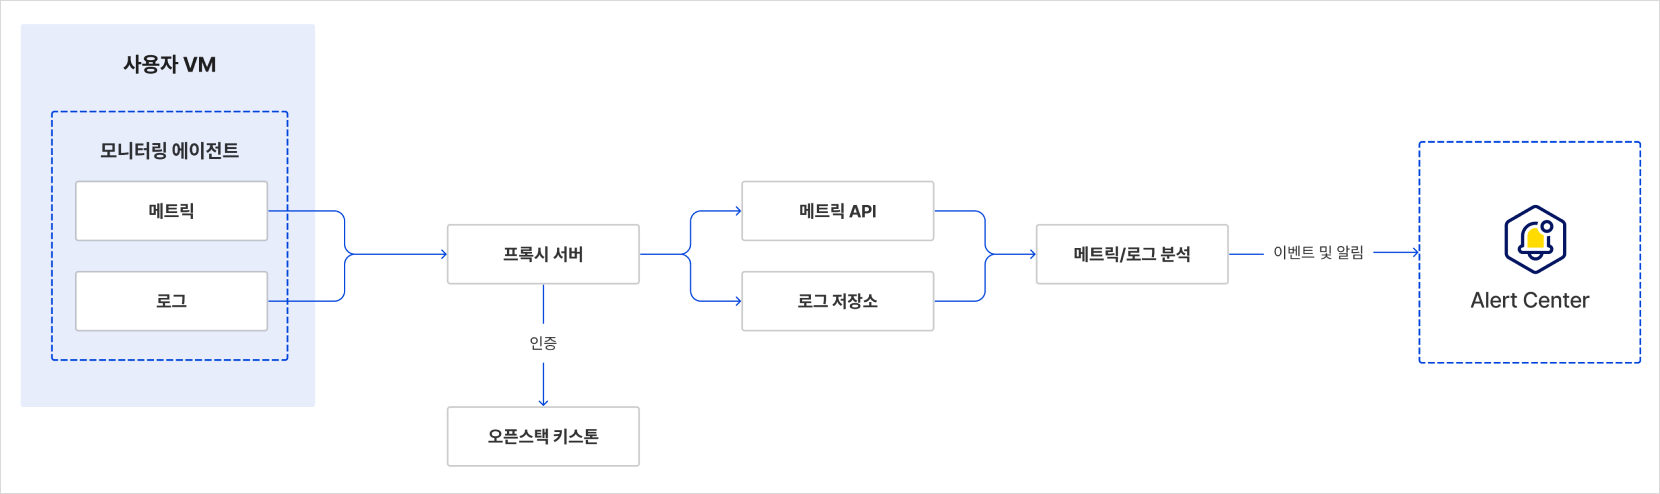
Monitoring service architecture
Monitoring key concepts
Dashboard
In the Monitoring service, users can monitor key resources in real time using the dashboard. The types of dashboards provided are as follows:
| Type | Description |
|---|---|
| Default dashboard | A default dashboard provided by KakaoCloud that allows users to view metrics for in-use resources without additional configuration. - The default dashboard cannot be modified by users and only allows viewing of provided metrics. |
| Custom dashboard | A dashboard created by the user, where metric charts of desired services can be added and managed. - For supported metrics, refer to Monitoring Metrics. |
You must install the KakaoCloud monitoring agent to view metrics.
For installation instructions, refer to Install agent.
Dashboard supported services
| Category | Service details |
|---|---|
| Dashboard supported services | Beyond Compute Service └ Virtual Machine └ Bare Metal Server └ Load Balancing Container Pack └ Kubernetes Engine (default) Data Store └ MySQL └ PostgreSQL └ MemStore Analytics └ Pub/Sub |