ML experiment management with Kubeflow TensorBoard
This tutorial explains how to manage and visualize log data generated during machine learning experiments by using the TensorBoard component in the Kubeflow environment on KakaoCloud.
- Estimated time: 10 minutes
- Recommended OS: MacOS, Ubuntu
- Notes:
- In a private network environment, file downloads may not function properly.
About this scenario
TensorBoard is an essential tool for intuitively monitoring and analyzing the training process of machine learning models. Within the Kubeflow environment, you can use TensorBoard to monitor training progress in real time and compare different experiment results. This scenario will walk you through how to interpret key metrics for optimizing model performance and how to manage experiments using TensorBoard.
This tutorial introduces the step-by-step process of visualizing and analyzing logs from actual training data using TensorBoard in KakaoCloud’s Kubeflow environment.
Key topics include:
- Creating and configuring a TensorBoard instance in Kubeflow
- Monitoring and visualizing training logs in real time
- Analyzing the training process using TensorBoard
Supported tools
| Tool | Version | Description |
|---|---|---|
| TensorBoard | 2.5.1 | A visualization tool for ML experiments. It enables tracking and visualizing metrics, weight histograms, and tensors. |
For more details on TensorBoard, refer to the official TensorBoard documentation.
Before you start
This section covers the environment setup and required resources to use TensorBoard.
1. Prepare Kubeflow environment
Before using TensorBoard in Kubeflow, verify that your node pool meets the minimum specs for the tutorial. If you need to configure the environment, refer to the guide Deploy Jupyter Notebooks on Kubeflow.
Minimum requirements:
- Node pool spec: At least 4 vCPUs and 8GB RAM
- Available file storage: At least 10GiB
Getting started
This section outlines the concrete steps for managing and visualizing ML experiment logs with TensorBoard.
Step 1. Create notebook instance for practice
This step walks you through creating a notebook instance in Kubeflow for the exercise.
- In the Kubeflow dashboard, go to the Notebooks tab.
- Click the [New Notebook] button to create an instance.
- In the New notebook setup screen, enter the following:
- Notebook Image: Select
kc-kubeflow-registry/jupyter-tensorflow-full:v1.10.0.py311.1a - Notebook Specs: At least 1 vCPU and 2GB RAM
- Notebook Image: Select
- Click [LAUNCH] to create the notebook instance.
Step 2. Train the model
This step involves training a model whose logs will be visualized using TensorBoard.
-
Download the example project from the link below and upload it to the notebook instance you created:
-
Run the code block to create a log directory.
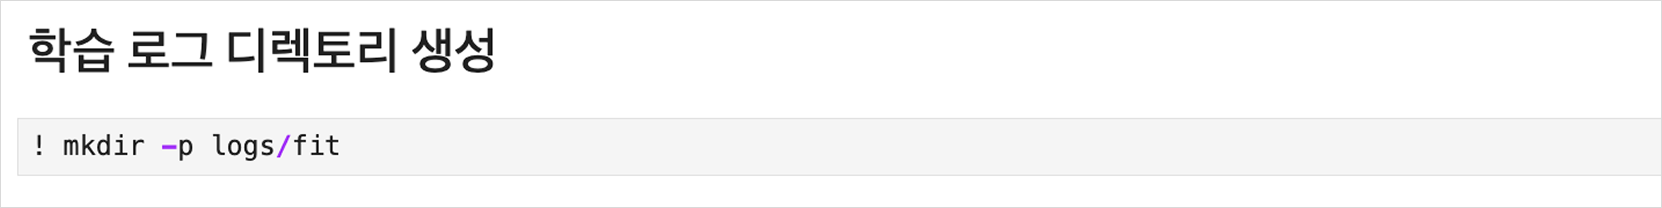
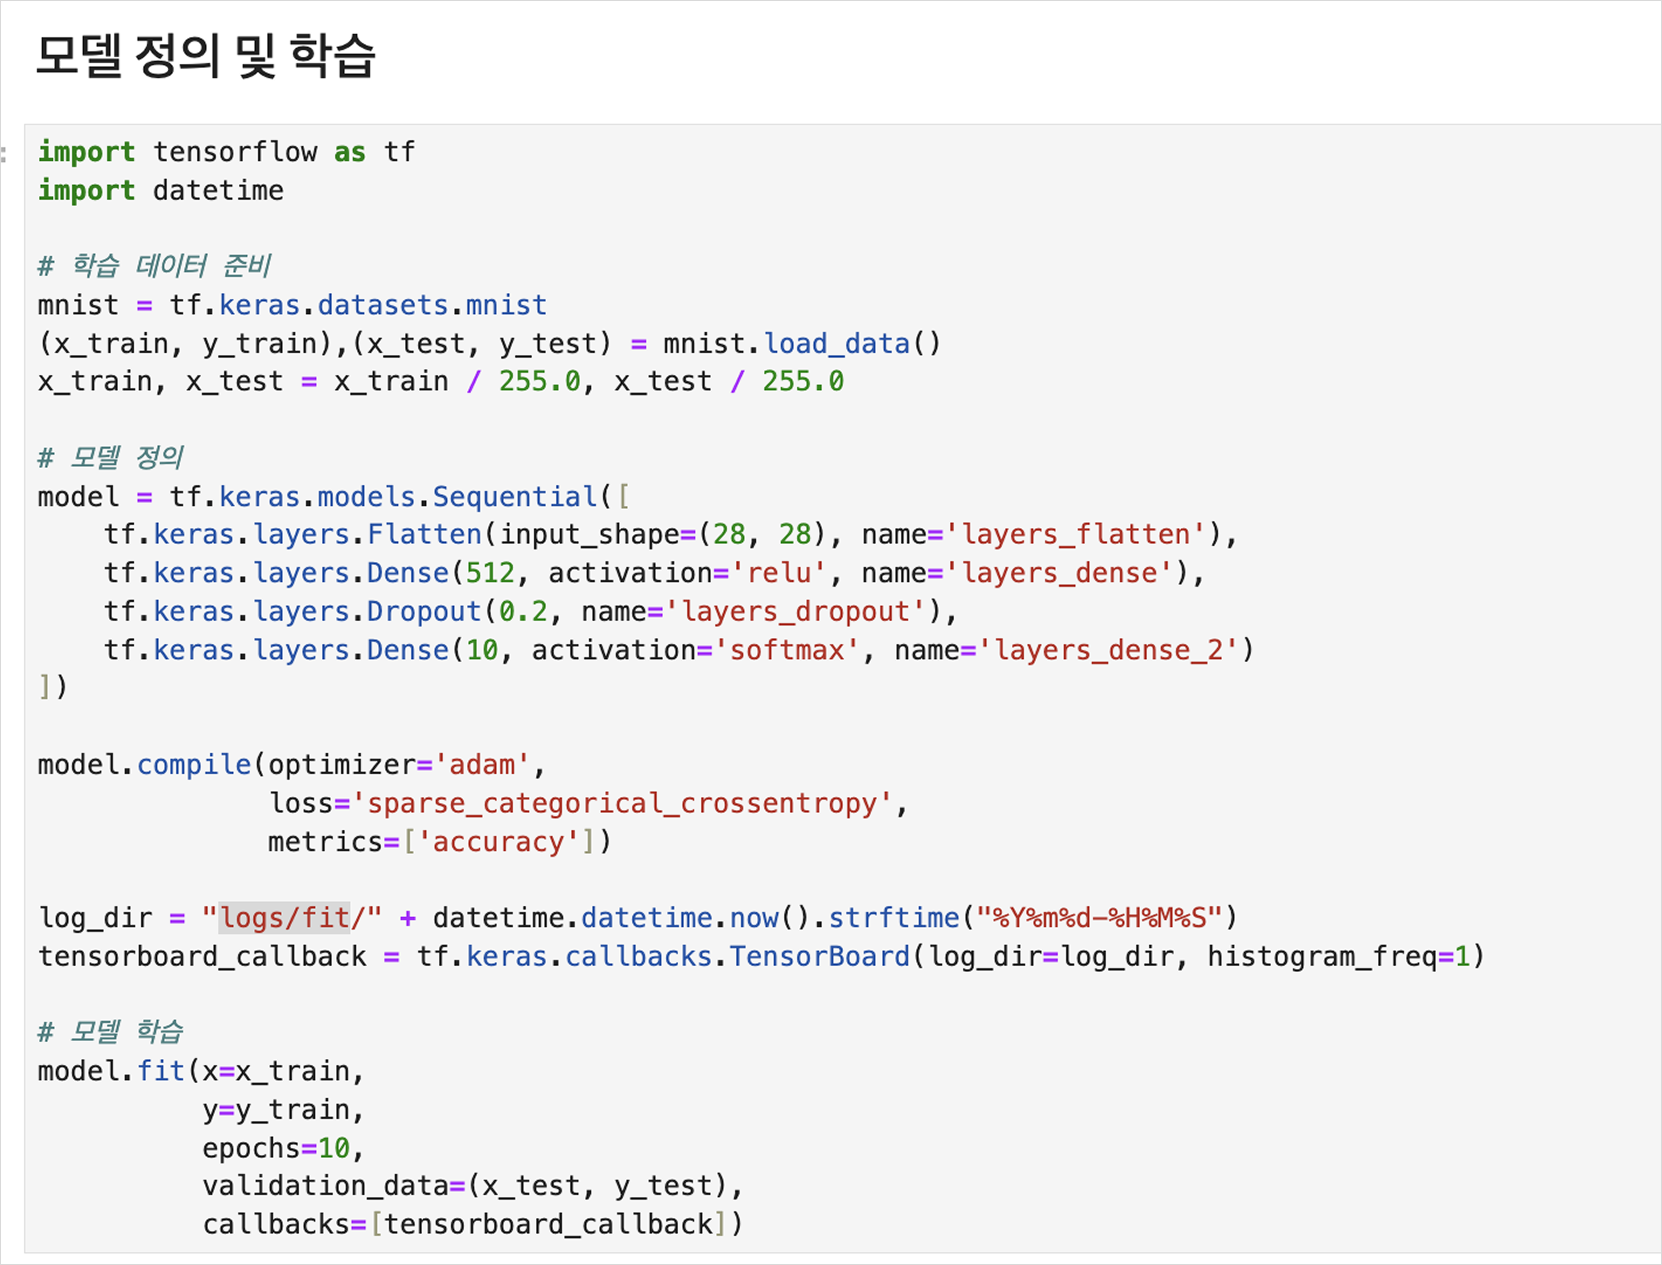
-
Run the model definition and training code block to start training the practice model.
Step 3. Create TensorBoard instance
-
Go to the Tensorboards tab and click [New TensorBoard].
-
Fill in the required information on the New Tensorboard screen, then click [Create].
Field Value Storage type PVC PVC Name Name of the Workspace Volume from the notebook created in Step 1 Mount Path Path where training logs are stored (for this tutorial: logs/fit) -
Click the [CONNECT] button to open and view the TensorBoard instance.
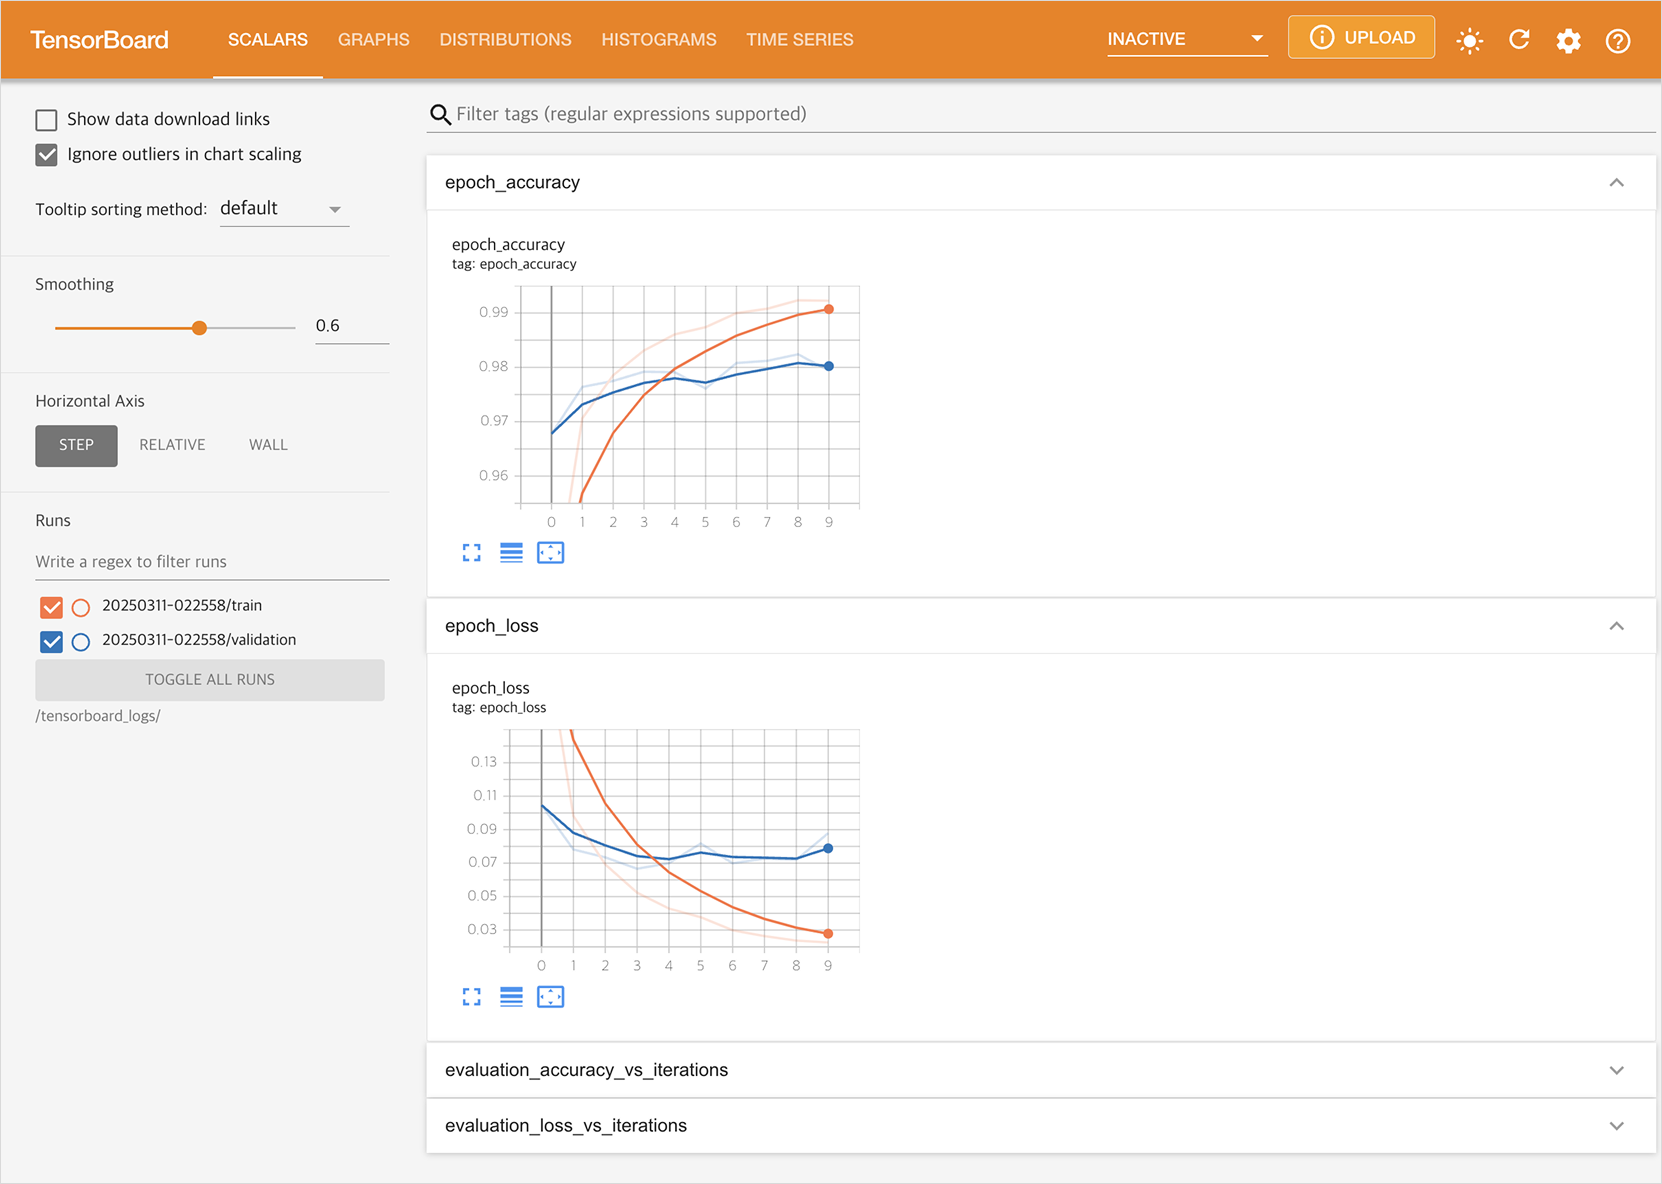
Step 4. Confirm integrated results with TensorBoard
This step shows how to train the model and review the training results in TensorBoard.
-
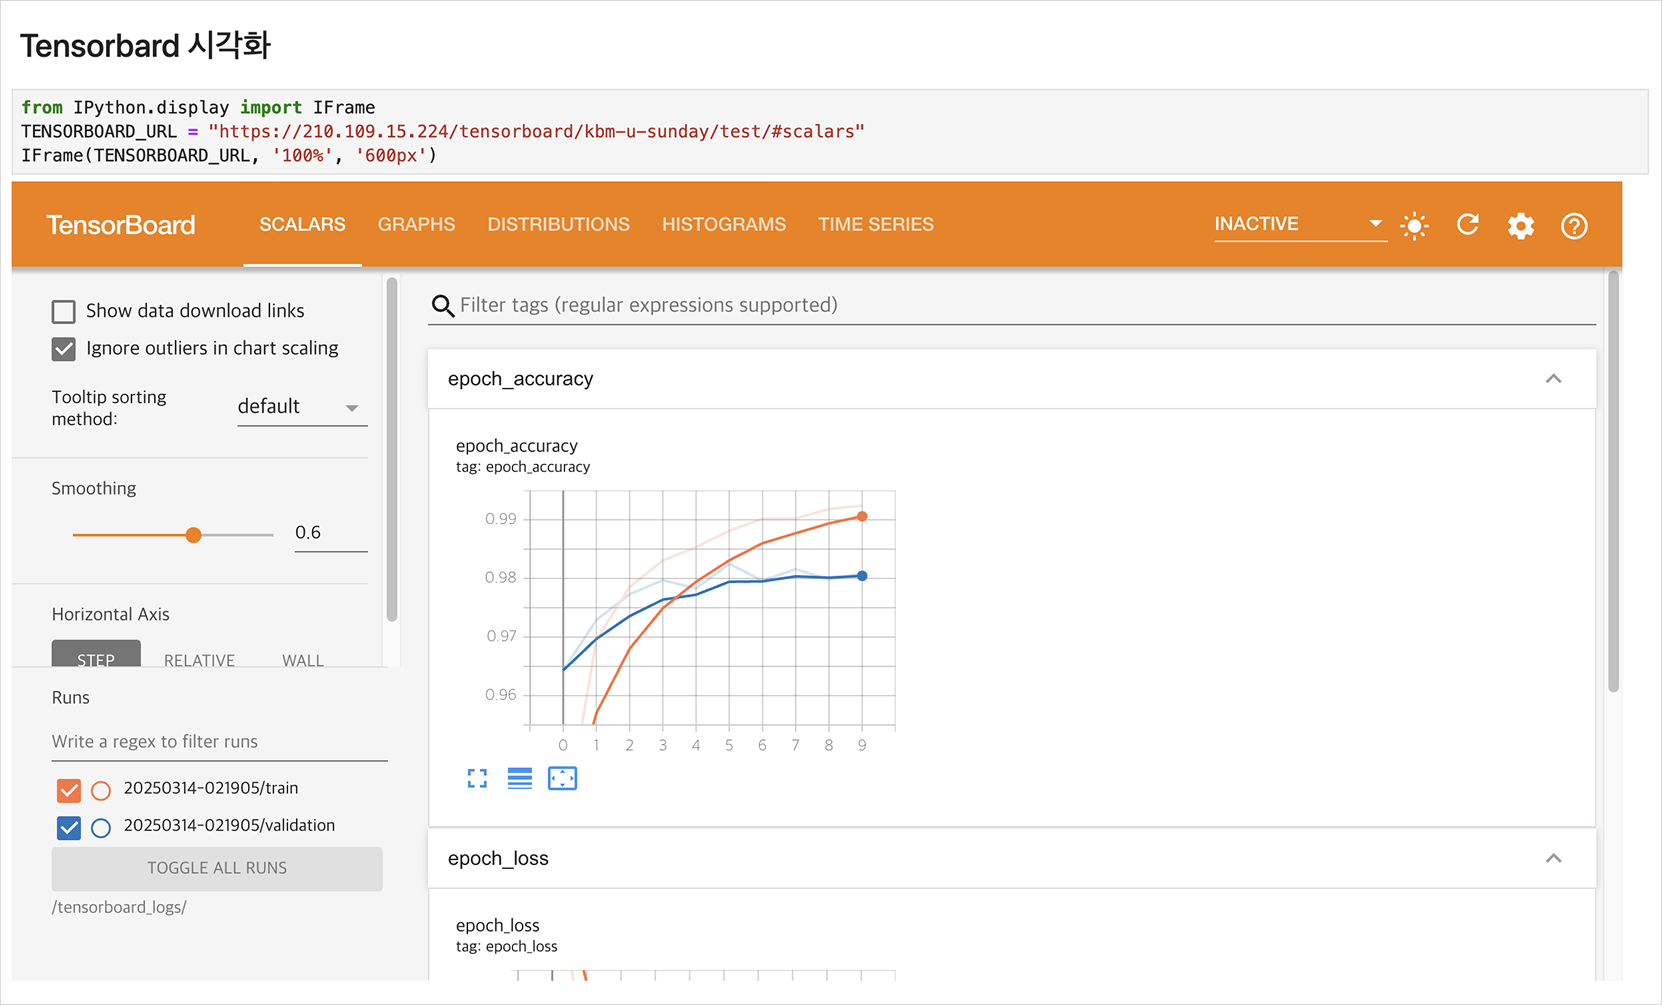
In the notebook, set the
TENSORBOARD_URLvariable to the address of the TensorBoard created in Step 3.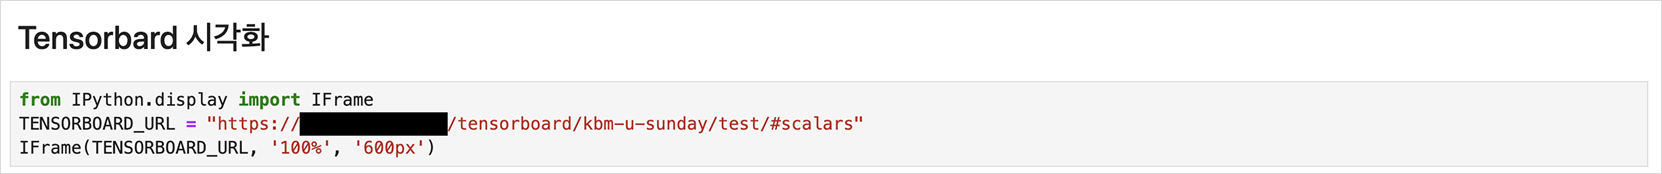
-
Run the notebook code to train the model and monitor the process through an IFrame displaying TensorBoard.