Monitor VM instance
In KakaoCloud, you can monitor the computing resources of VMs within a project using the Monitoring Agent. This guide provides an example of installing the Monitoring Agent on each instance and monitoring specific instances.
- Estimated time: 30 minutes
- Recommended operating system: MacOS, Ubuntu, CentOS
- Prerequisites
Before you start
This tutorial is conducted in a 3-tier web service environment. To prepare the necessary environment, follow the steps in the Configure VM-based web service tutorial. In this process, you will set up an environment consisting of web, application, and database tiers step by step.
Getting started
This guide explains the full process of setting up an instance monitoring environment. You will learn how to install a monitoring agent, check monitoring information, configure Alert Center, integrate with Slack, and create notification policies to build a real-time alert system.
Step 1. Install monitoring agent
The monitoring agent allows you to set up metric and log-based policies to monitor the computing resource status and changes of instances in KakaoCloud. For more details, refer to Install monitoring agent.
-
Open a terminal in your local environment and execute the following command to establish an SSH connection.
chmod 400 ${PRIVATE_KEY}
ssh -i ${PRIVATE_KEY}.pem ubuntu@${BASTION_PUBLIC_IP}cautionIf a
bad permissionserror occurs due to key file permissions, add thesudocommand to resolve it.
Example:sudo ssh … -
Ensure that inbound traffic from Bastion is allowed to reach the WEB and WAS hosts. Verify the security group in the KakaoCloud console and ensure the following rule is included:
Inbound rule Protocol Source Port number web/app inbound policy TCP {bastion private ip}/3222 -
Access each host via SSH.
# web1
ssh -i ${PRIVATE_KEY}.pem ubuntu@${BASTION_PUBLIC_IP} -p 10000

# web2
ssh -i ${PRIVATE_KEY}.pem ubuntu@${BASTION_PUBLIC_IP} -p 10001

# app1
ssh -i ${PRIVATE_KEY}.pem ubuntu@${BASTION_PUBLIC_IP} -p 10002

# app2
ssh -i ${PRIVATE_KEY}.pem ubuntu@${BASTION_PUBLIC_IP} -p 10003 -
Change the instance timezone and download the monitoring agent.
- CentOS
- Ubuntu
# Change instance timezone
sudo timedatectl set-timezone Asia/Seoul

# Download monitoring agent
sudo yum localinstall ${Object Storage Endpoint}/v1/52867b7dc99d45fb808b5bc874cb5b79/kic-monitoring-agent/package/kic_monitor_agent-1.0.0.x86_64.rpm
# Change instance timezone
sudo timedatectl set-timezone Asia/Seoul
# Download monitoring agent
wget ${Object Storage Endpoint}/v1/52867b7dc99d45fb808b5bc874cb5b79/kic-monitoring-agent/package/kic_monitor_agent_1.0.0_amd64.deb
sudo dpkg -i kic_monitor_agent_1.0.0_amd64.debRegion Object Storage endpoint kr-central-2 https://objectstorage.kr-central-2.kakaocloud.comcautionIf a
dpkg/lockerror occurs, execute the following commands:sudo rm /var/lib/apt/lists/lock
sudo rm /var/cache/apt/archives/lock
sudo rm /var/lib/dpkg/lock*
sudo dpkg --configure -a
sudo apt update -
Modify the monitoring agent configuration file.
cat <<EOF | sudo tee /etc/default/kic_monitor_agent
KIC_MONITOR_ENDPOINT_URL=${Monitoring Endpoint}
KIC_MONITOR_AGENT_AUTH_APPLICATION_CREDENTIAL_ID="${Access Key ID}"
KIC_MONITOR_AGENT_AUTH_APPLICATION_CREDENTIAL_SECRET="${Secret Access Key}"
KIC_LOG_FILE_PATH="{Log file path}"

## Specify HTTP Proxy if the host cannot access the public network directly.
# HTTP_PROXY=http://proxy
# HTTPS_PROXY=https://proxy
# NO_PROXY=169.254.169.254
EOF
Region Monitoring endpoint kr-central-2 https://monitoring.kr-central-2.kakaocloud.com -
Restart the monitoring agent and verify its status.
# Restart the agent
sudo systemctl restart kic_monitor_agent

# Enable startup on boot
sudo systemctl enable kic_monitor_agent

# Verify agent status
sudo journalctl -u kic_monitor_agent -f
Step 2. Check monitoring information
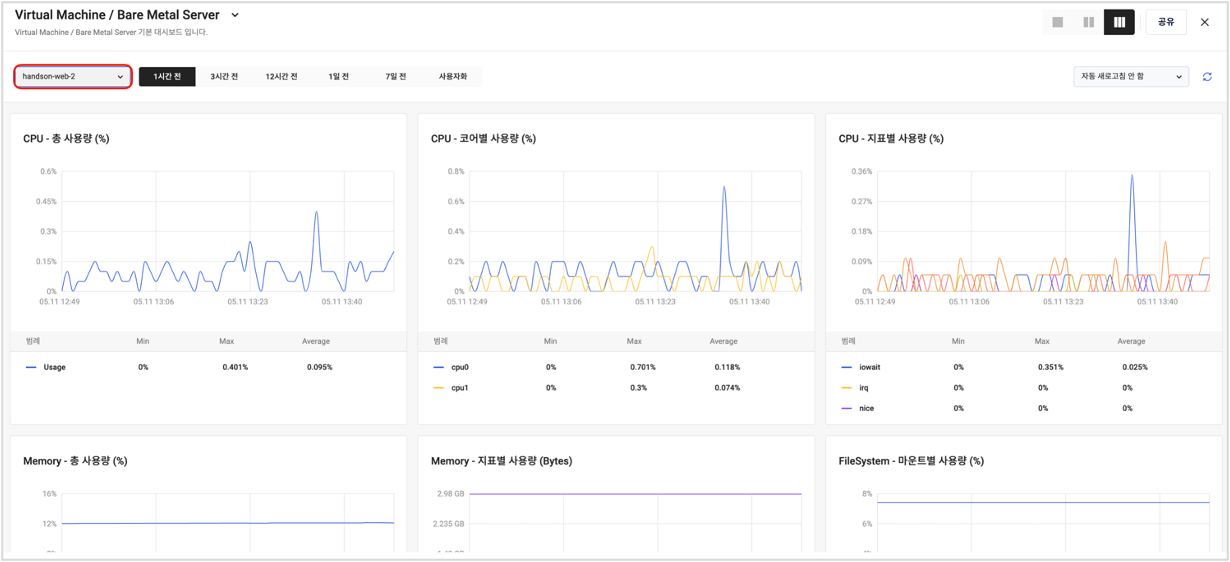
After installing the monitoring agent on an instance, you can view monitoring graphs showing the computing resource usage of that instance.
-
Go to KakaoCloud console > Management > Monitoring.
-
In the default dashboard area, select Beyond Compute Service.
-
Select the instance you want to monitor and check the monitoring graphs.
Step 3. Create notification channel in Alert Center
In KakaoCloud's Alert Center, you can create notification channels to receive alerts based on the resource risk levels.
-
Go to KakaoCloud console > Management > Alert Center > Notification Channel.
-
Select [Create notification channel].
-
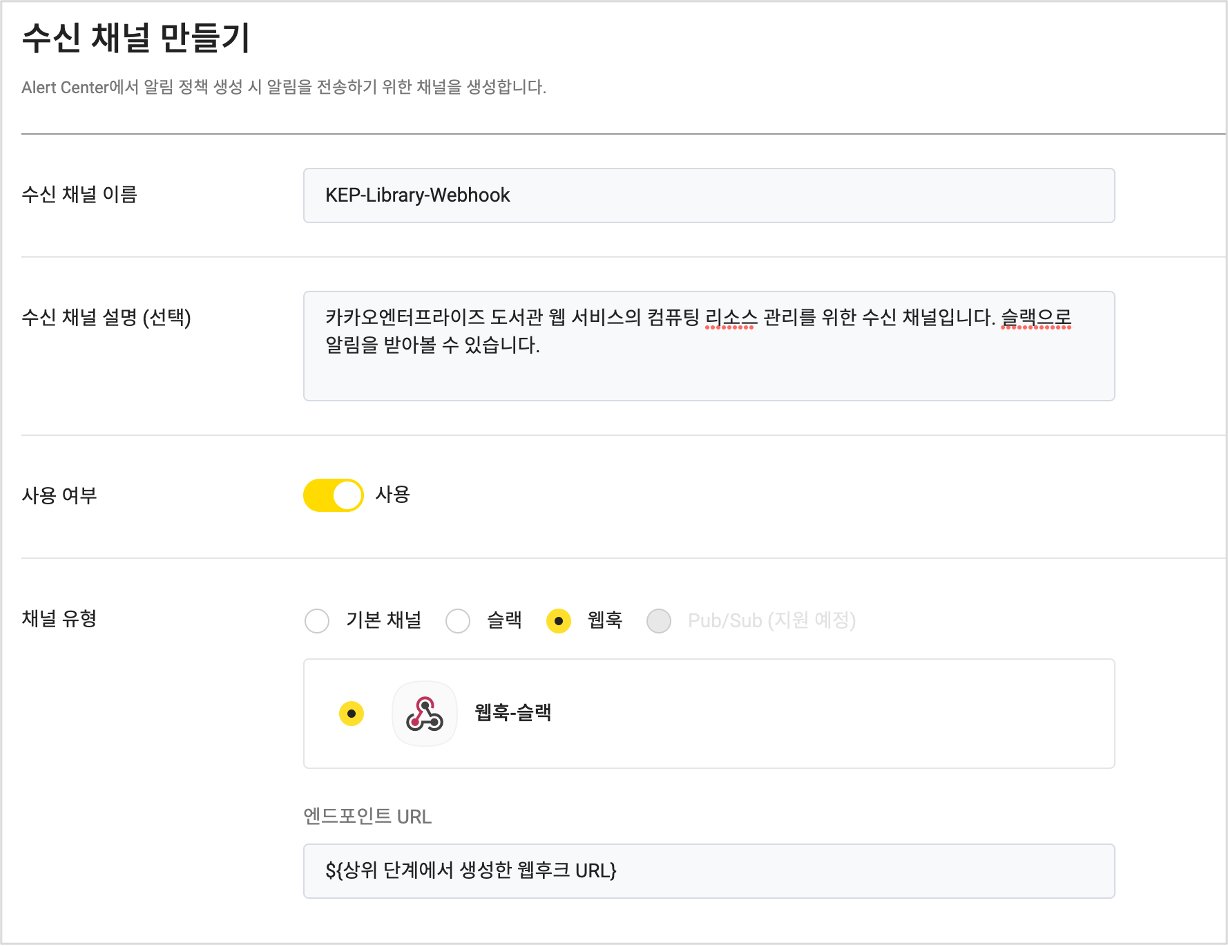
Enter the channel information, select the channel type, and select [Create].
Type Description Default channel Sends alerts via email, SMS, or KakaoTalk Slack/Webhook Sends alerts to a desired Slack channel via webhook
Step 4. Integrate Slack notification channel using webhook
-
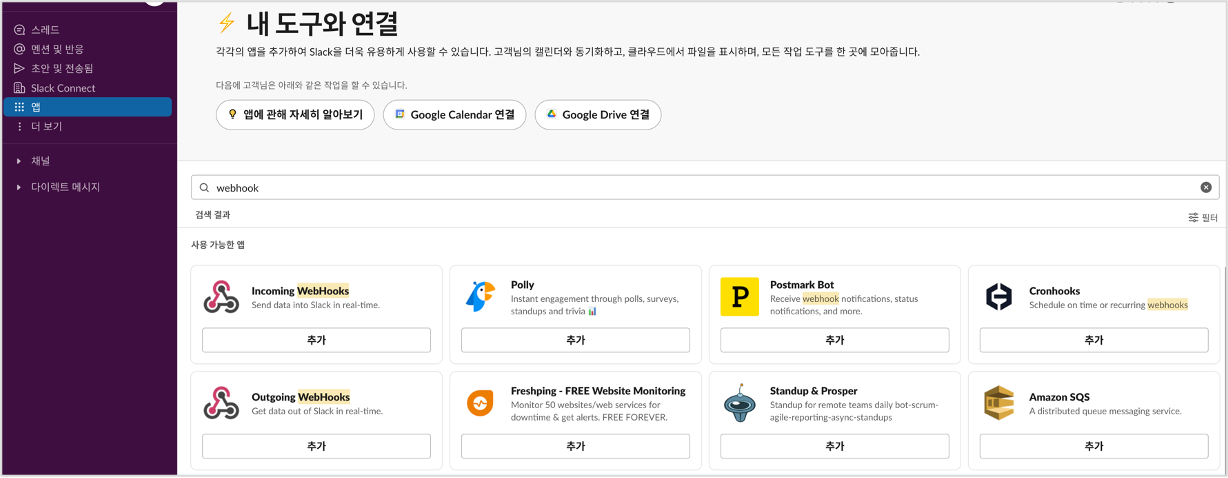
In your Slack application, go to the Apps tab and select [Add] under Incoming WebHooks.
-
Select [Add to Slack], select the channel where you want to receive alerts, and then select [Add Incoming WebHook Integration App].

Webhook-Slack notification channel creation -
Copy the generated webhook URL.
-
Go to KakaoCloud console > Management > Alert Center > Notification Channel > Create Notification Channel, and paste the copied webhook URL into the endpoint field.
-
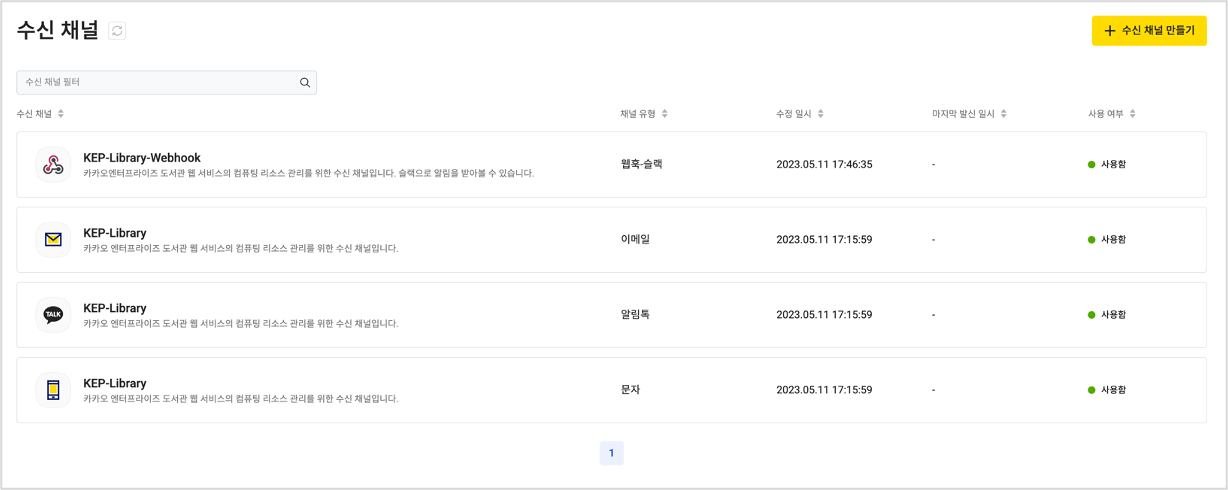
Verify the newly created notification channel.
Step 5. Create alert policy
In KakaoCloud's Alert Center, you can configure alert policies based on the risk levels of computing resources.
-
Go to Alert Center > Notification Channel and select [Create alert policy].
-
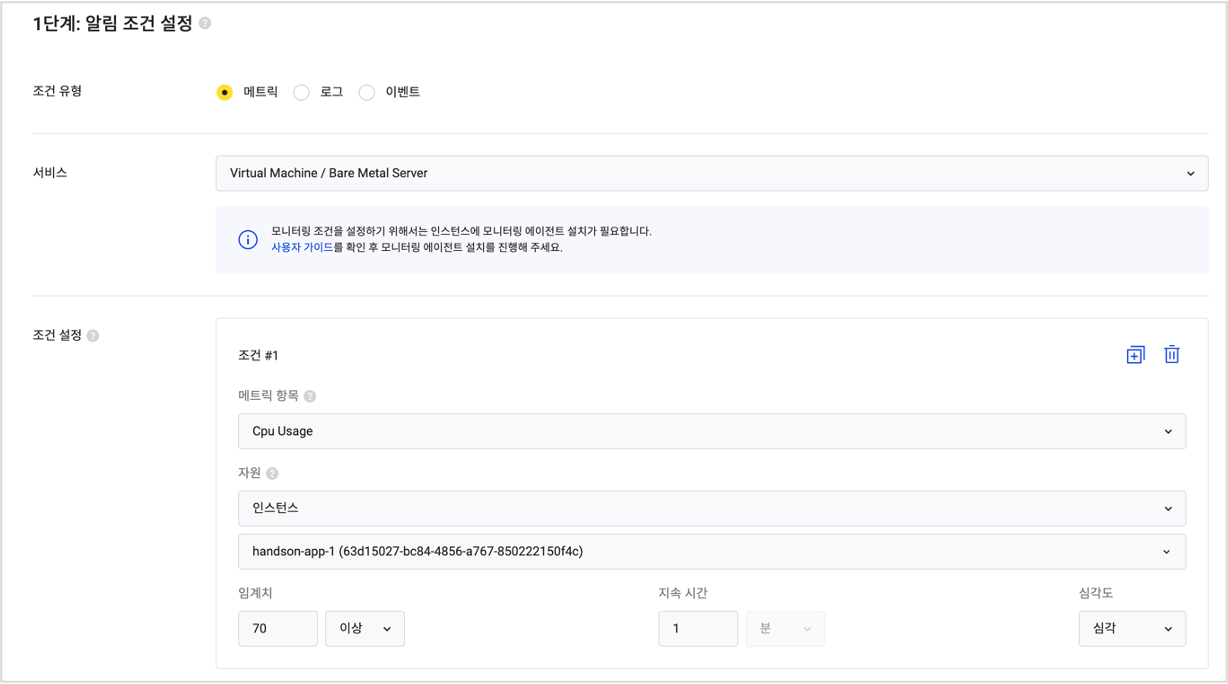
Set the necessary alert conditions.
-
Select the notification channel to receive alerts. You can choose an existing channel or create a new one.
-
Set a name for the alert policy, review the configuration, and select [Create] to finalize the alert policy.
-
Verify that alerts are successfully delivered to each notification channel when the specified metric conditions are met.