Monitor Hadoop Cluster with Monitoring Flow
This guide explains how to monitor the node status and connectivity of a Hadoop Eco cluster using KakaoCloud's Monitoring Flow.
- Estimated Time: 30 minutes
- Recommended OS: Ubuntu
- Prerequisites
Scenario Overview
In this scenario, we will demonstrate how to use various features of the Monitoring Flow service to monitor the node status of a Hadoop cluster. The main steps are as follows:
- Create a Hadoop cluster using KakaoCloud's Hadoop Eco
- Create a flow connection to link the subnet where the API server resides
- Create a scenario in Monitoring Flow to monitor the Hadoop cluster nodes
- Receive monitoring alerts through Alert Center integration
Before you start
Network Setup
To enable communication between the Monitoring Flow service and the Hadoop cluster, set up the network environment. Create a VPC and subnets as per the instructions below.
VPC and Subnet: tutorial
-
Go to KakaoCloud console > Networking > VPC.
-
Select the [+ Create VPC] button and set it up as follows:
Category Item Settings/Values VPC Information VPC Name tutorial VPC IP CIDR Block 10.0.0.0/16 Availability Zone Number of Availability Zones 1 First AZ kr-central-2-a Subnet Settings Number of Public Subnets per Availability Zone 1 kr-central-2-a Public Subnet IPv4 CIDR Block: 10.0.0.0/20
-
After confirming the generated topology, select the [Create] button.
- The subnet status will change from
Pending Create>Pending Update>Active. Once it becomesActive, proceed to the next step.
- The subnet status will change from
Getting started
This section guides you through the steps to monitor a Hadoop cluster using Monitoring Flow.
Step 1. Create a Hadoop Eco Cluster
Create a Hadoop Eco cluster to set up the environment for Monitoring Flow monitoring.
-
Go to KakaoCloud console > Analytics > Hadoop Eco > Cluster.
-
If no cluster exists, refer to the Cluster Creation guide to create a cluster.
- In the VPC Settings section, choose the VPC and subnet to connect to the flow connection.
- In the Security Group Configuration section, choose to [Create a new security group], which will automatically set the inbound and outbound policies for Hadoop Eco. The created security group can be found under VPC > Security.
-
Verify the information of the created cluster.
- The cluster is successfully created when its status changes to
Running. - Find the Cluster ID, which is required for the Monitoring Flow step configuration.
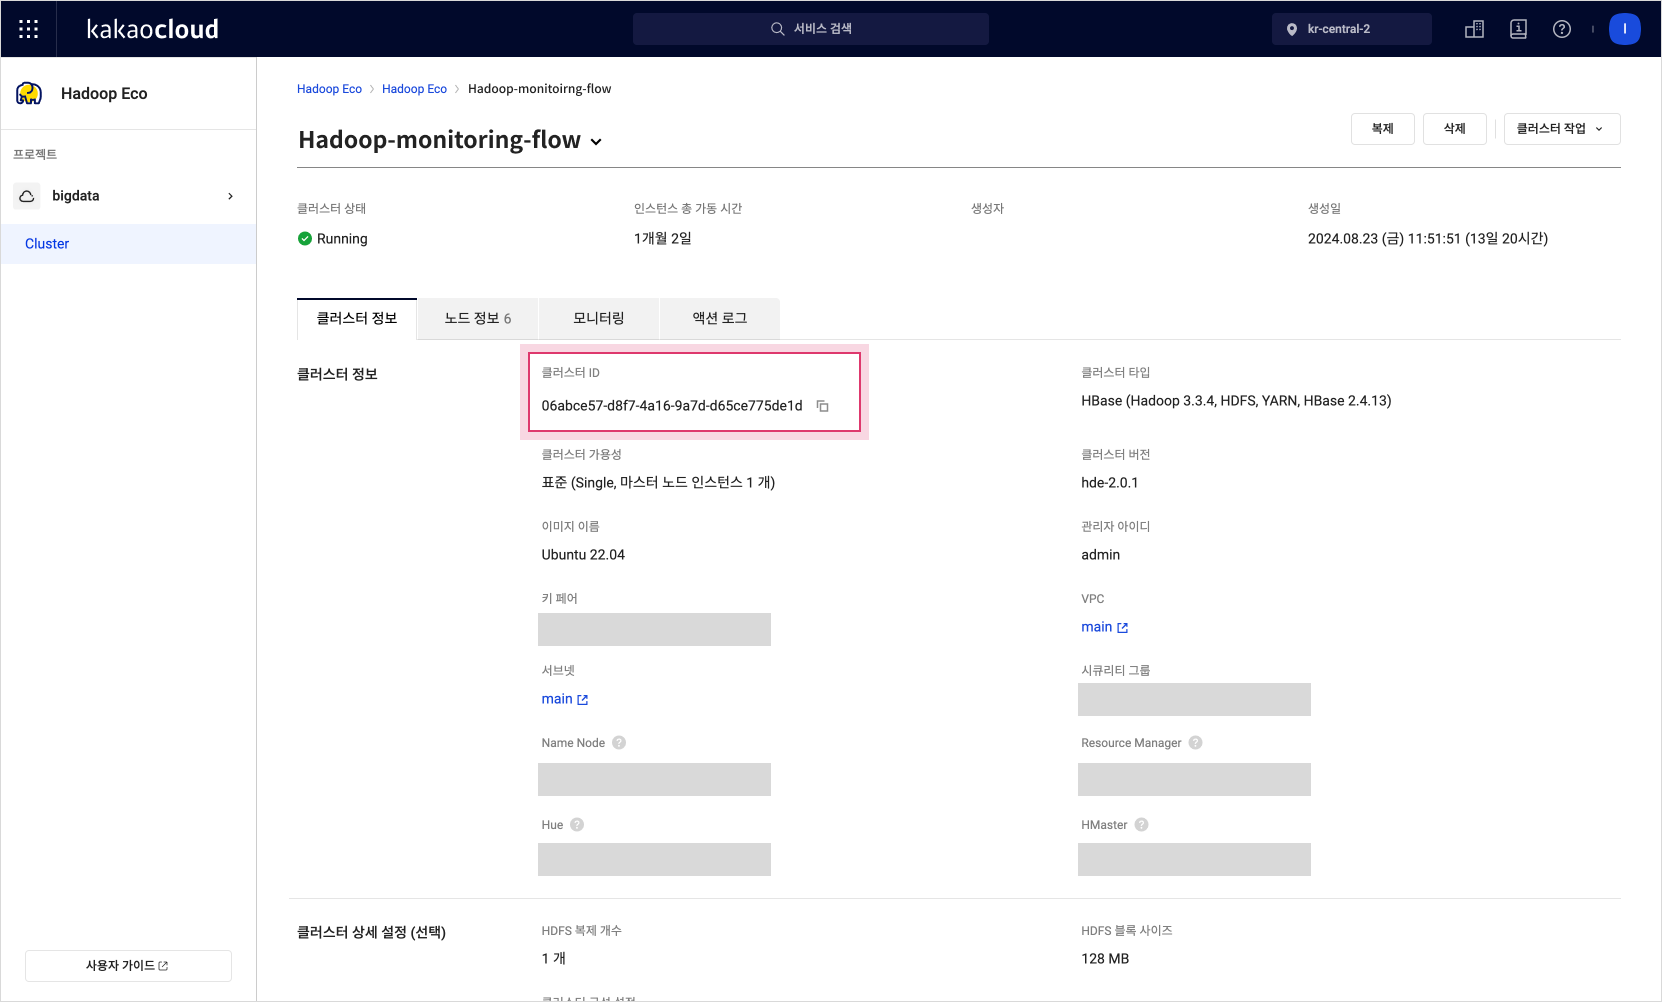 Cluster Details
 - The cluster is successfully created when its status changes to
Step 2. Create a Flow Connection
Create a flow connection in the Monitoring Flow service to allow access to the cluster.
-
Go to KakaoCloud console > Management > Monitoring Flow > Flow Connections.
-
Select the [Create Flow Connection] button to enter the creation screen.
-
In the VPC Selection section, select the activated VPC registered in the security group.
-
Choose the subnet connected to the VPC to link with the flow connection.
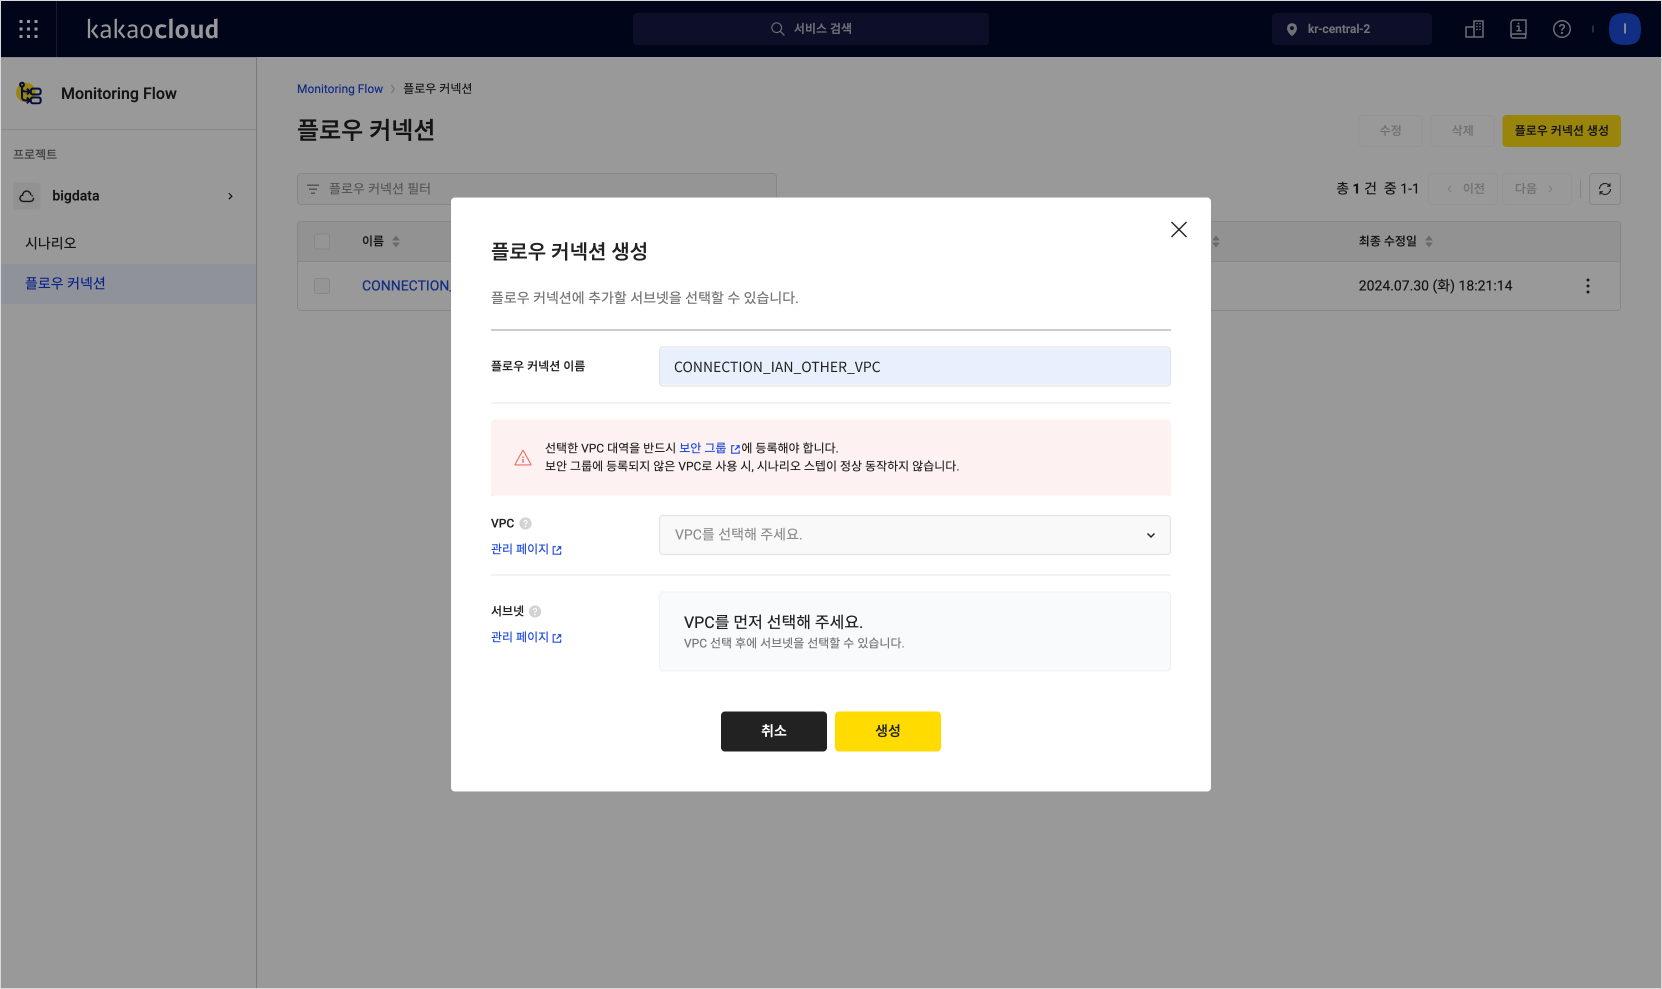 Create Flow Connection
Step 3. Create a Scenario
Create a scenario in Monitoring Flow to monitor the status of the Hadoop cluster and set the execution schedule.
-
Go to KakaoCloud console > Management > Monitoring Flow > Scenarios.
-
Select the [Create Scenario] button to enter the creation screen.
-
Select the Use KakaoCloud VPC option to access KakaoCloud internal resources.
-
Choose one of the registered flow connections.
-
Set the execution schedule for the scenario.
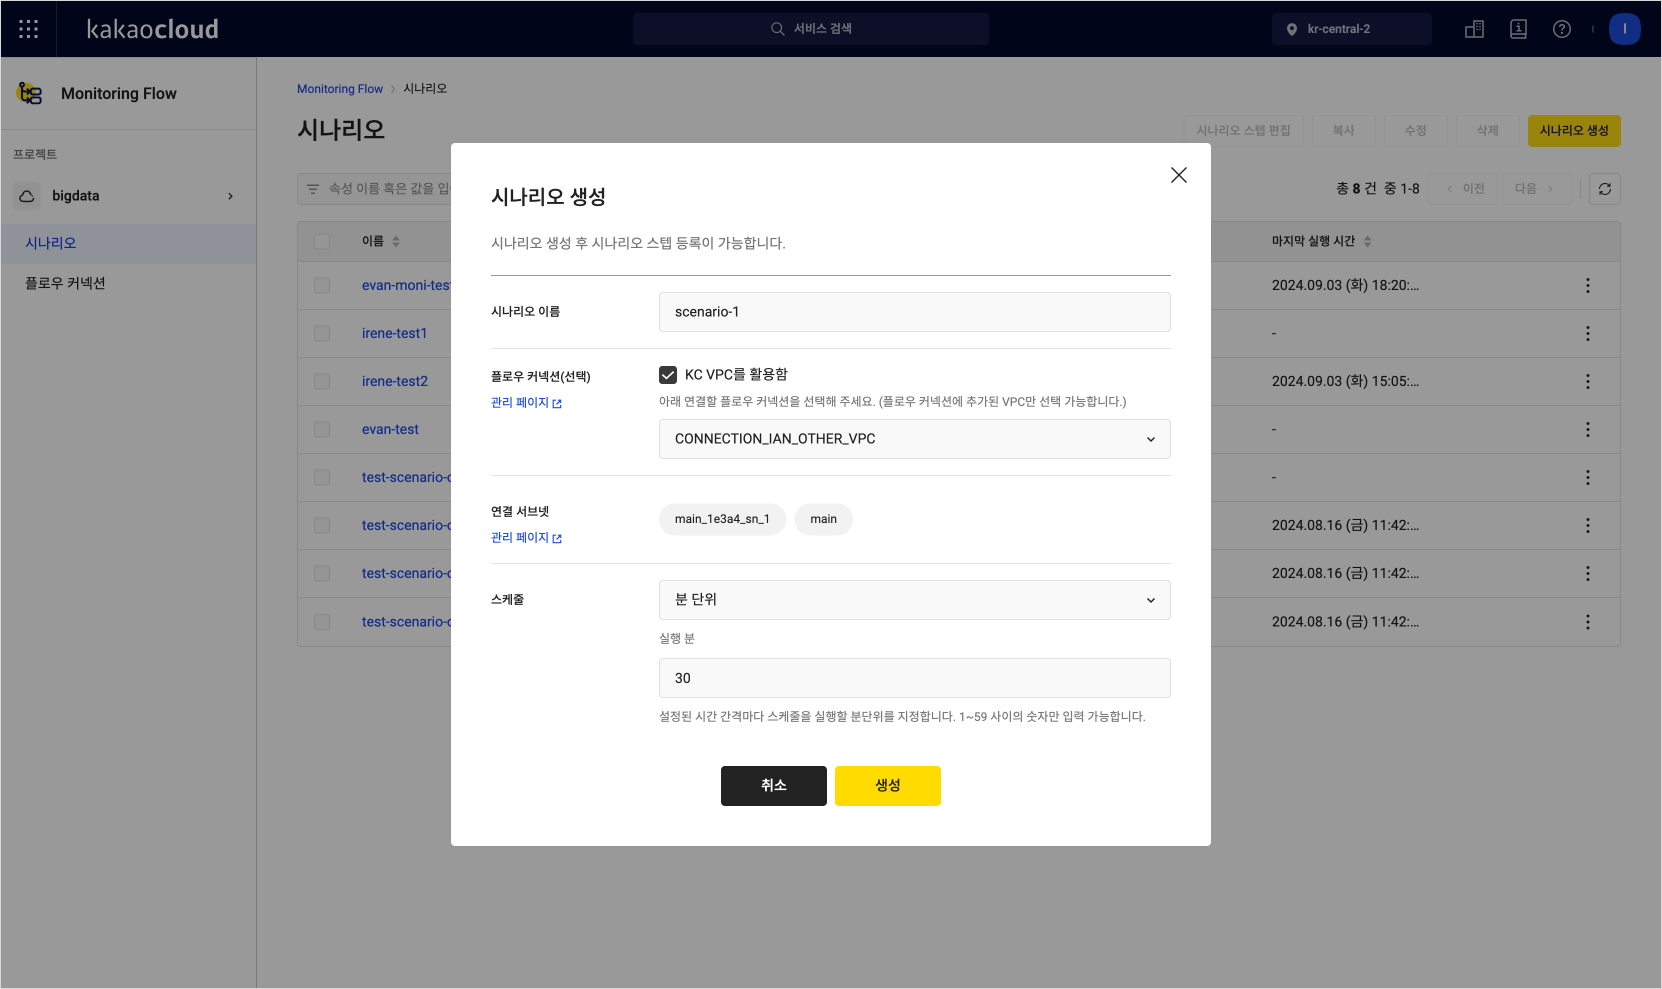 Create Scenario
Step 4. Add Scenario Steps
Use steps such as Default Variable, API, Set Variables, For, and If to build the monitoring flow in Monitoring Flow.
- Go to KakaoCloud console > Management > Monitoring Flow > Scenarios.
- In the Scenario menu, select on the name of the created scenario and review the details.
1. Manage Default Variables
The Default Variable step defines basic variables necessary for the scenario, which will be used repeatedly. Default Variables must be set before creating any steps.
In this tutorial, we'll register the Default Variables as follows:
-
On the selected scenario's detail page, select the [Edit Scenario Steps] button at the top right.
-
Select the [Manage Default Variables] button at the top right to register the Default Variables.
-
Fill out the table with the following values. Please input all values for this tutorial.
Item Key Type Value Description 1 vm-ip String The vm-ipvariable is used to store the IP address of a specific virtual machine.2 vm-list JSON List []3 vm-status string 4 vm-is-master string false Set the initial value of the vm-is-mastervariable to false to define its default state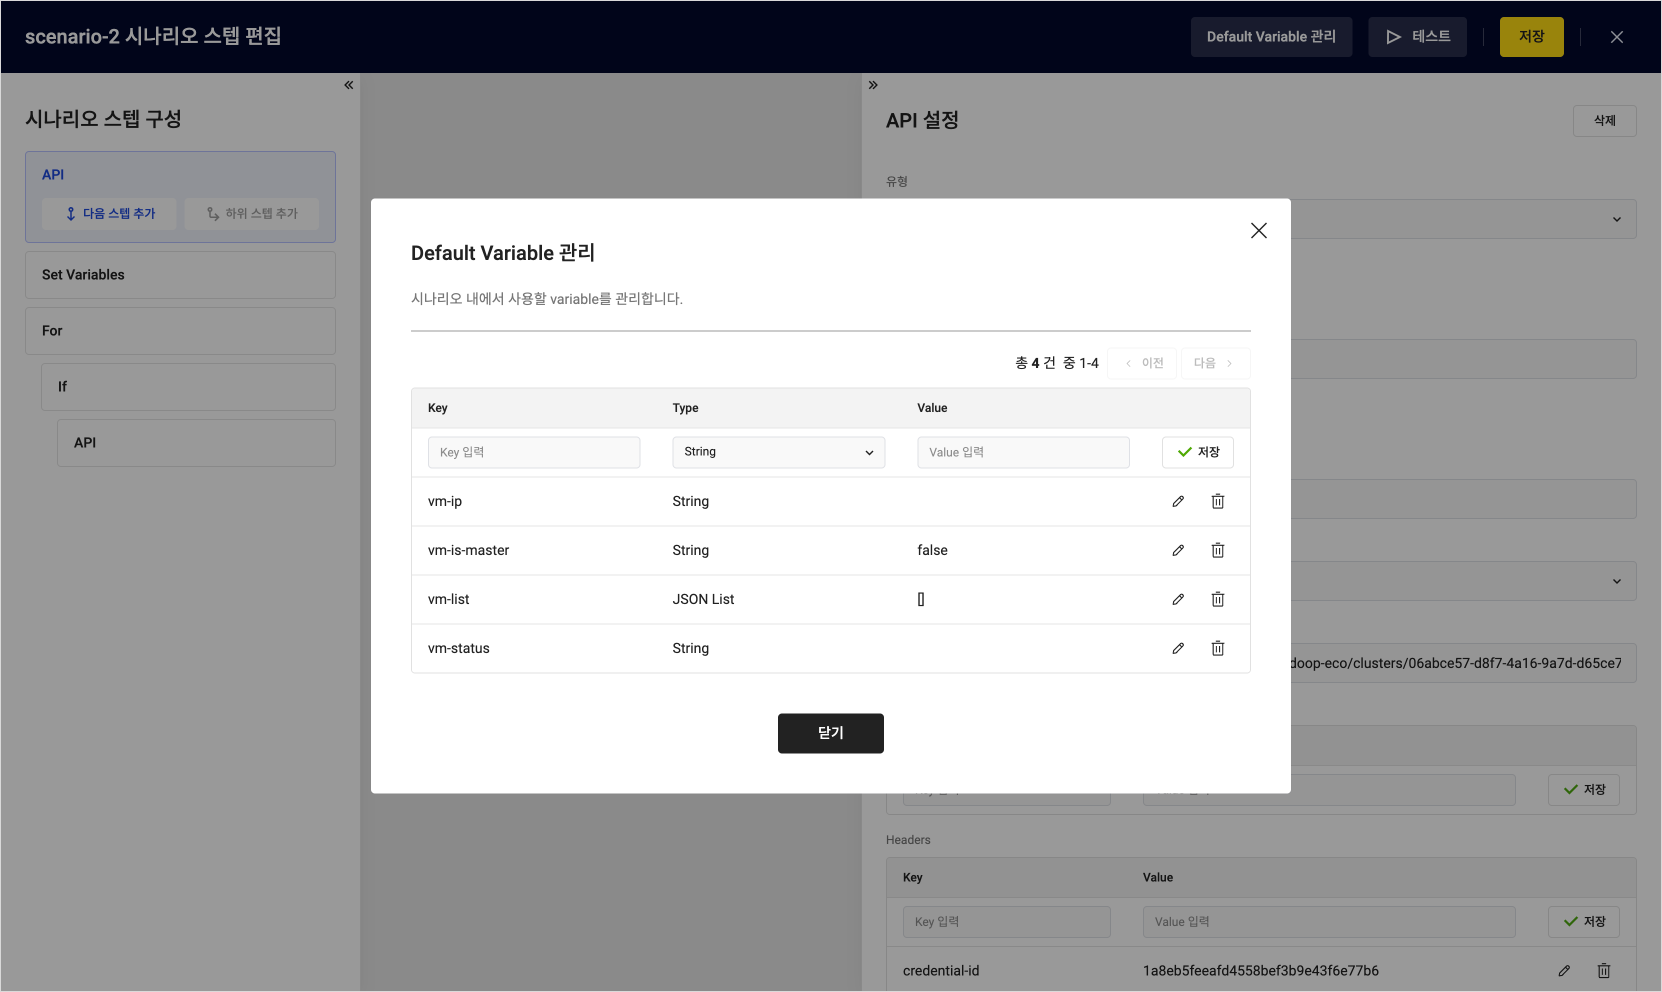 Manage Default Variables
 -
After saving, select the [Close] button.
2. API-1
Add a step to check the status of the Hadoop cluster's API server.
- In the Scenario Details tab, select the [Add Scenario Step] button.
- In the New Step Settings panel, select
APIas the step type. - Fill out the fields according to the following table.
| Item | Example | Description |
|---|---|---|
| Type | API | Select API |
| Step Name | API-1 | Step name |
| Expected Code | 200 | The server should return a 200 status code to indicate that it is functioning normally |
| Method | GET | Use an HTTP GET request to check the status of the API server |
| URL | http://${Private-IP} | API URL (use the private IP of the cluster node) |
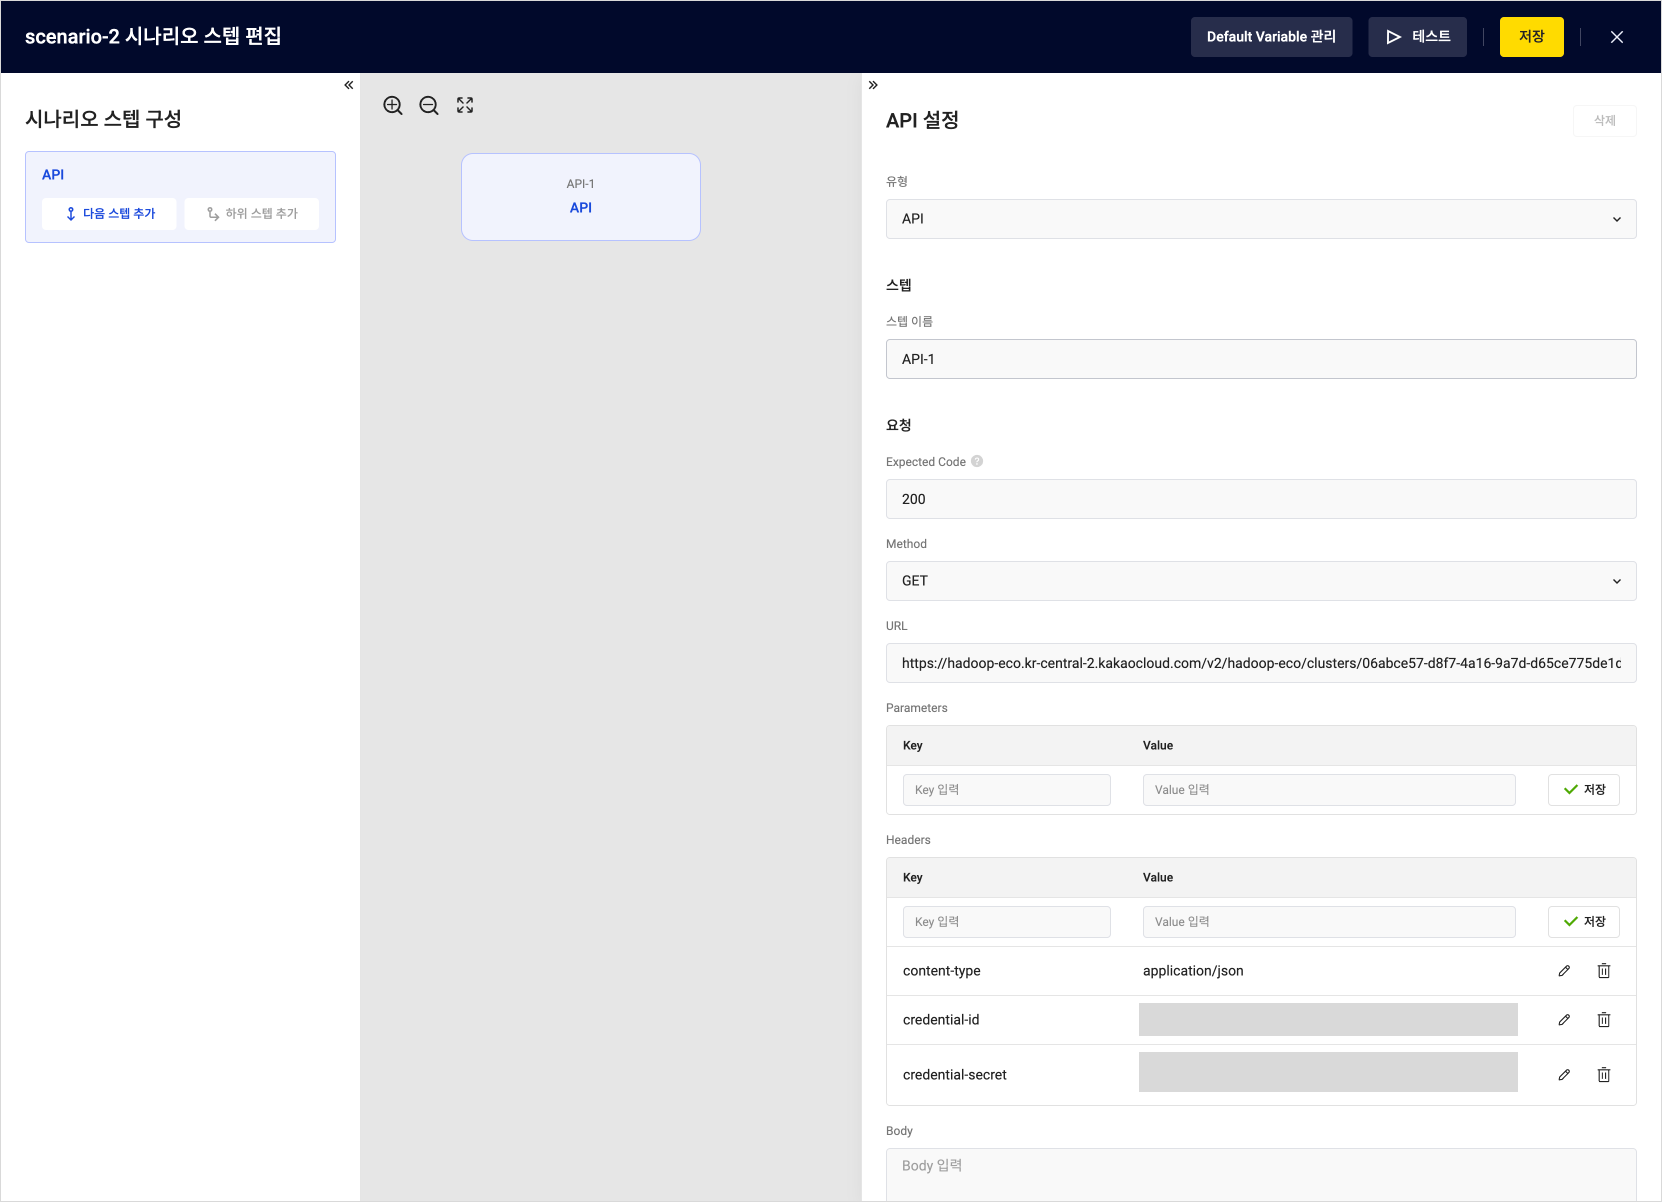 Add API step-1
- After entering all the required fields, select Add Next Step on the left panel.
3. Set Variables
The Set Variables step is where you update existing variables or set new values. In this step, you will use API response data to set variable values.
- In the Set New Step section of the right panel on the scenario step screen, select Set Variables as the step type.
- Enter the fields according to the following table:
| Field | Example | Description |
|---|---|---|
| Type | Set Variables | Select Set Variables |
| Step Name | Variables-1 | Name to assign to the step |
| Variable | ${vm-list} | Choose one from the Default Variable list |
| Step API | API-1 | Select the API step stored in the previous step |
| Step Request/Response | request | Choose between request or response |
| Step Component | body | Choose parameters, headers, or body based on the request/response |
| Key | content | Enter or select the value of the selected request/response result |
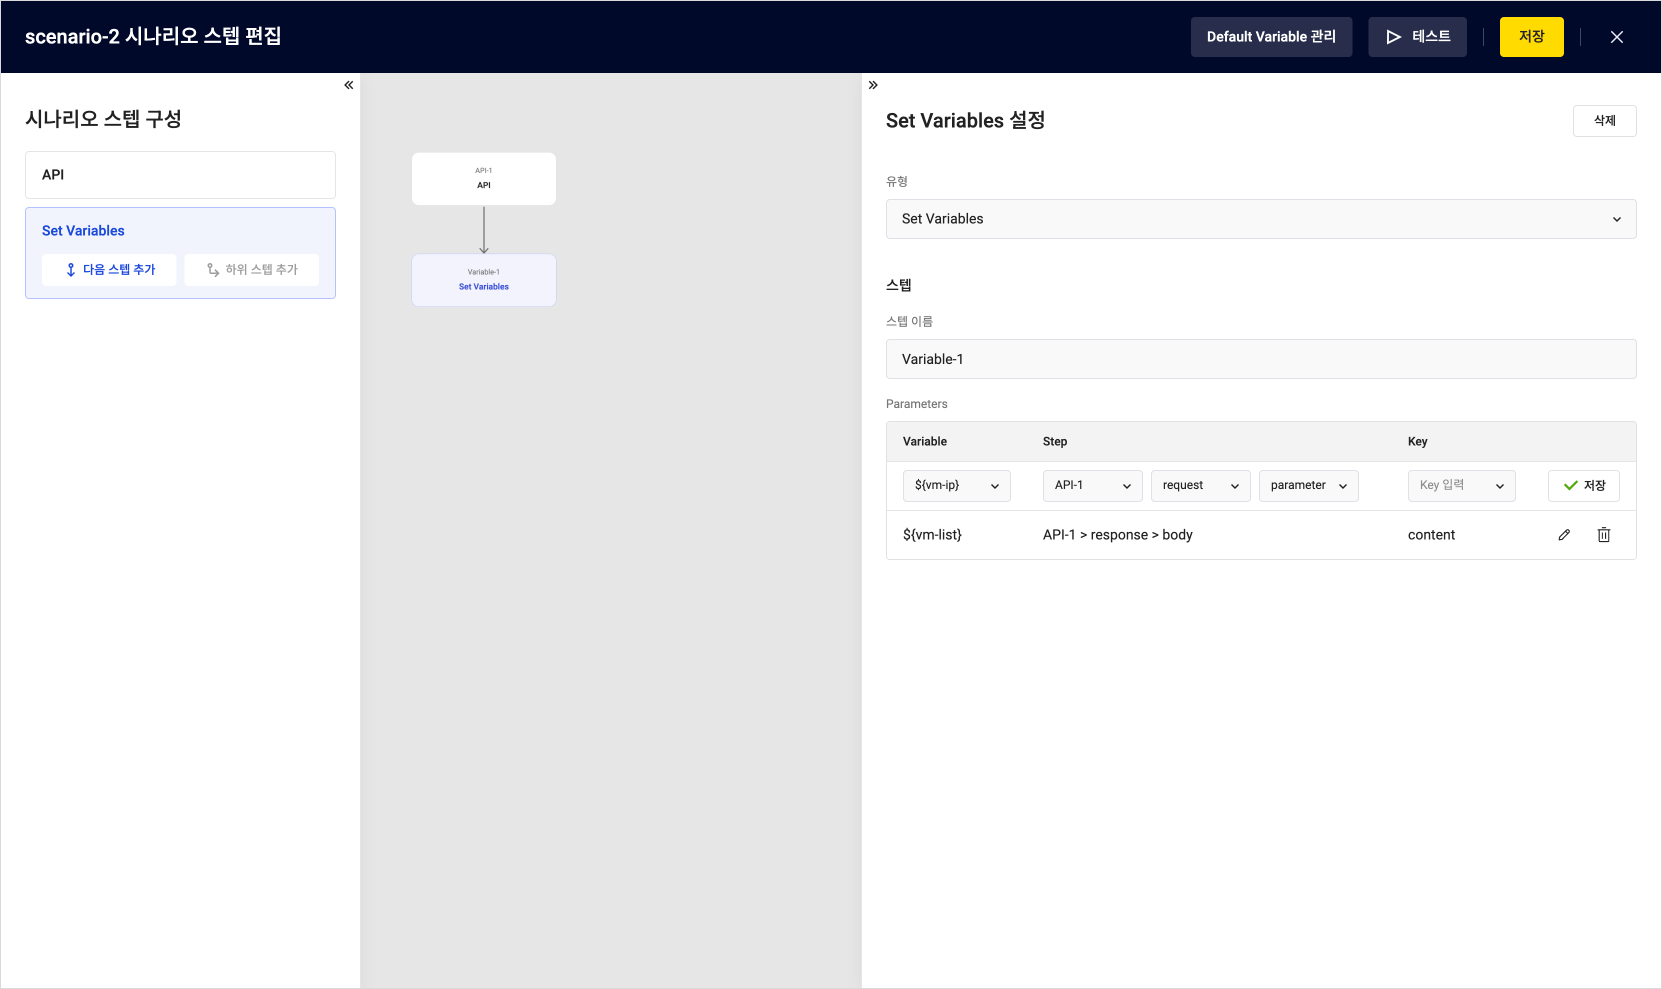 Add Set Variables Step
- After entering all the required fields, select [Add Sub Step] on the left panel.
4. For
The For step is used to perform repetitive tasks, allowing you to repeat actions for each item in a variable list. In this step, monitoring tasks are performed repeatedly for all nodes within a cluster.
-
In the Set New Step section of the right panel on the scenario step screen, select For as the step type.
-
Enter the fields according to the following table:
Field Example 1 Example 2 Example 3 Description Type For Select For Step Name For-1 Name to assign to the step Type foreach Specify the repetition format, either countorforeachBase Variable ${vm-list}Specify the list of variables to repeat
- Choose a JSON list to iterate over each elementMarker Variable ${vm-ip}${vm-status}${vm-is-master}Use this variable to reference specific elements during the repetition Marker Value marker.ip marker.status marker.ismaster Specify the location of the data to be referenced
- Themarkervalue updates every iteration, and the task is executed for each element in the list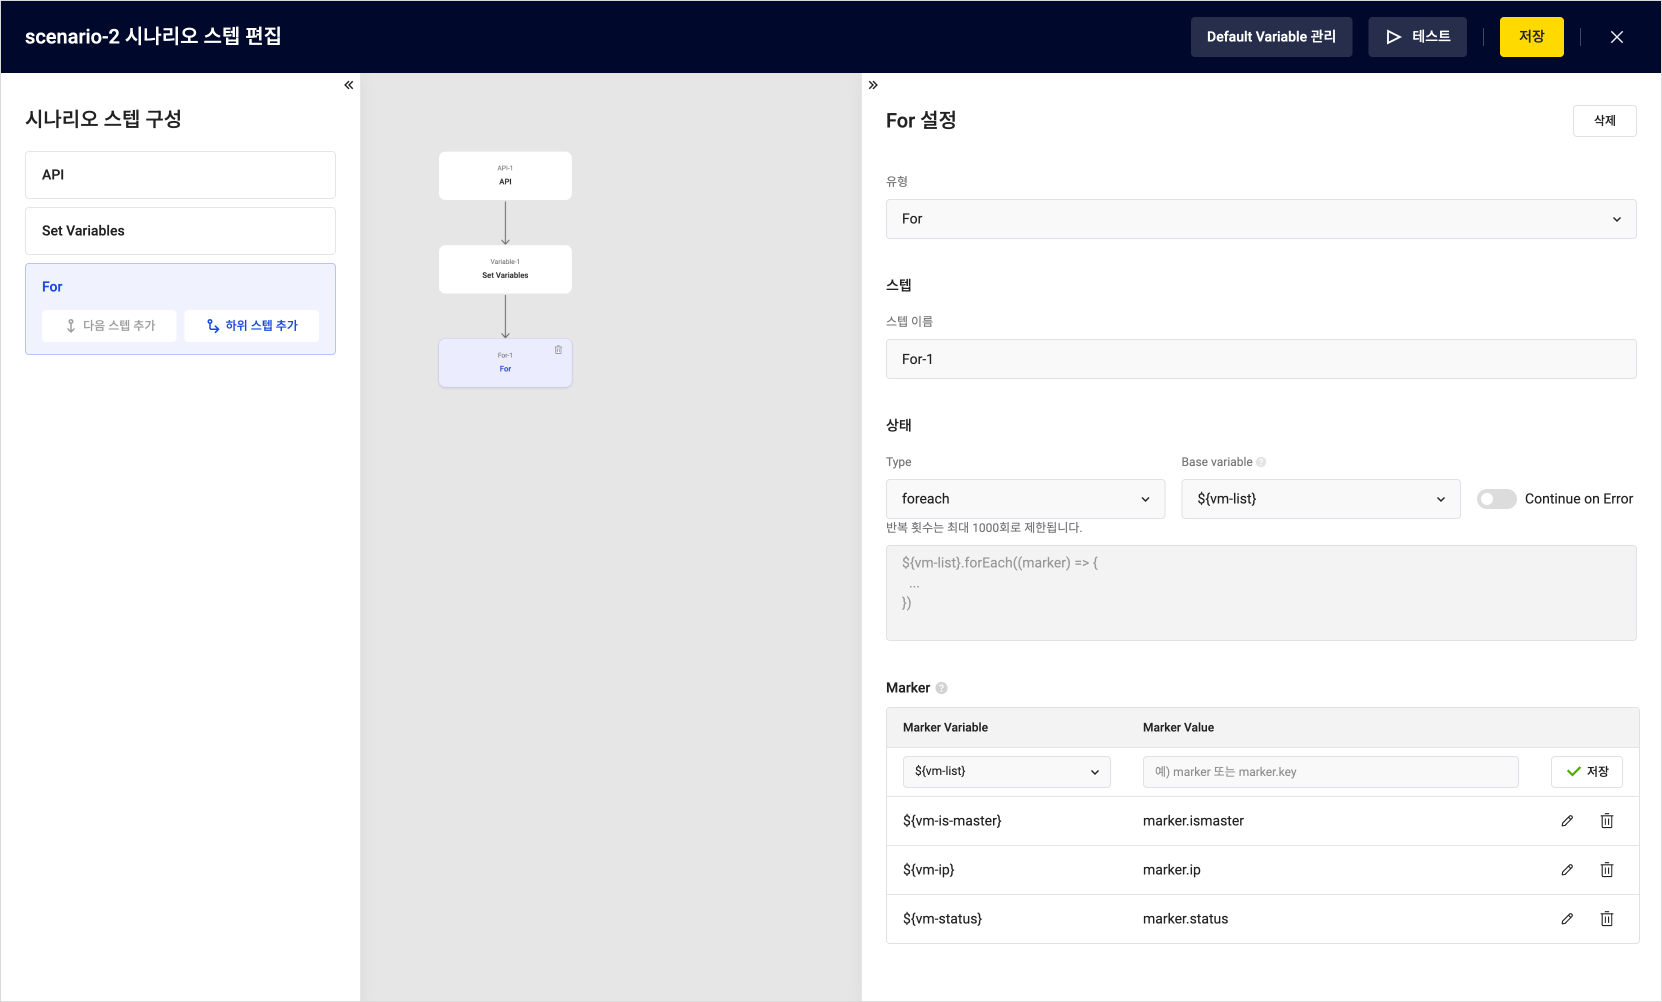 Add For Step
 -
After entering all the required fields, select [Add Sub Step] on the left panel.
Sub steps must be added for both For and If steps.
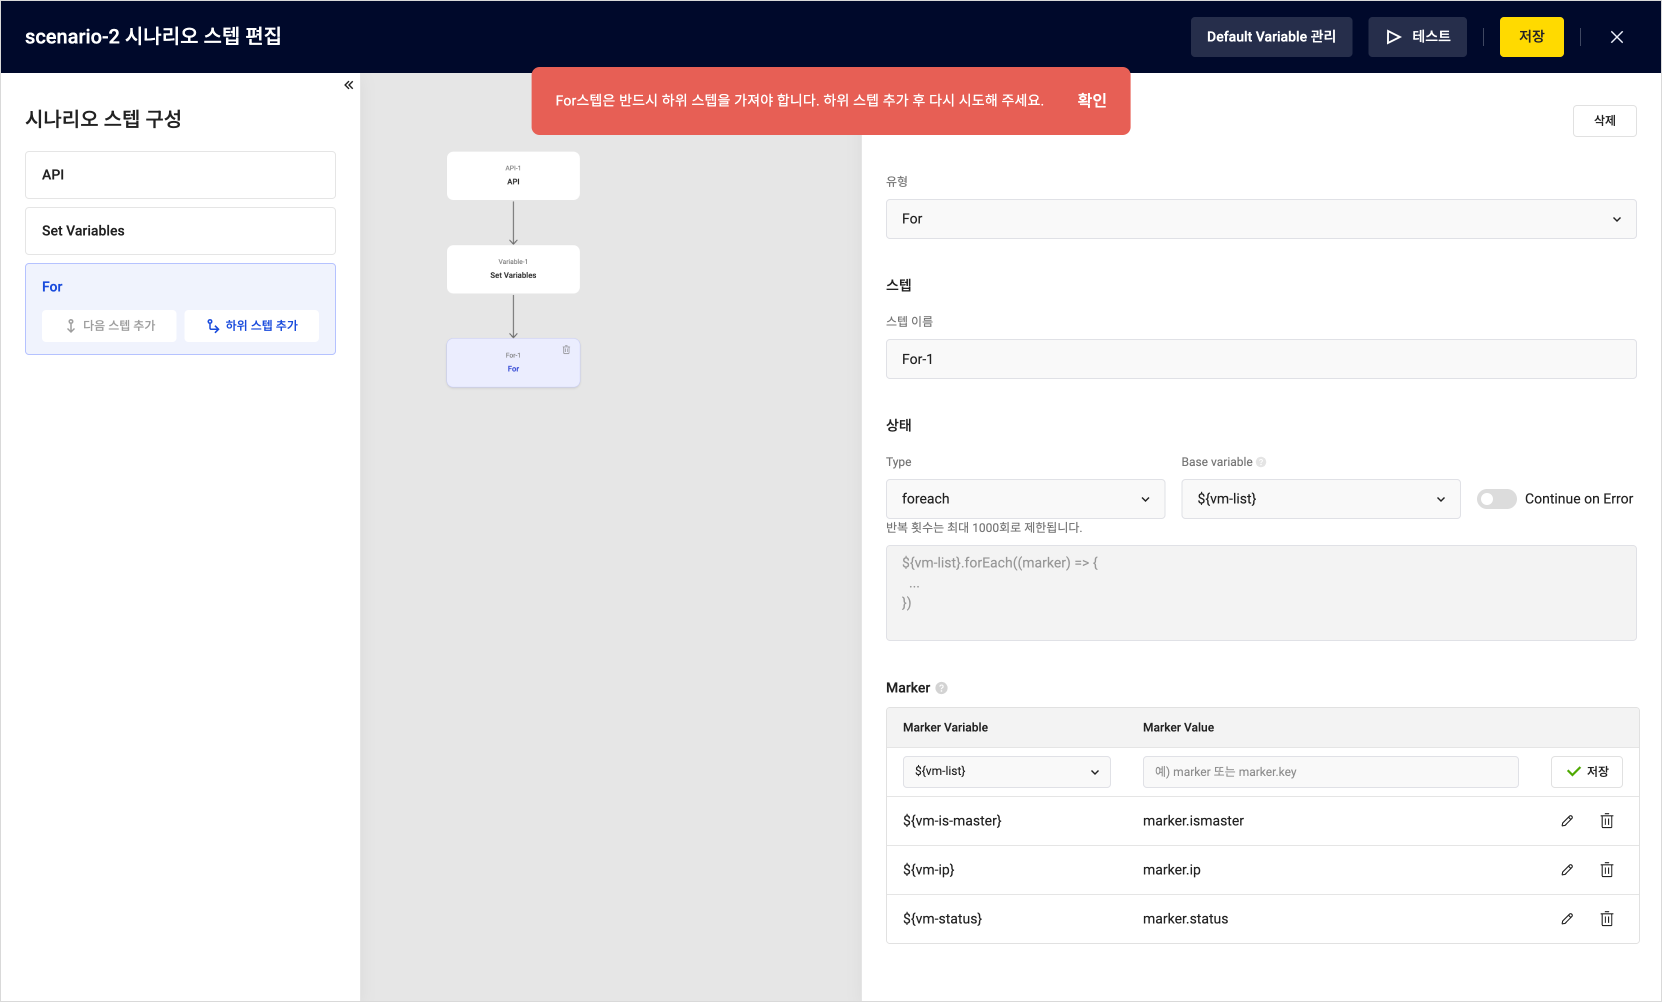 Message guiding the addition of sub steps for For step
5. If
The If step determines whether to perform an action based on a specific condition. In this step, you use an If condition to send a notification if the status of a specific node is abnormal.
- In the Set New Step section of the right panel on the scenario step screen, select If as the step type.
- Enter the fields according to the following table:
| Field | Example 1 | Example 2 | Description |
|---|---|---|---|
| Type | If | Select If | |
| Logical | and | Choose the condition combination method, either and or or | |
| Left Operand | ${vm-status} | ${vm-is-master} | Enter the condition for the operation - Input a variable |
| Comparison | == | == | Choose the comparison operator |
| Right Operand | Running | false | Enter the comparison value - Be mindful of case sensitivity for accurate values |
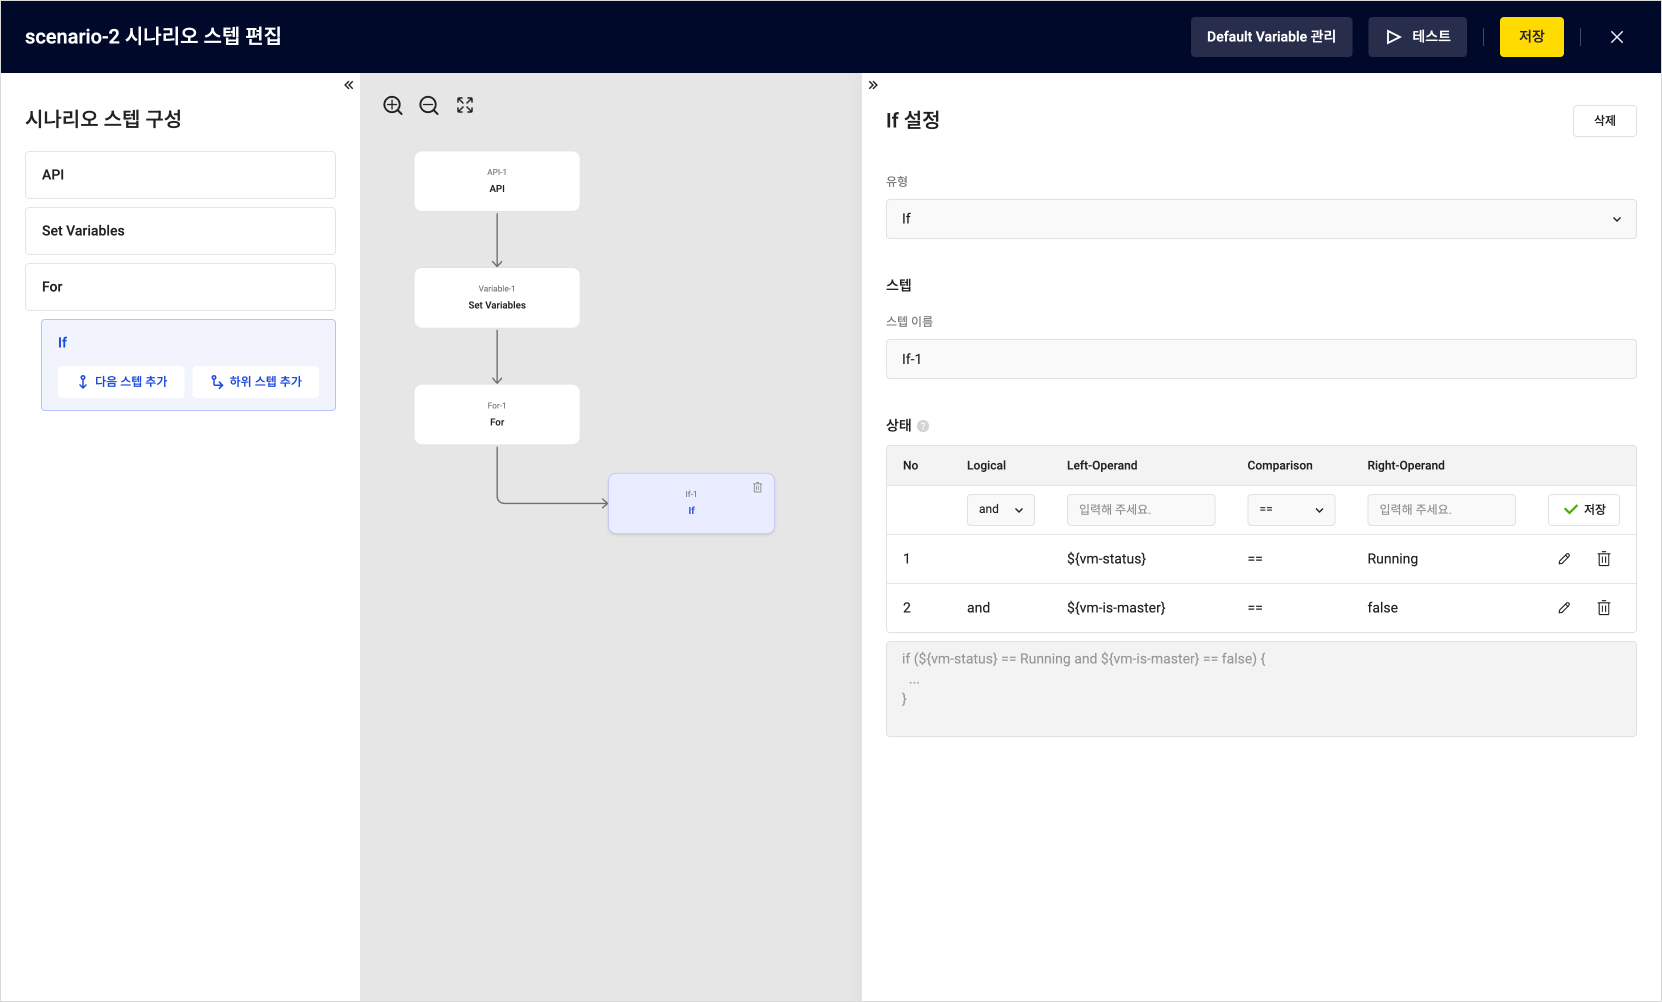 Add API Step-2
- After entering all the required fields, select [Add Sub Step] on the left panel.
6. API-2
API step is added to check the status of the API server.
- Select the [Add Scenario Step] button in the Details tab of the scenario.
- In the Set New Step section of the right panel, set the step type to API.
- Enter the fields according to the following table:
| Field | Example | Description |
|---|---|---|
| Type | API | Select API |
| Step Name | API-2 | Name to assign to the step |
| Expected Code | 200 | A 200 status code must be returned for the server to be considered operational |
| Method | GET | Use the HTTP GET request to check the API server's status |
| URL | http://${vm-ip}:7001/v1/agent/health | URL to access the API |
- Note:
${vm-ip}represents the API server's IP address, which should be replaced with the actual IP address of the server you want to configure.
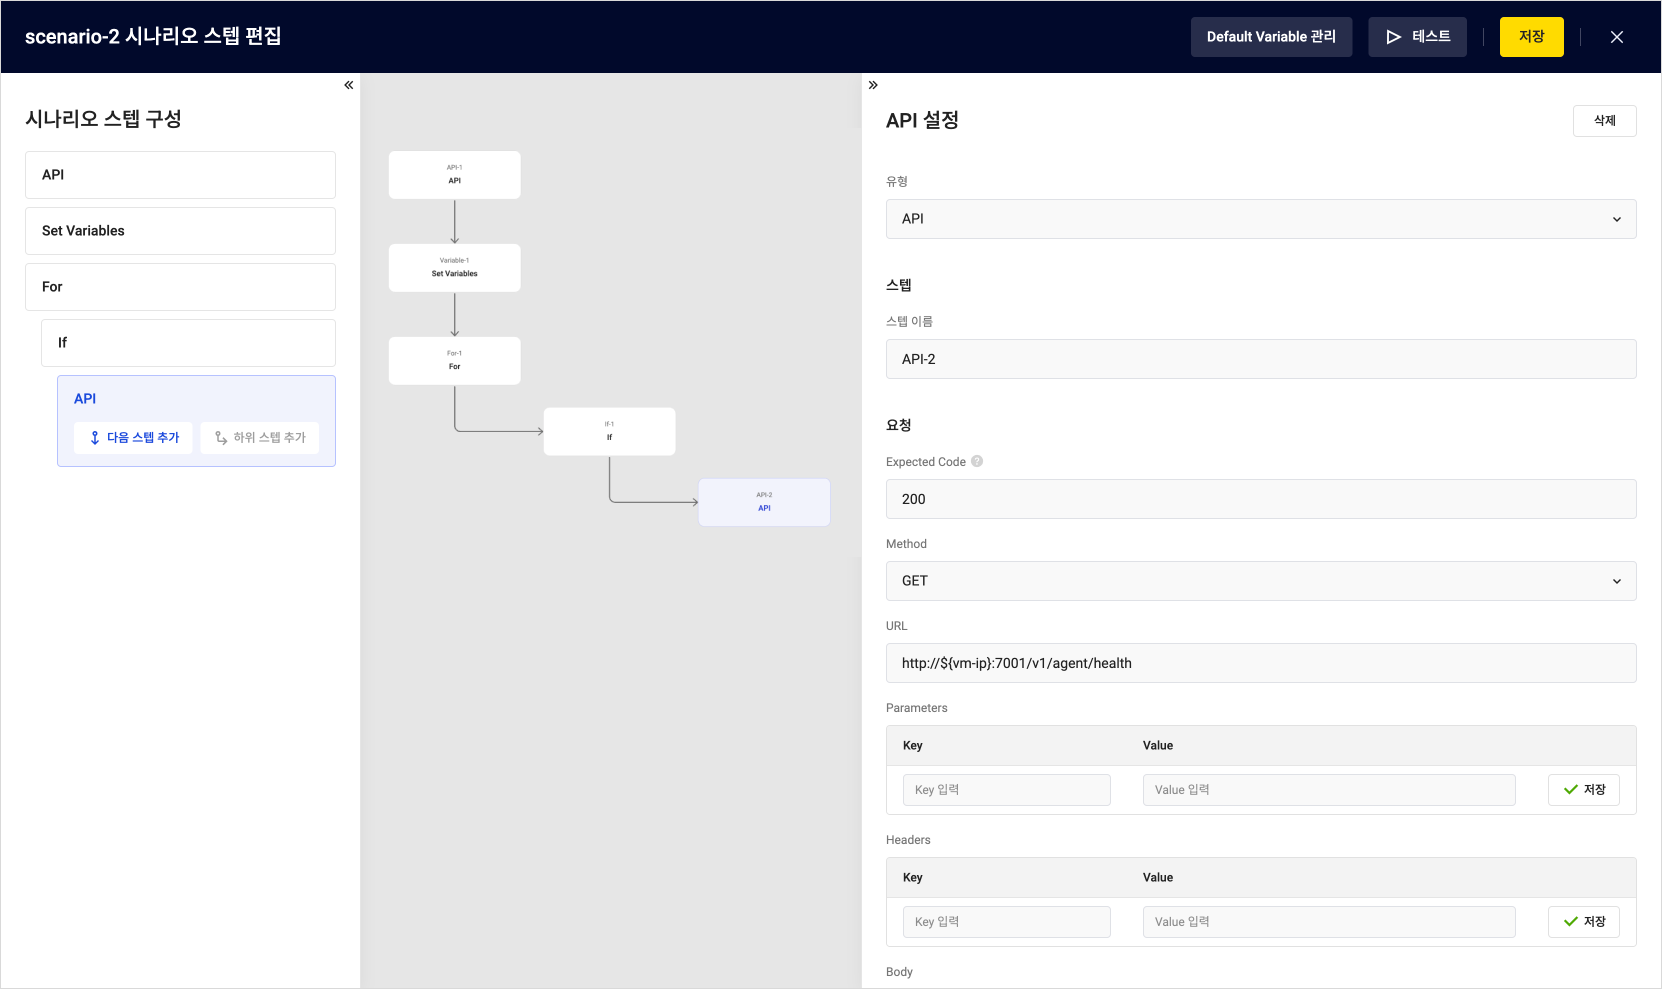 Create Flow Connection
- After entering all the required fields, select the [Test] button at the top-right corner to run the test.
Step 5. Test the Scenario
Check the results of the scenario test execution. If the 200 response is returned from the set URL during the test in Step 4, the API server is operating normally. If an unexpected response code is returned, it indicates an issue with the server status, and errors can be diagnosed.
- If the test runs successfully, Success will appear under [Execution Results].
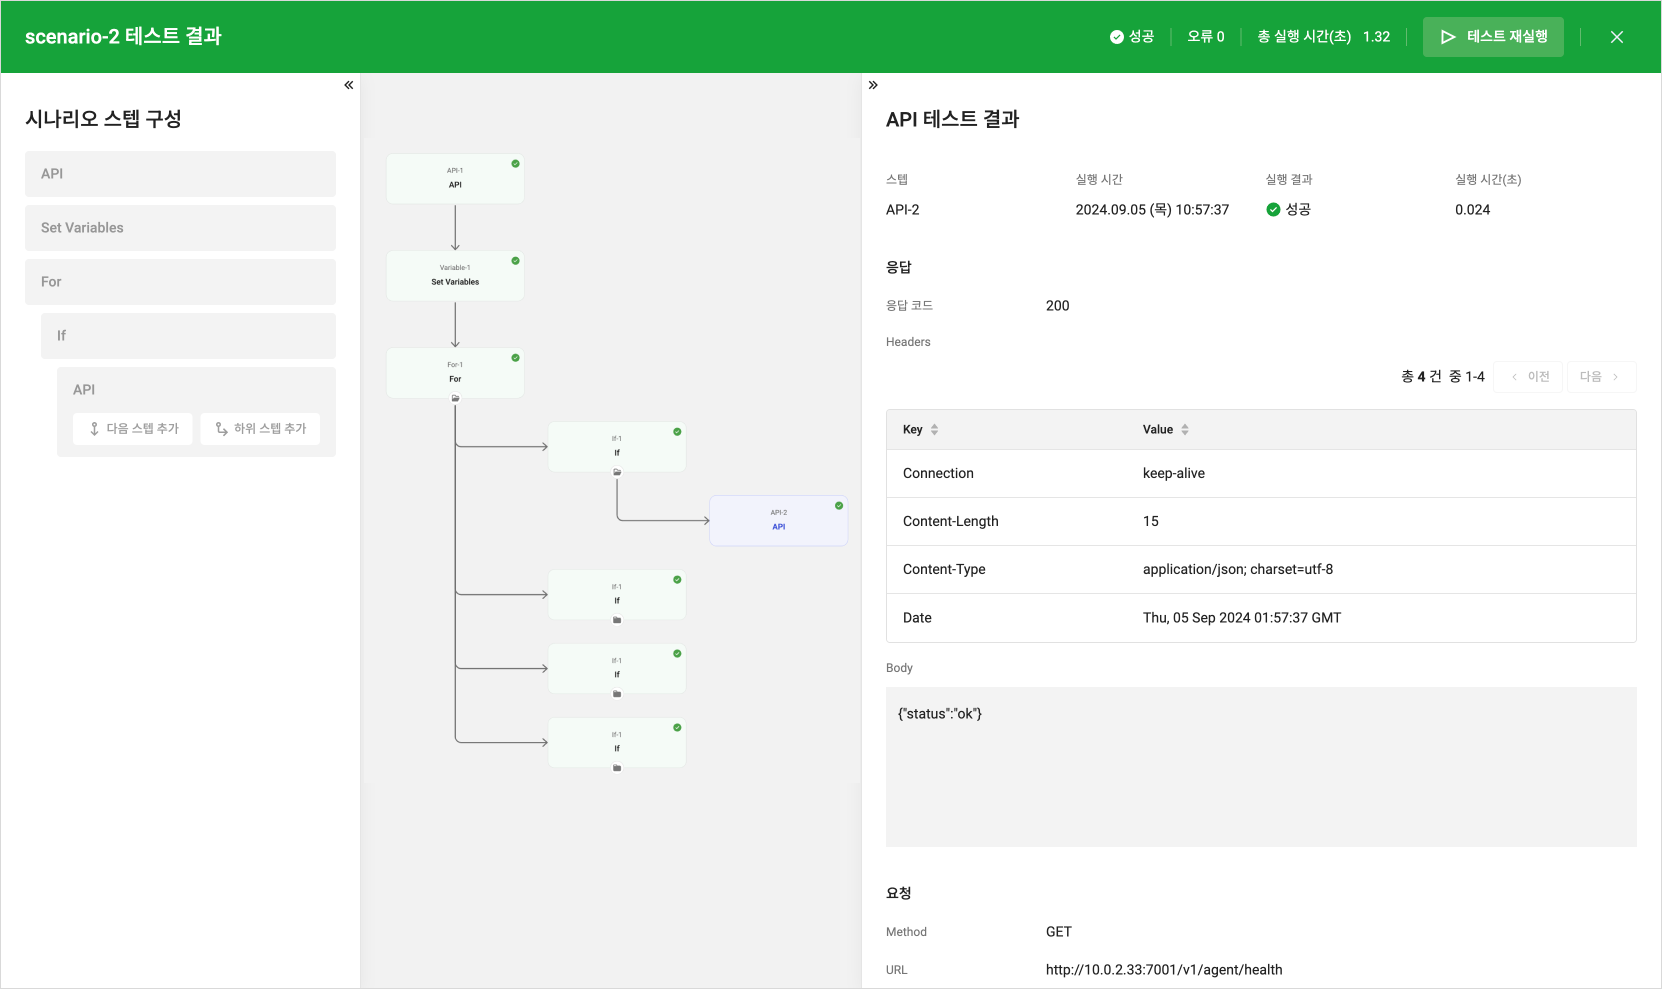 Test Success Result
-
If an unexpected response code is returned, it will show as Failure, indicating a potential issue with the server status. At this point, you can view the error details at the bottom of the right panel to resolve the issue.
caution- If accessing a deactivated instance, a call failure error may occur, so ensure that the correct IP address is entered.
-
After closing the test screen, save the scenario in the Edit Scenario Step screen. The saved scenario will be automatically executed according to the configured schedule.
Step 6. Check Execution Results
Check the execution results and time of the scenario to evaluate whether it is functioning correctly. You can verify whether the scenario was completed without errors through the detailed information.
- In the KakaoCloud console, go to Management > Monitoring Flow > Scenarios menu.
- Select the scenario you want to check and select the Execution Results tab in the detail screen.
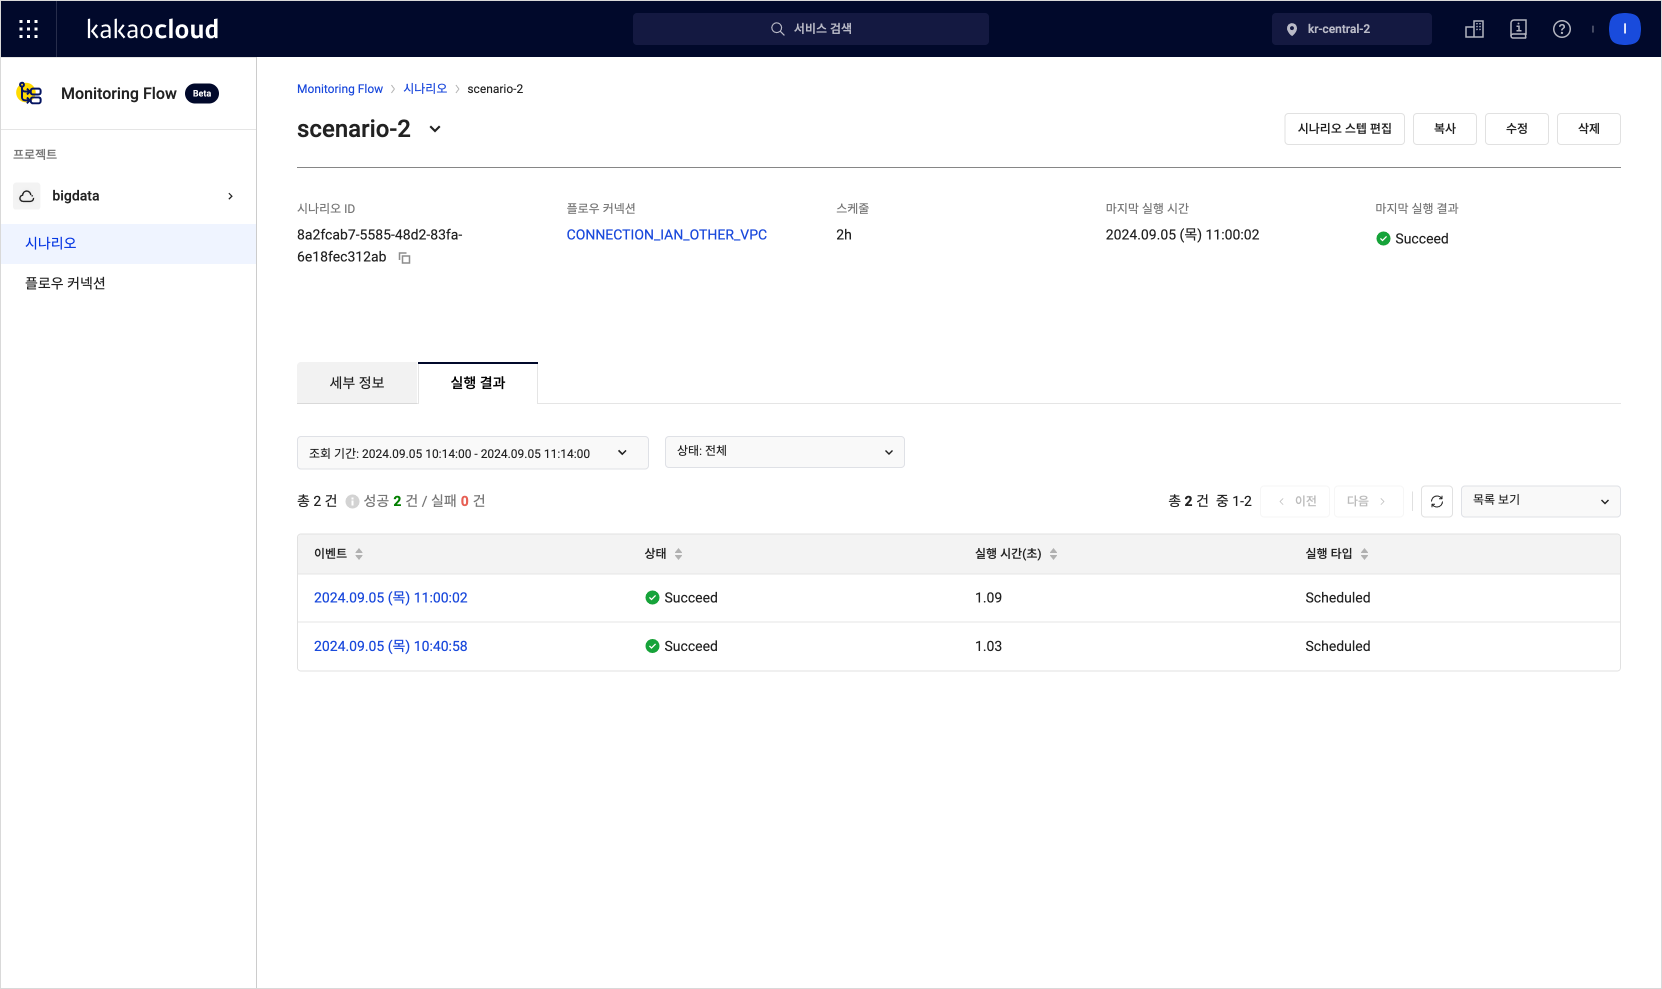 Scenario Execution Results List
- Select on the event in the execution result list to view the detailed result.
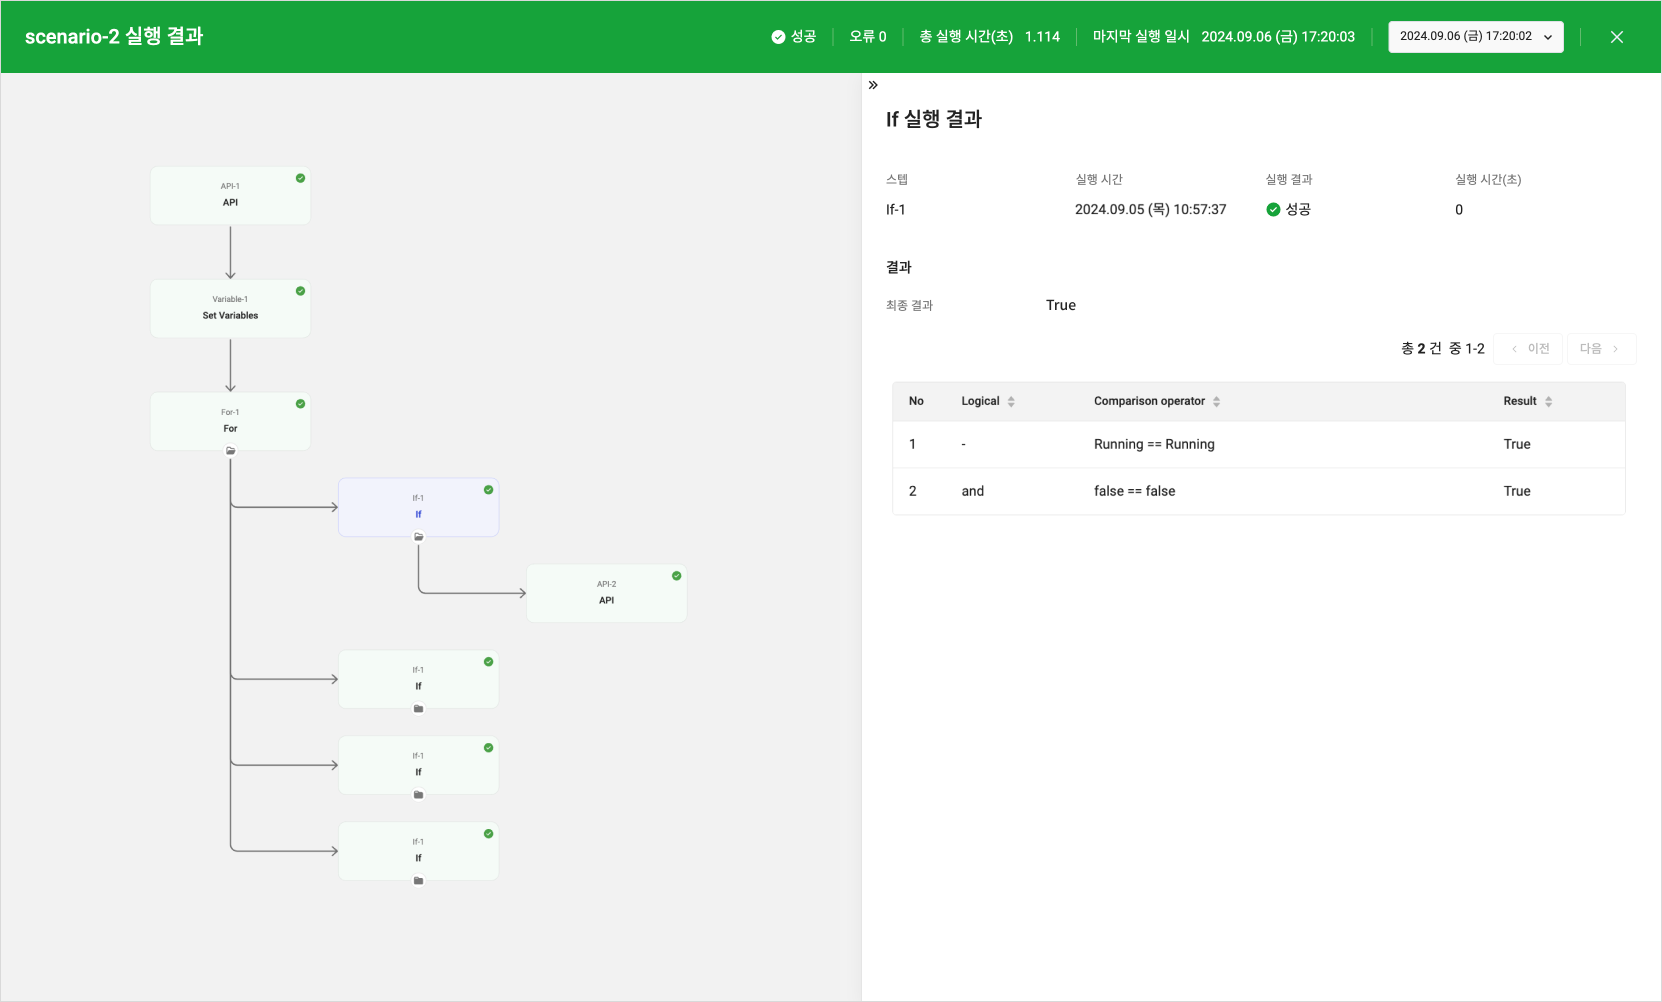 Detailed Scenario Execution Results
Step 7. Create Alert Policy in Alert Center
Set an alert policy in the Alert Center to receive notifications based on the execution results of the Monitoring Flow. The following example shows how to set up metric conditions to receive notifications based on the success or failure of the scenario.
-
Select the Management > Alert Center > Alert Policy menu from the KakaoCloud console. For detailed instructions, refer to the Create Alert Policy document.
-
Set the alert conditions based on the table below.
| Item | Setting Description |
|---|---|
| Condition Type | Metric |
| Service | Monitoring Flow |
| Condition Settings | Set the metric item to receive success/failure alerts - Setting Scenario Success Count and Scenario Fail Count in the scenario will allow you to receive all metric alerts - To receive alerts only on failures, set only Scenario Fail Count |
| Resource Item | Select the scenario for which you want to receive alerts |
| Threshold | 1 count or more |
| Duration | 1 minute |
- Select the [Next] button at the bottom to complete the creation of the alert policy.
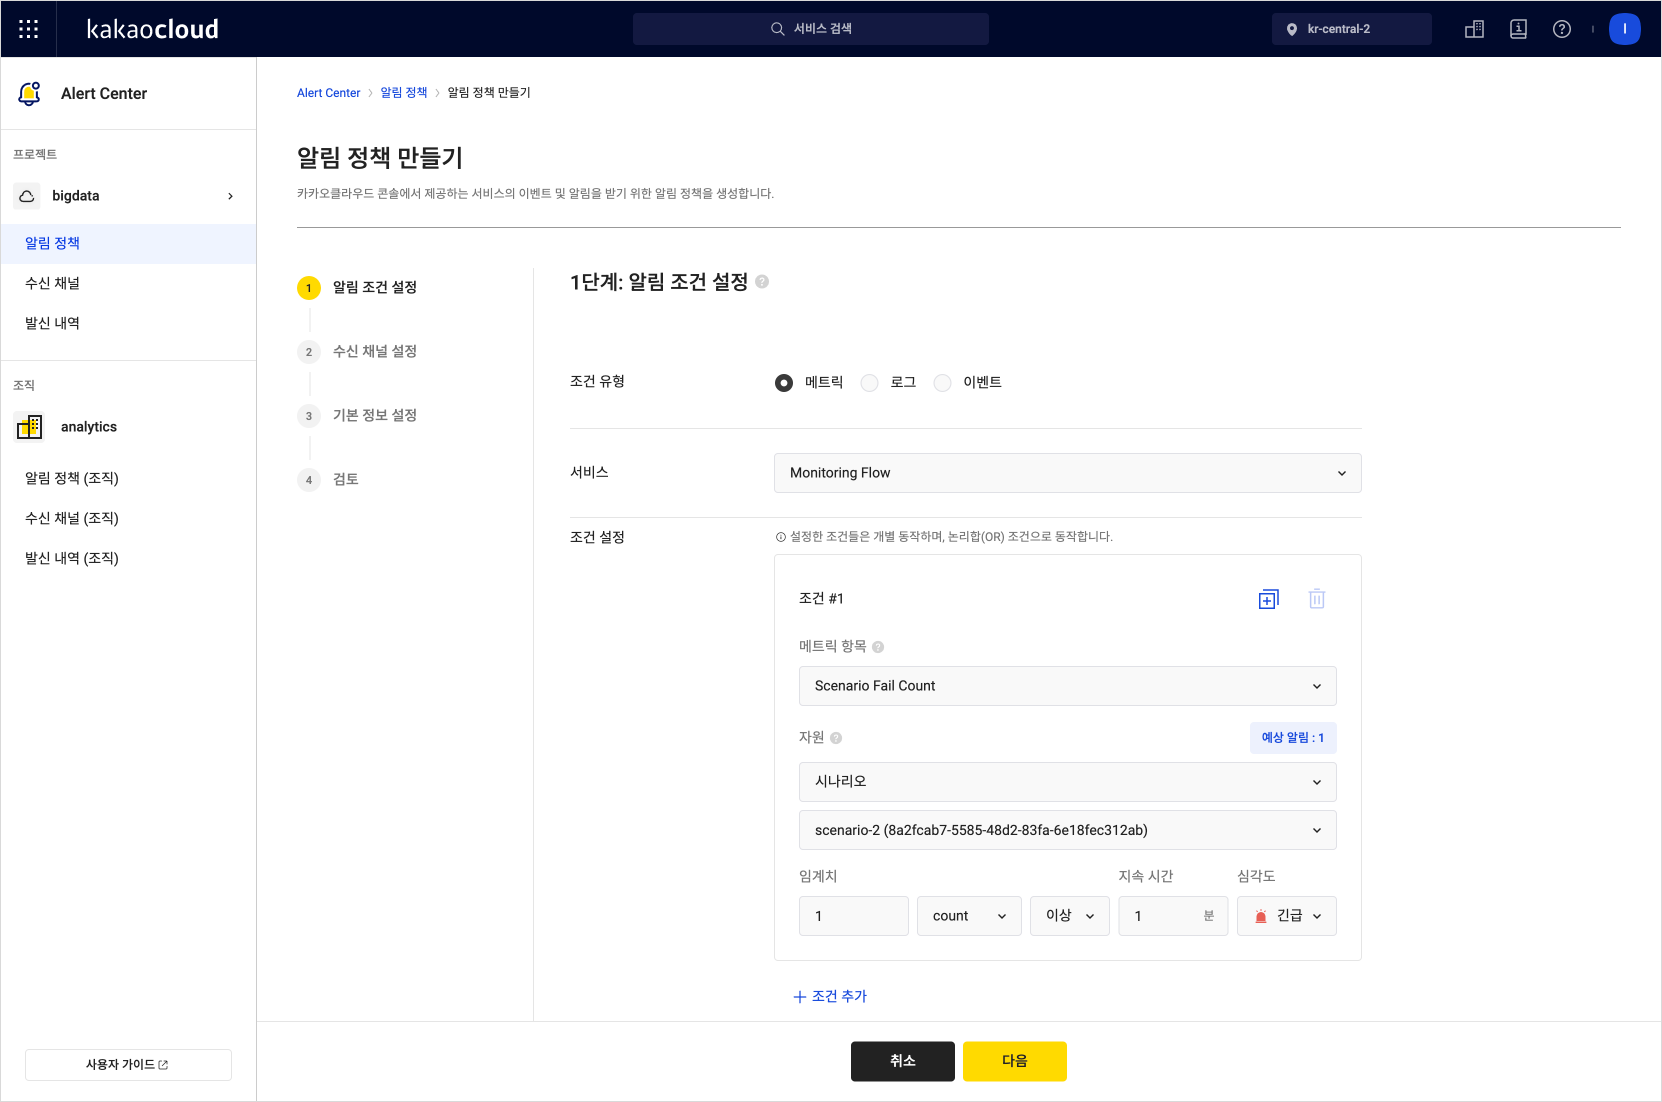 Creating Alert Policy
- Based on the set alert policy, you will receive real-time notifications about the execution results (success or failure) of the Monitoring Flow scenario, enabling you to quickly detect and respond to system state changes.