Automate Hadoop Cluster Auto-Scaling with Monitoring Flow
This guide explains how to automate the auto-scaling of a Hadoop cluster using KakaoCloud's Monitoring Flow and Hadoop Eco services.
- Estimated Time: 30 minutes
- Recommended OS: Ubuntu
- Prerequisites:
Scenario Overview
This scenario outlines the process of automating Hadoop cluster auto-scaling using the Monitoring Flow service. The main steps are as follows:
- Create a Hadoop cluster using KakaoCloud Hadoop Eco
- Create a scenario in Monitoring Flow to generate Scale-in/Scale-out schedules for the Hadoop cluster
- Receive alerts through Alert Center based on monitoring results
Before you start
Network Environment Setup
Set up the network environment for communication between the Monitoring Flow service and the Hadoop cluster. Follow the steps below to create a VPC and subnets.
VPC and Subnet Setup: tutorial
-
Go to KakaoCloud console > Networking > VPC.
-
Select the [+ Create VPC] button and configure the settings as follows:
Category Item Setting/Input VPC Information VPC Name tutorial VPC IP CIDR Block 10.0.0.0/16 Availability Zone Number of Availability Zones 1 First AZ kr-central-2-a Subnet Settings Number of Public Subnets per Availability Zone 1 kr-central-2-a Public Subnet IPv4 CIDR Block: 10.0.0.0/20
-
After reviewing the topology generated at the bottom, select [Create] if everything looks good.
- The subnet status will change from
Pending Create>Pending Update>Active. Once it reachesActive, proceed to the next step.
- The subnet status will change from
Getting started
Here is a step-by-step guide to adjusting the Hadoop cluster size using Monitoring Flow:
Step 1. Create Hadoop Eco Cluster
Create a Hadoop Eco cluster to set up the environment for Monitoring Flow to monitor.
-
Go to KakaoCloud console > Analytics > Hadoop Eco > Cluster.
-
If no cluster exists, refer to the Cluster Creation Guide to create a cluster.
- In the VPC Settings, select the VPC and subnet for the flow connection.
- In the Security Group Configuration, choose to [create a new security group]. The inbound and outbound policies for Hadoop Eco will be automatically set, and the created security group can be verified under VPC > Security.
-
Verify the created cluster's information:
- The cluster's status should change to
Runningonce it is successfully created. - Take note of the Cluster ID, which will be needed for Monitoring Flow step configuration.
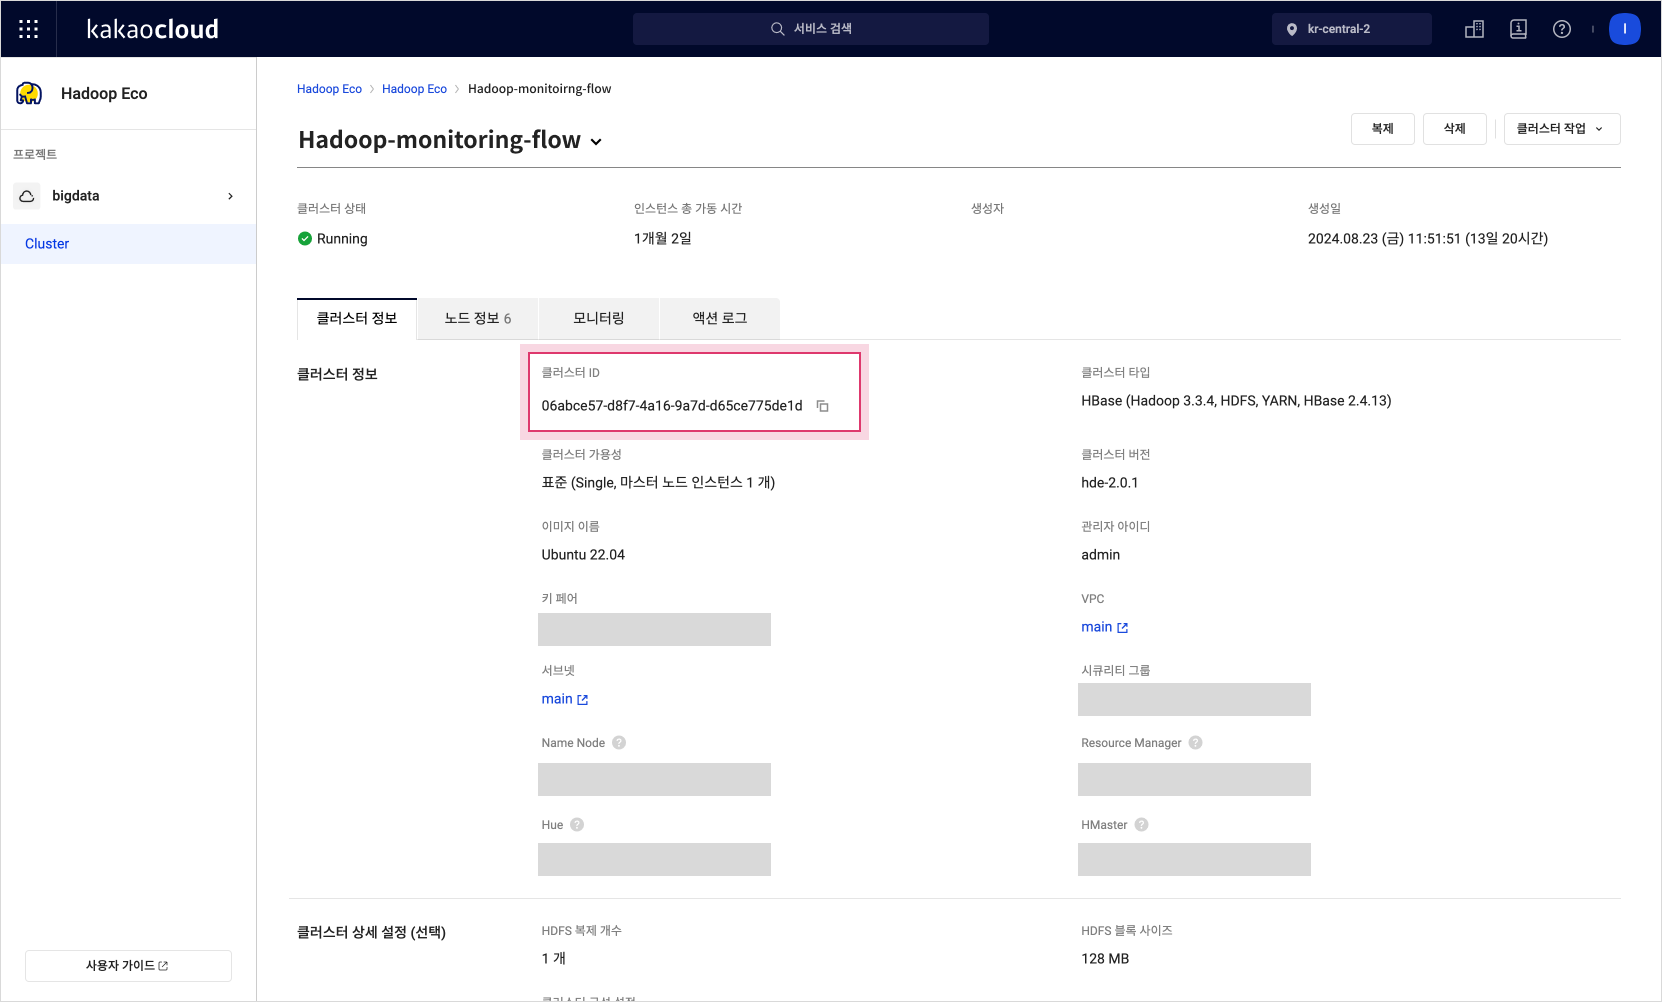 Cluster Details
 - The cluster's status should change to
Step 2. Create Scenario
Create a scenario in Monitoring Flow to monitor the Hadoop cluster and set up an execution schedule.
-
Go to KakaoCloud console > Management > Monitoring Flow > Scenarios.
-
Select the [Create Scenario] button to open the creation screen.
-
Set up the schedule without selecting a flow connection. In this example, no inter-subnet communication is needed, so the scenario can be created without a flow connection.
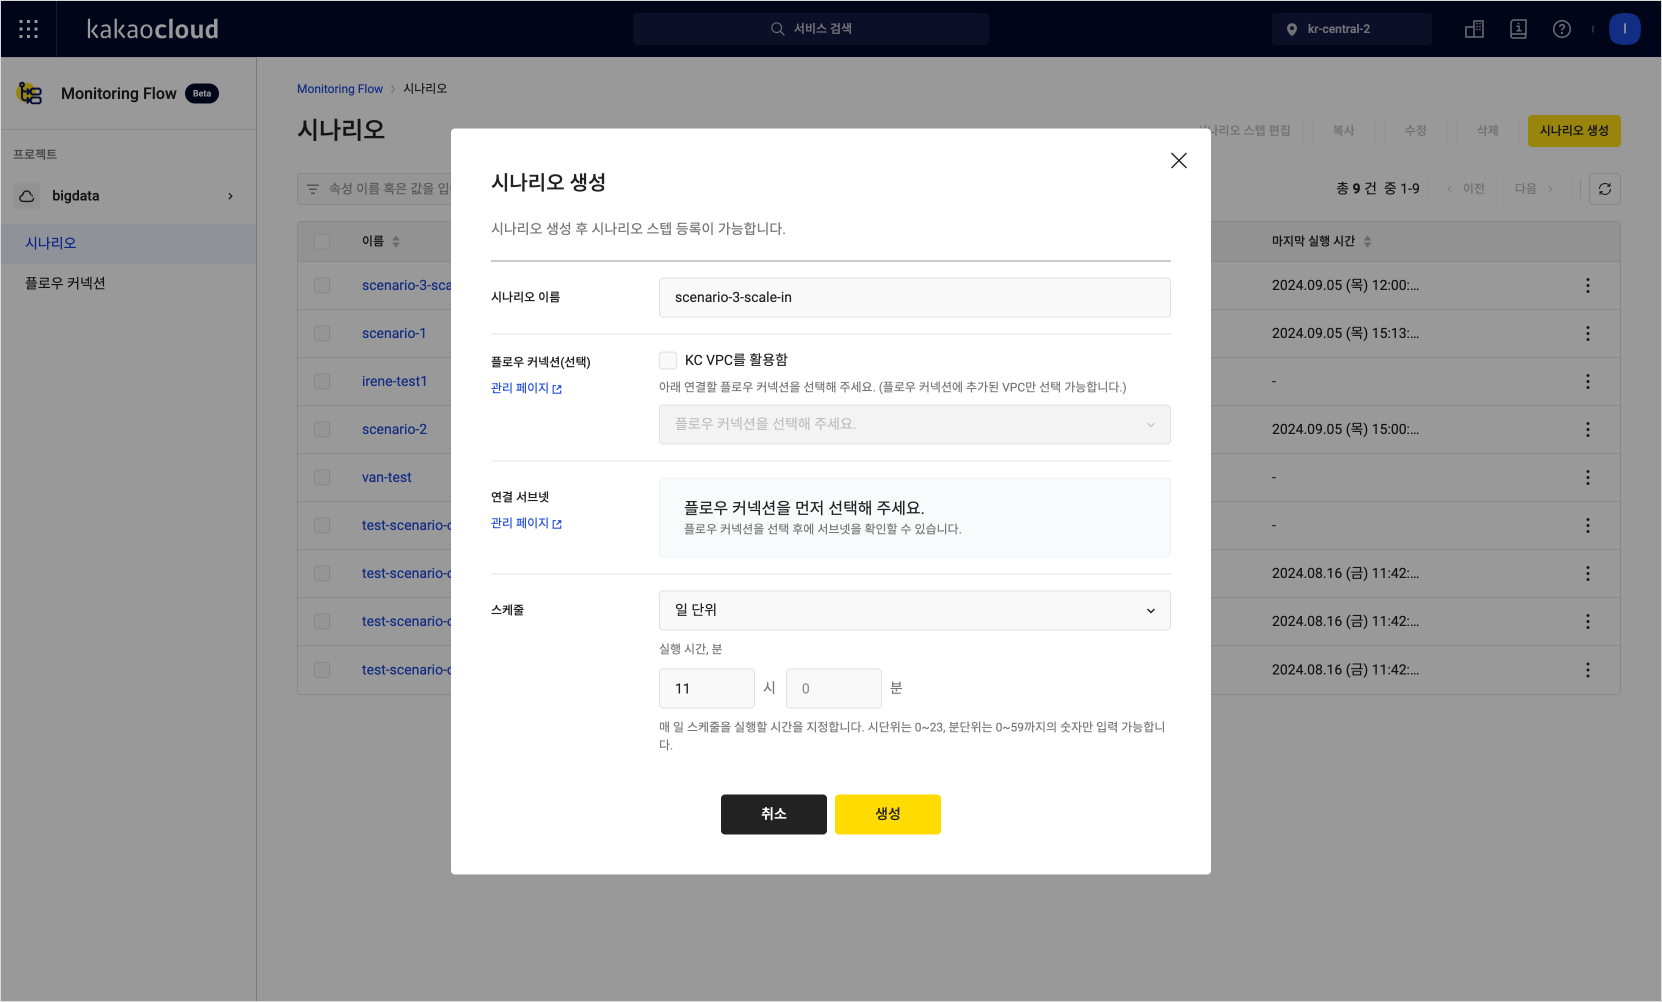 Scenario Creation
Step 3. Add Scenario Step: API
Scenarios consist of multiple steps that automate specific tasks. In this step, configure the auto-scaling scenario to perform Scale-in/Scale-out actions based on the cluster's status. Use the example below to configure each item.
-
Go to KakaoCloud console > Management > Monitoring Flow > Scenarios.
-
Select on the name of the scaling scenario you want to automate to go to its details page.
-
On the Details tab, select the [Add Scenario Step] button at the top right.
-
Use the table below to configure the fields. Enter all three examples and save the Headers values.
Field Example 1 Example 2 Example 3 Description Type API Select APIStep Name API-1 Set the name for the step Expected Code 200 The server should return a 200status code to confirm availabilityMethod POST Select the API request method URL Example Check
-/scale-outor
/scale-inEnter the API URL, e.g., https://hadoop-eco.kr-central-2.kakaocloud.com/v2/hadoop-eco/clusters/{Cluster-ID}/scale-out. The Cluster ID can be found under Analytics > Hadoop Eco > ClusterHeader Key Content-type credential-id credential-secret Enter Headers Key values
Refer to the Hadoop Cluster Creation RequestHeader Value application/json Access key ID Secret access key Enter Headers Value
Refer to the Hadoop Cluster Creation RequestBody {"scaleCnt": 1 }Enter Body value
Variables can be entered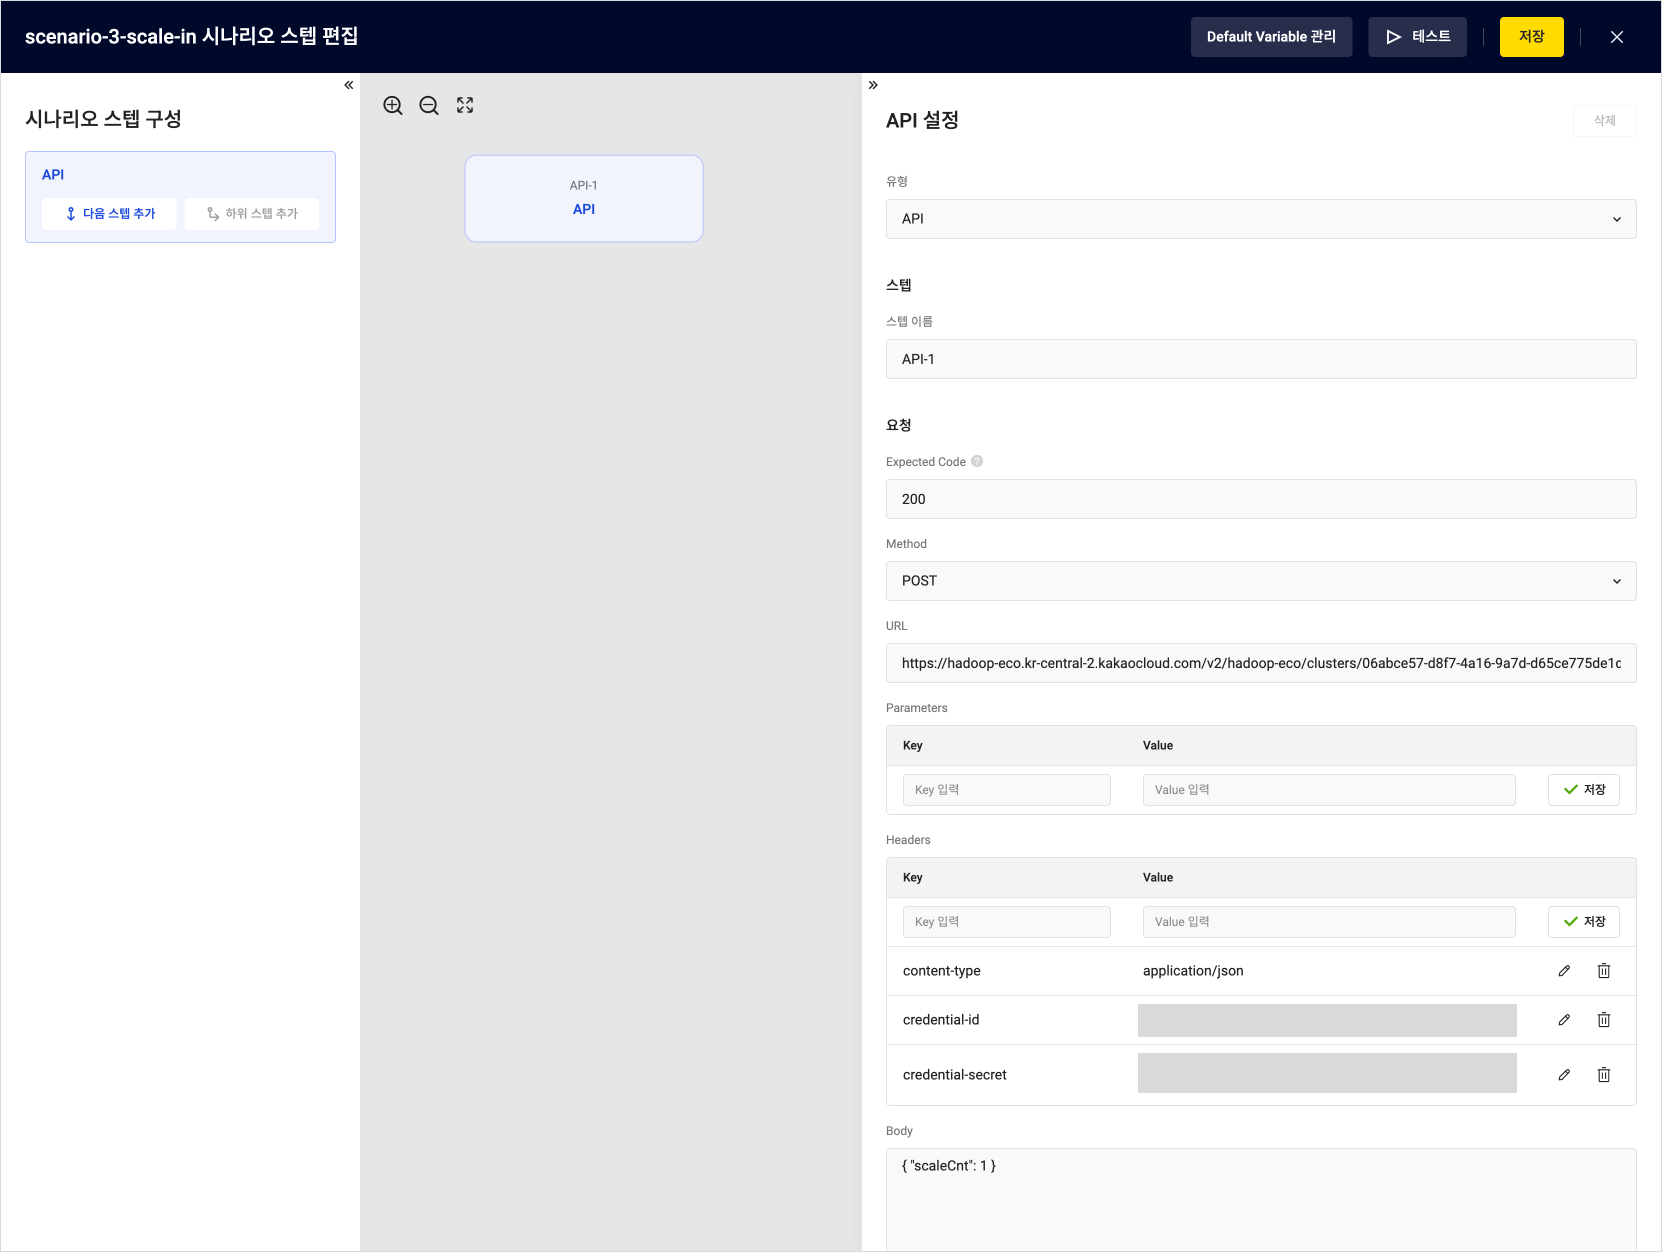 Scale Out
Step 4. Test Scenario
Check the results of the test run for the created scenario. If a 200 response is returned from the URL set in Step 4, the API server is functioning normally. If an unexpected response code is returned, it indicates an issue with the server, which can be diagnosed.
-
If the test runs successfully, Success will be shown under the [Execution Result].
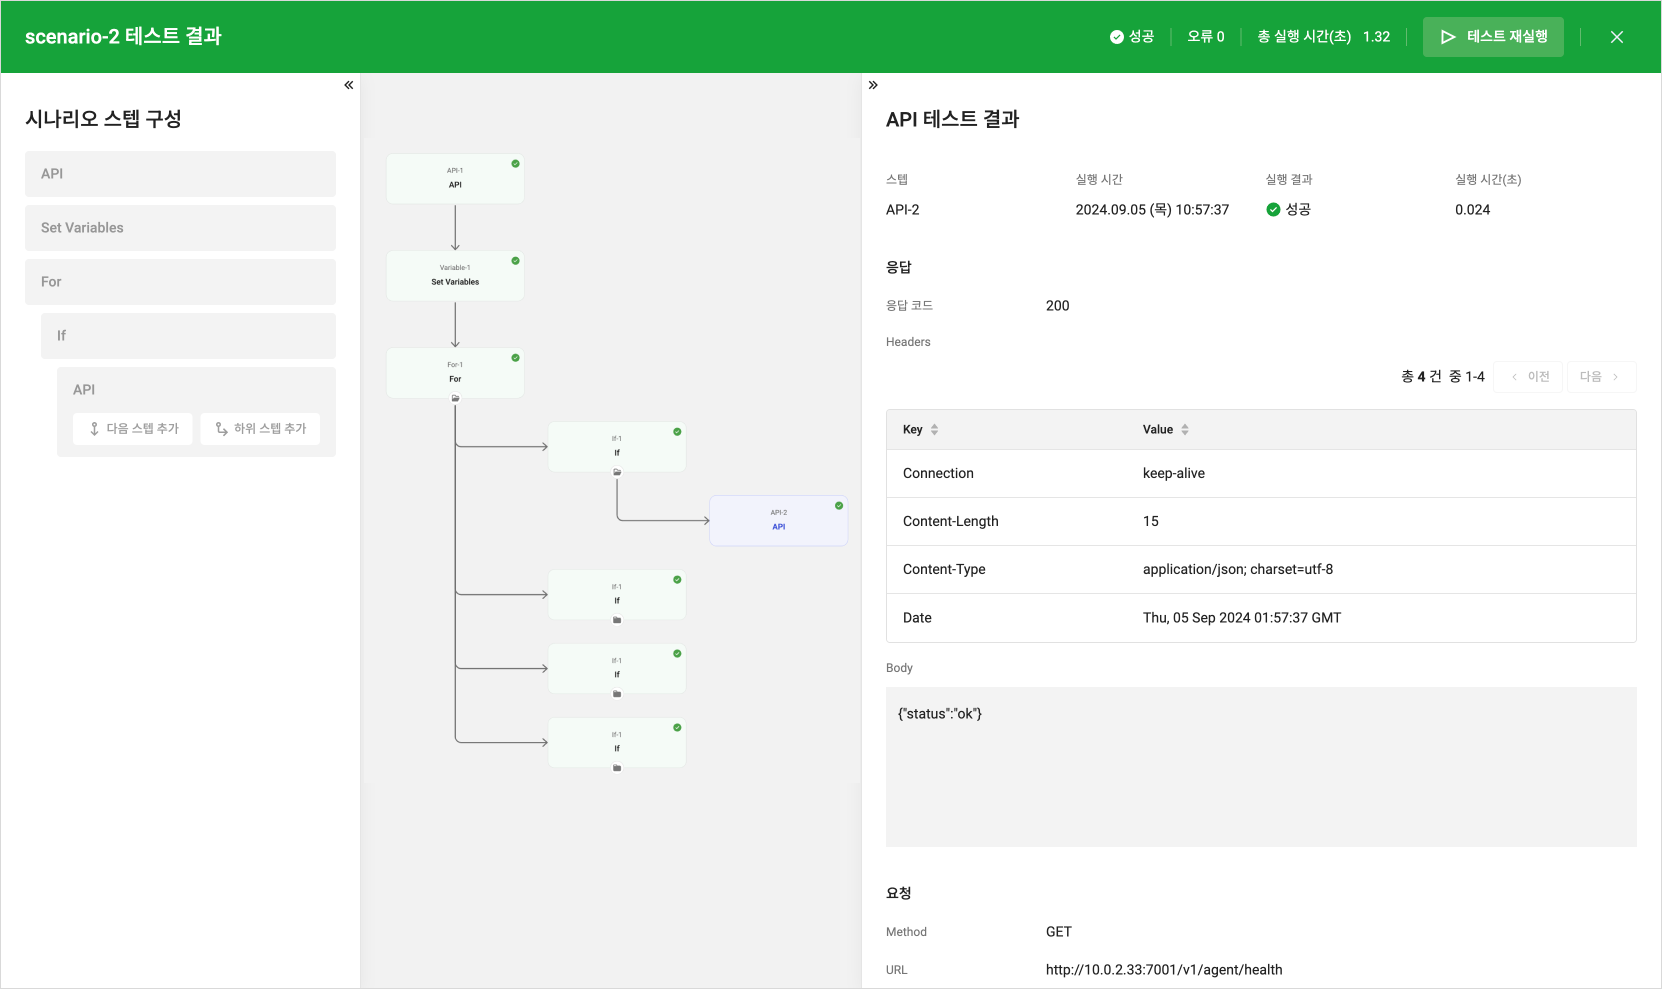 Test Success Result
 -
If an unexpected response code is returned, it will be marked as Failure, indicating a server issue. In this case, check the error details in the lower panel of the right-side menu to resolve the problem.
caution- Errors may occur if accessing a deactivated instance. Ensure the correct IP address is entered.
-
Close the test screen and save the scenario from the Scenario Step Edit screen. The saved scenario will execute automatically based on the configured schedule.
Step 5. Check Execution Results
Check the execution results and the time to evaluate whether the scenario is working correctly. You can verify if the scenario has completed without errors by reviewing the detailed information.
-
Go to the KakaoCloud console and select Management > Monitoring Flow > Scenario from the menu.
-
Select the scenario to check, then select the Execution Results tab in the details screen.
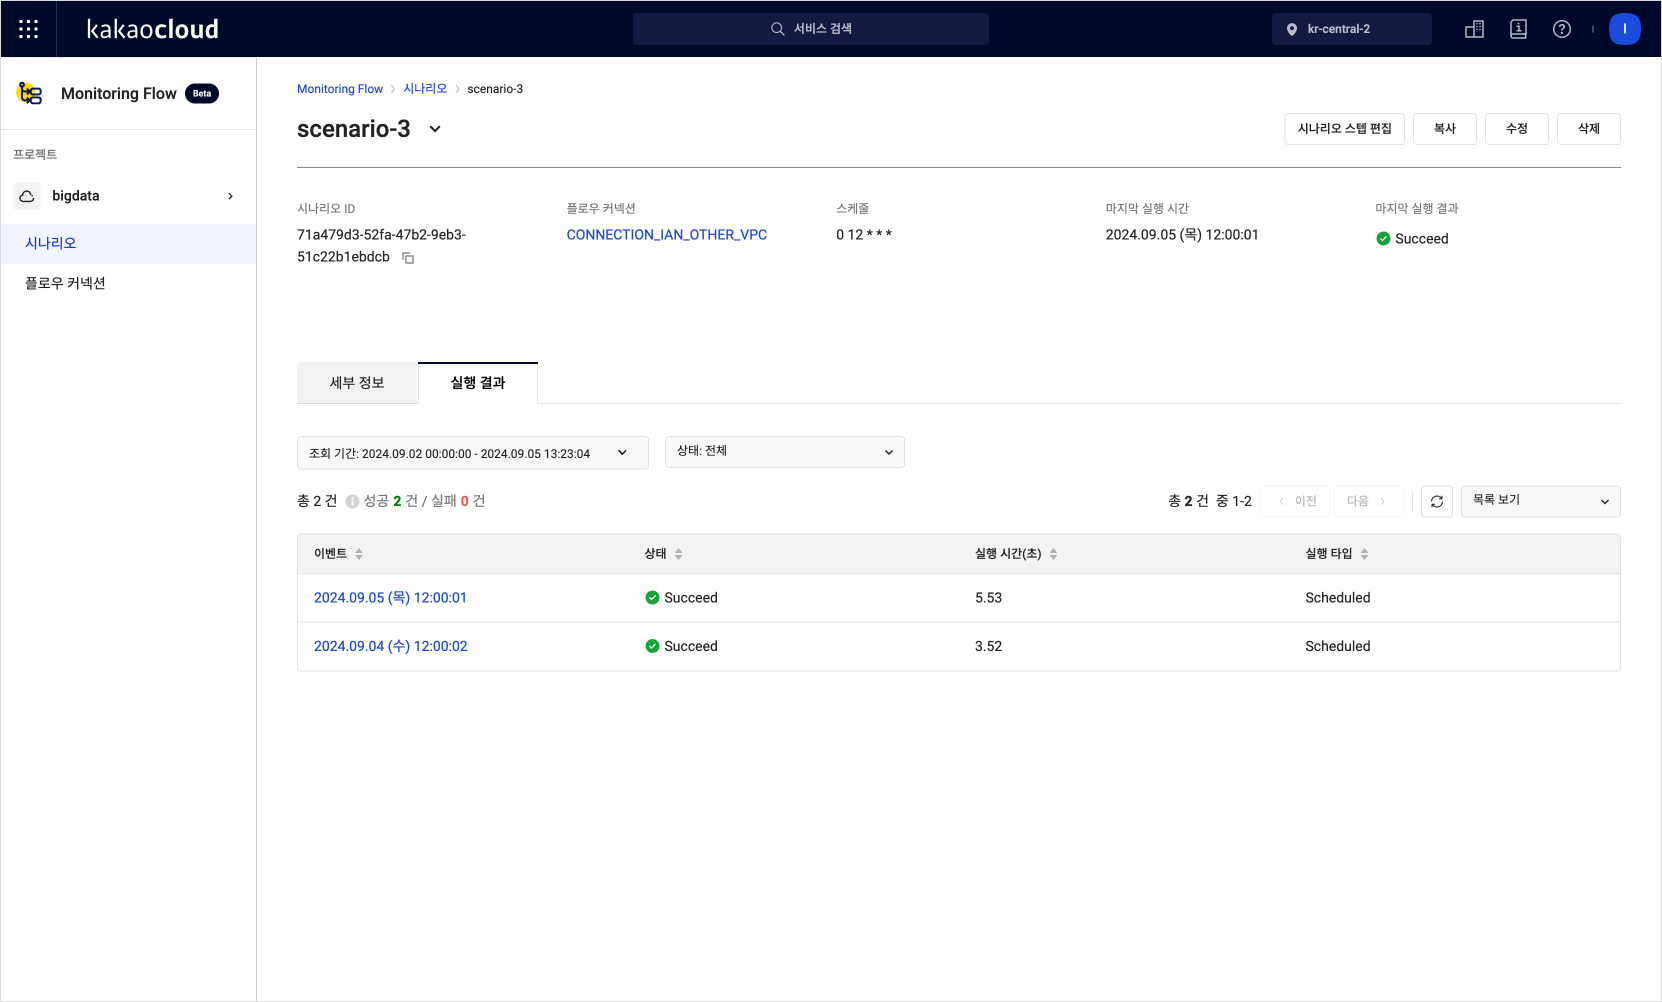 Scenario execution results list
 -
Select on an event in the execution results list to view the detailed results.
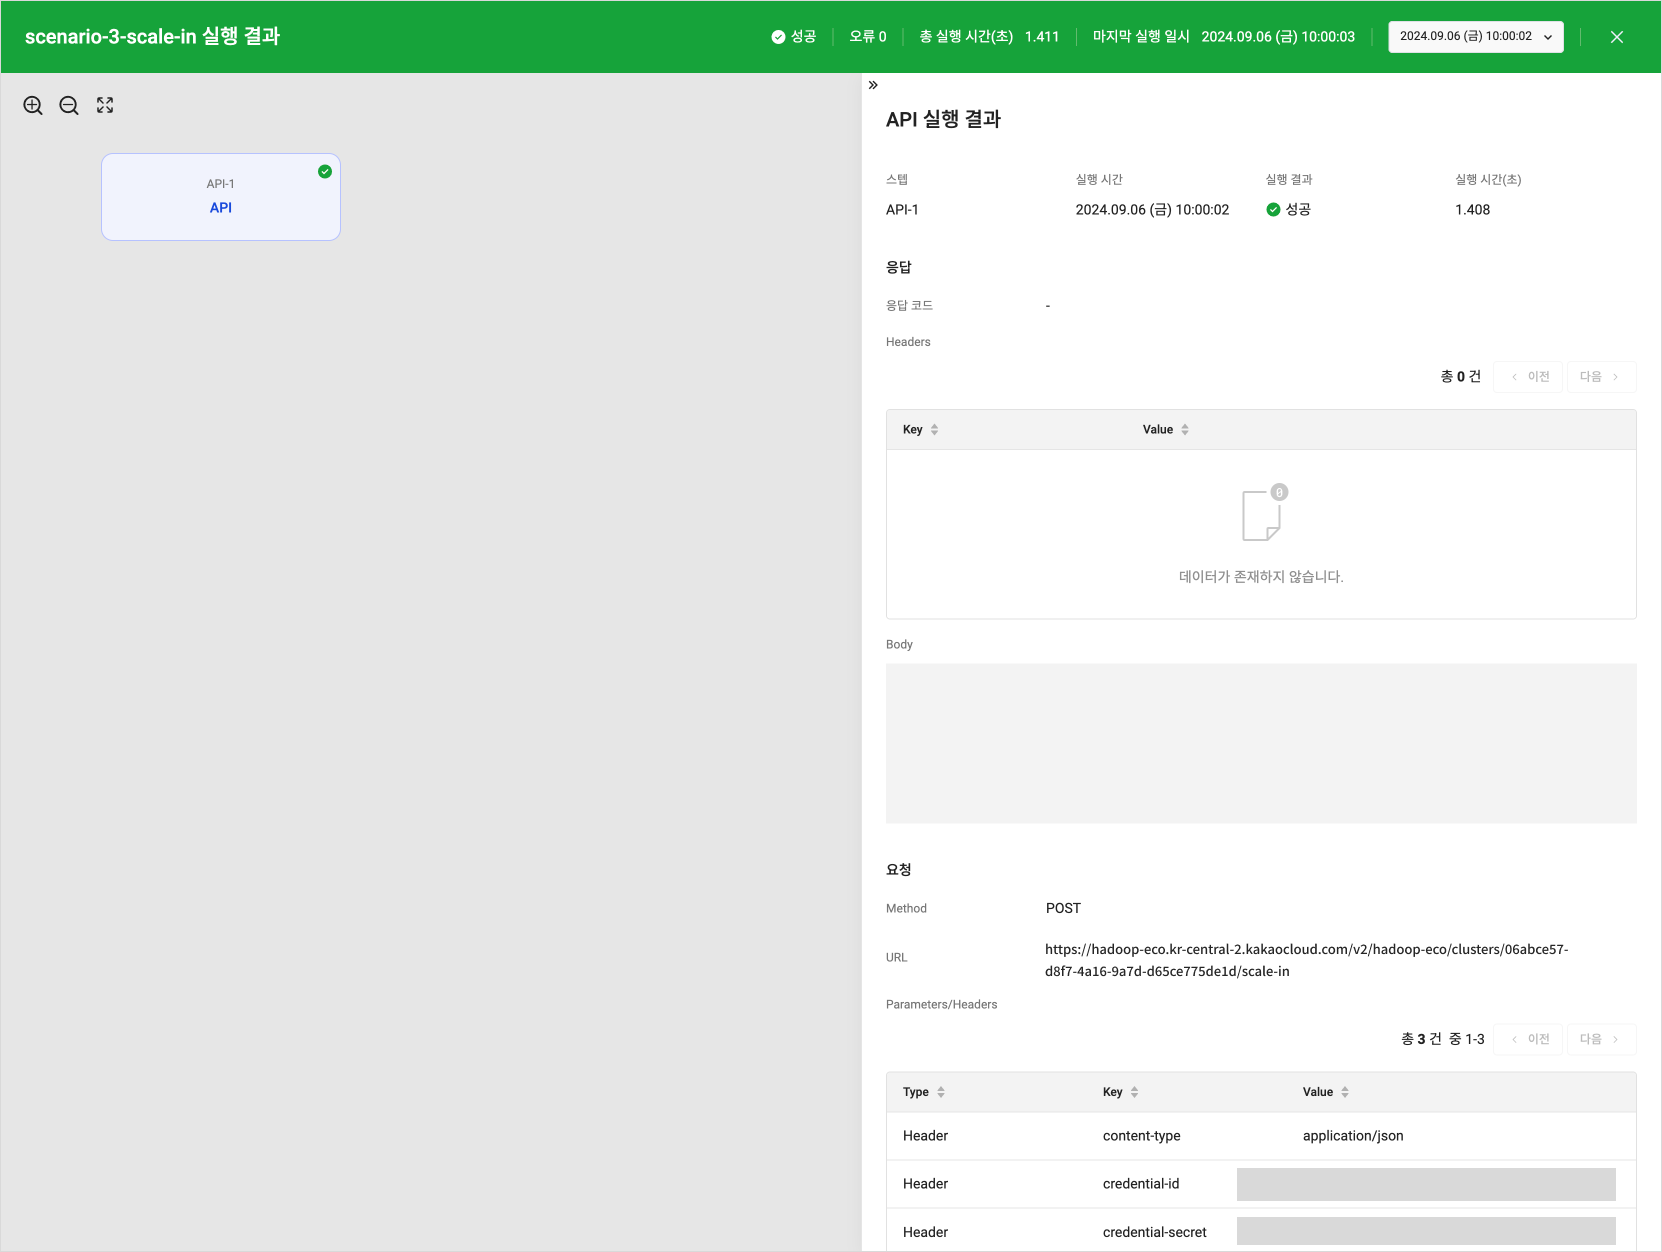 Detailed scenario execution results
Step 6. Create Alert Center Alarm Policy
You can receive responses regarding the execution results (success/failure) of Monitoring Flow by setting up an Alert Center alarm policy.
-
Go to KakaoCloud console > Management > Alert Center > Alarm Policy. For detailed instructions, refer to the Create Alarm Policy guide.
-
Set the alarm conditions based on the following table:
| Item | Settings |
|---|---|
| Condition Type | Metric |
| Service | Monitoring Flow |
| Condition Setup | Set to receive success/failure alerts using metric items - By setting Scenario Success Count and Scenario Fail Count for the scenario, you can receive all metric alerts - To only receive alerts for failures, set only Scenario Fail Count |
| Resource Item | Select the scenario for which you want to receive alerts |
| Threshold | 1 count or more |
| Duration | 1 minute |
- Select the [Next] button below to complete creating the alarm policy.
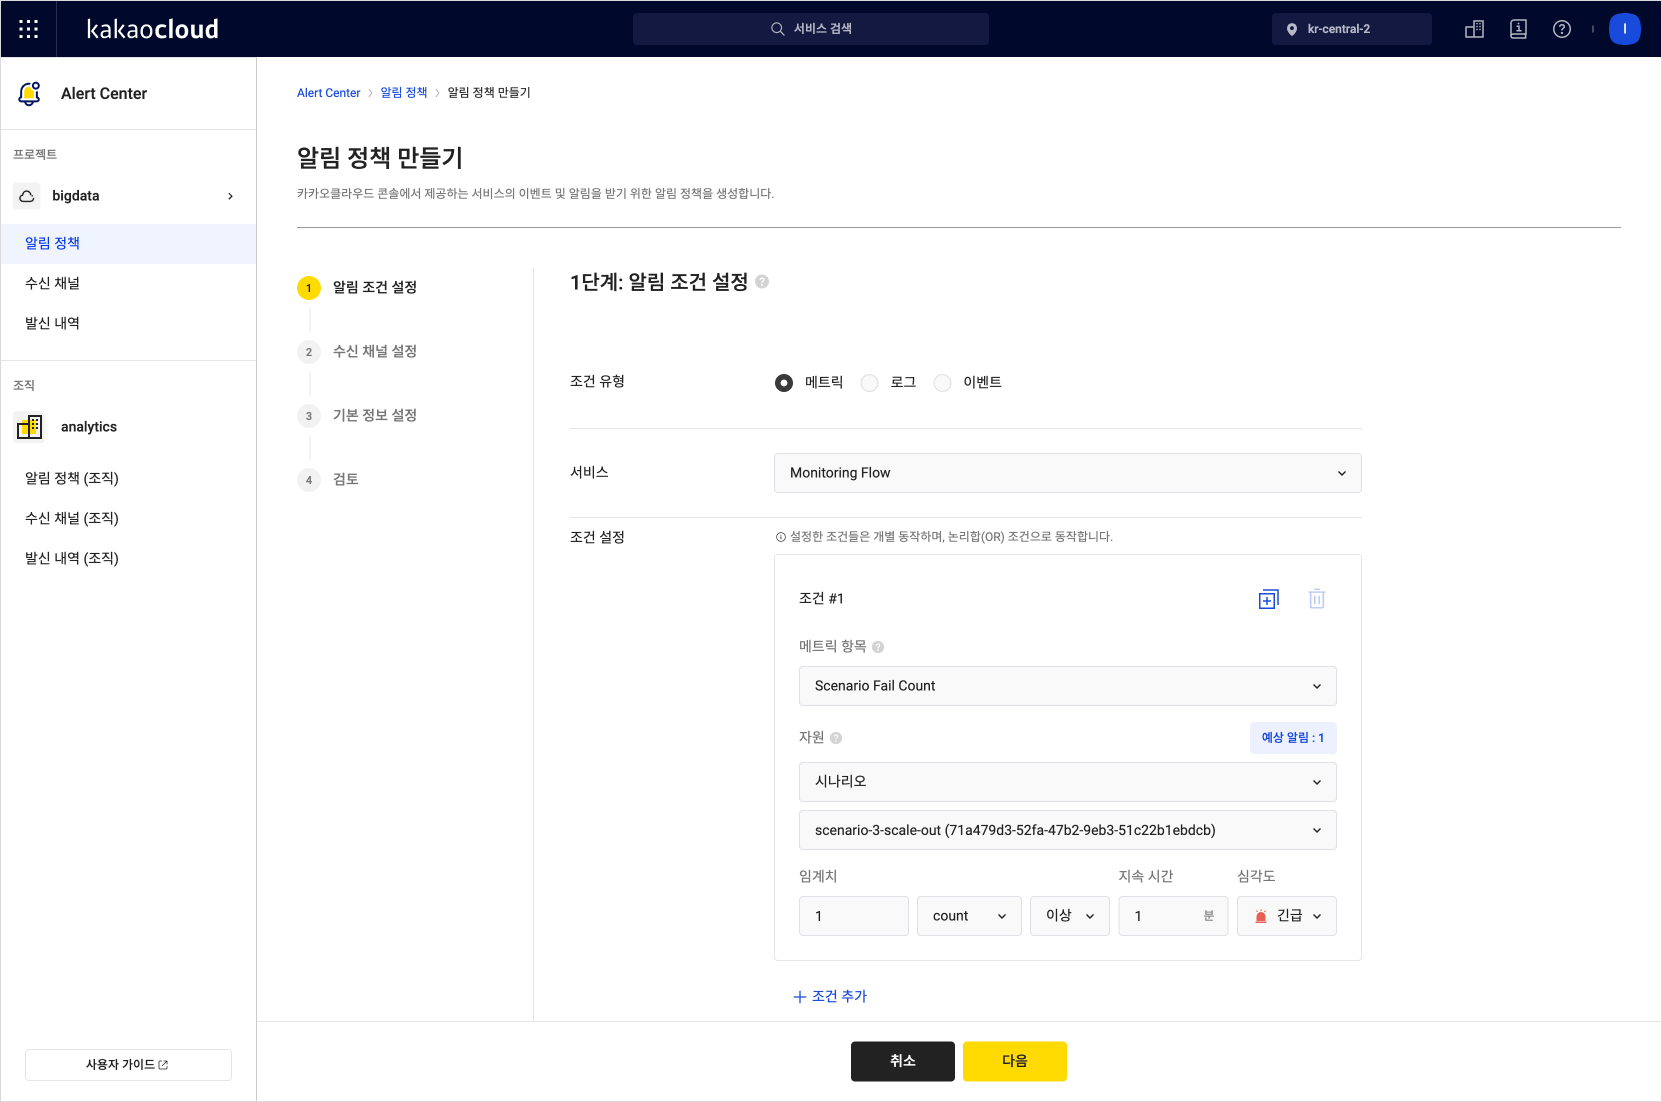 Create alarm policy
- Based on the configured alarm policy, you can receive real-time notifications about the execution results (success or failure) of the Monitoring Flow scenario. This allows you to quickly identify changes in the system's status and respond accordingly.