Set up Kubernetes Engine cluster monitoring
This example explains how to set up a workload monitoring environment for a Kubernetes cluster created with Kubernetes Engine. You can receive Kubernetes cluster alerts via Slack using Alertmanager and monitor workloads through Grafana dashboards.
- Estimated time: 30 minutes
- Recommended OS: MacOS, Ubuntu
- Prerequisites
- Access key
- Slack account and workspace
- Reference documentation
Before you start
1. Install kubectl
Install kubectl using the following command:
brew install kubectl
2. Install Helm
Install the Helm package by entering the brew install helm command in the terminal. Helm is a Kubernetes package manager that allows you to search, share, and use software for Kubernetes.
brew install helm
3. Create Kubernetes cluster
For a detailed guide on setting up a Kubernetes environment using Kubernetes Engine, refer to the Build Kubernetes cluster with Kubernetes Engine document.
-
Follow Step 1. Create Kubernetes cluster to create a cluster using Kubernetes Engine.
-
Proceed with Step 2. Call Kubernetes API with kubectl.
Getting started
Step 1. Set up Slack alert
-
Go to the Slack API site and select Create an app to create an app of the 'From scratch' type. Enter the app name and select your workspace during creation.
-
On the app's details page, navigate to the Incoming Webhooks tab on the left, enable the Activate Incoming Webhooks setting, and select Add New Webhook to Workspace in the Webhook URLs for Your Workspace block to add a channel for receiving alerts in Slack.
-
After adding the channel, copy the generated Webhook URL by clicking the Copy button.
Step 2. Set up monitoring environment
Helm can be used to conveniently create and manage a Prometheus stack environment in a Kubernetes cluster. Modify the kube-prometheus-stack configuration file to create the kube-prometheus stack, Grafana dashboard, and Alertmanager in the Kubernetes cluster.
Customize configuration file
-
Create a directory for the example task in your local environment, then navigate to that directory.
mkdir ~/k8se-monitor
cd ~/k8se-monitor -
Download the pre-configured
custom-values.yamlfile, which includes configurations for Alertmanager and Grafana.curl -O https://raw.githubusercontent.com/kakaoenterprise/kc-handson-config/k8s-monitor/custom-values.yaml -
In the downloaded
custom-values.yamlfile, you can modify Slack alert settings such as alert frequency, message format, and notification channels.
Enter the channel and Webhook URL values from Step 1. Set up Slack alert into thechannelandapi_urlfields, respectively.# Line 157, 158
- channel: '#channel-name'
api_url: https://hooks.slack.com/services/...s/...- For additional Slack alert configurations, refer to slack_config and modify the Alertmanager fields as needed.
-
In the
additionalPrometheusRulesMapfield of the configuration file, you can add alert rules.
The provided configuration file is already set to trigger an alert when Cluster Memory Usage exceeds 10%.Add the following code to trigger an alert when Cluster CPU Usage exceeds 5%:
# Line 97~
additionalPrometheusRulesMap:
    rule-name:
        groups:
        - name: Kubernetes Cluster monitoring
        rules:
        - alert: Cluster Memory Usage Over 10%
          expr: sum (container_memory_working_set_bytes{kubernetes_io_hostname=~"^.*$"}) / sum (machine_memory_bytes{kubernetes_io_hostname=~"^.*$"}) * 100 > 10
          for: 1m
          annotations:
              title: "Cluster Memory Usage Over 10%"
              message: "Memory Usage: {{ $value }}"
          labels:
              severity: 'warning'
  #### Add Rule ####
        - alert: Cluster CPU Usage Over 5%
          expr: sum (rate (container_cpu_usage_seconds_total{kubernetes_io_hostname=~"^.*$"}[2m])) / sum (machine_cpu_cores{kubernetes_io_hostname=~"^.*$"}) * 100 > 5
          for: 1m
          annotations:
              title: "Cluster CPU Usage Over 5%"
              message: "CPU Usage: {{ $value }}"
          labels:
              severity: 'warning'
Install kube-prometheus-stack
Install the kube-prometheus-stack using the customized configuration file.
helm repo add prometheus-community \
   https://prometheus-community.github.io/helm-charts
helm repo update

helm install prometheus prometheus-community/kube-prometheus-stack -f custom-values.yaml -n kube-system
Step 3. Verify Slack alert reception
Access your Slack channel and verify that alerts are received according to the configured rules.
Step 4. Verify Grafana dashboard
You can visualize cluster data through the Grafana dashboard.
Access Grafana dashboard
-
Perform port forwarding to access the Grafana dashboard. Use the following
kubectlcommand to forward port30080on your local environment to the Grafana dashboard endpoint.kubectl port-forward svc/prometheus-grafana -n kube-system 30080:80 & -
Open a browser on your local environment and navigate to
http://localhost:30080. If installed correctly, you will see the Grafana login page.Use the default Grafana credentials to log in:
Key Value username admin password prom-operator -
Once logged in, the Grafana home screen will appear.
Create Grafana data source
The prometheus-server within the Prometheus stack retrieves node metrics from prometheus-node-exporter. In Grafana, create a Data Source to request these metrics from prometheus-server.
Refer to the table below for configuration:
| Key | Data |
|---|---|
| Name | Tutorial |
| Url | http://prometheus-kube-prometheus-prometheus:9090 |
Check Grafana dashboard
-
Download the dashboard configuration file
dashboard.jsonto your local environment.curl -O https://raw.githubusercontent.com/kakaoenterprise/kc-handson-config/k8s-monitor/dashboard.json -
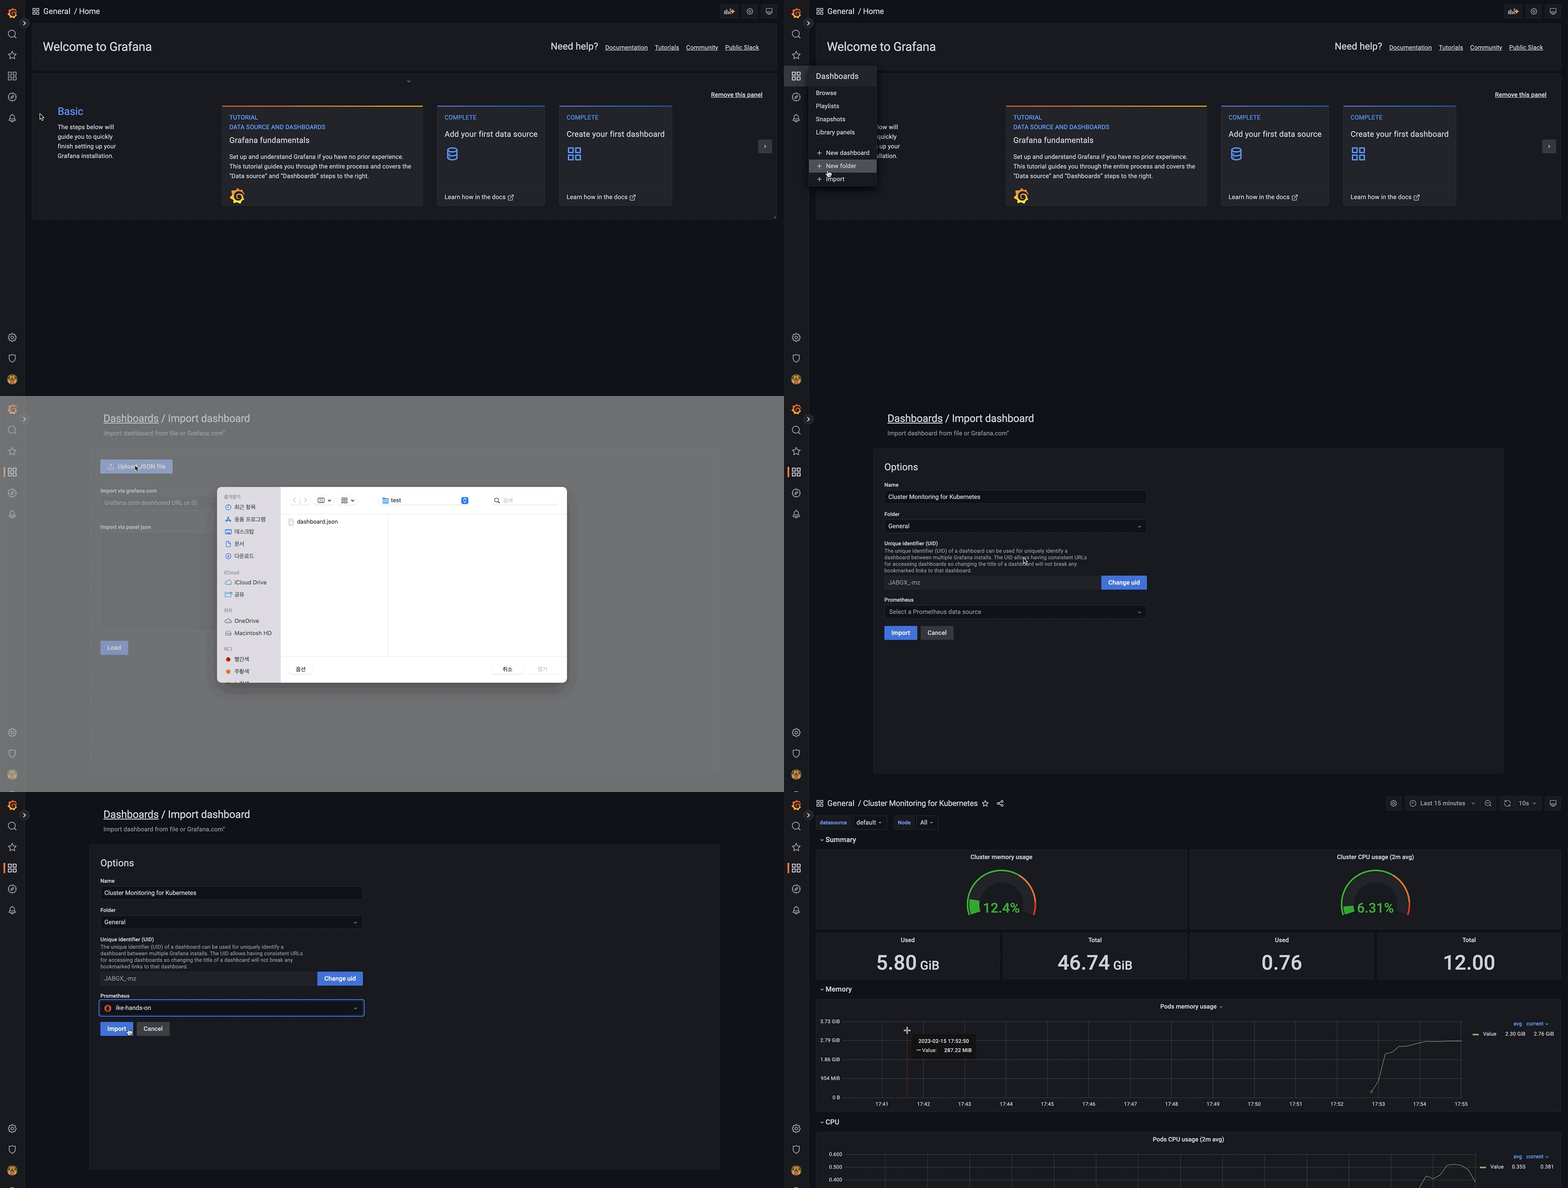
In Grafana, select on the Dashboards tab on the left and navigate to the Import Dashboard page. Select [Upload JSON file] and upload the downloaded
dashboard.jsonfile. When prompted to select a Prometheus data source, choose Tutorial, created in Create Grafana data source.
-
You can now view detailed information about Memory usage, CPU usage, and other cluster metrics on the Grafana dashboard.