API Server Monitoring with Monitoring Flow
This document describes the process of monitoring an API server instance using the KakaoCloud Monitoring Flow service.
- Estimated Time: 20 minutes
- Recommended OS: Ubuntu
- Prerequisites:
Scenario Overview
This scenario explains how to use the Monitoring Flow service to monitor a VM instance used as an API server. The key steps are as follows:
- Create an API server instance using KakaoCloud's Virtual Machine service.
- Create a Flow Connection to connect the subnet channel where the API server resides.
- Create a Scenario in Monitoring Flow to monitor the API server.
- Integrate with Alert Center to receive notifications based on the scenario results.
Before you start
1. Network environment setup
To allow communication between the Monitoring Flow service and the VM instance used as the API server, configure the network environment. Refer to the table below to create a VPC and a public subnet.
VPC and Subnet: tutorial
-
Go to KakaoCloud console > Networking > VPC.
-
Select the [+ Create VPC] button and configure the VPC and subnet as follows:
Category Item Settings/Values VPC Information VPC Name tutorial VPC IP CIDR Block 10.0.0.0/16 Availability Zone Number of Availability Zones 1 First AZ kr-central-2-a Subnet Settings Public Subnet per Availability Zone 1 kr-central-2-a Public Subnet IPv4 CIDR Block: 10.0.0.0/20
-
Review the topology generated at the bottom and select [Create] if everything is correct.
- The status of the subnet changes from
Pending Create>Pending Update>Active. You must wait until it becomesActivebefore proceeding to the next step.
- The status of the subnet changes from
2. Configure Security Group
Enhance security by opening specific ports (e.g., TCP 80) in the inbound policy of the security group and restricting access by source IP. This ensures that Monitoring Flow can transmit traffic to the API server according to the specified policy.
Security Group: monitoring-flow-security-group
-
Go to KakaoCloud console > VPC > Security Groups and create a security group as shown below.
Name Description (Optional) monitoring-flow-security-group Monitoring Flow tutorial -
Select the [+ Add] button and configure the inbound policy as follows, then select [Apply]:
Inbound Policy to Add Item Settings inbound policy 1 Protocol TCPSource IP 10.0.0.0/24 Port Number 80 Description (Optional) inbound policy 1
Workflow
This section provides step-by-step instructions for monitoring an API server instance based on a Virtual Machine using Monitoring Flow.
Step 1. Create a VM Instance
Create a VM instance to be used as the API server. Refer to the Create Instance document for instructions.
-
Go to KakaoCloud console > Compute > Beyond Compute Service > Virtual Machine > Instance.
-
Select Create Instance and enter the required information during the instance creation process.
-
In the Network section, select the VPC and subnet that will connect to Monitoring Flow.
- Note: The instance must be created within a VPC registered with the security group.
-
Select Advanced Settings and enter the following script before clicking [Create]:
#!/bin/bash
sudo apt update -y
sudo apt install -y nginx
sudo service start nginx -
Verify the information for the created instance.
- When the instance status shows as
Active, the API server is ready to function normally. - Private IP is required for the scenario setup in Monitoring Flow.
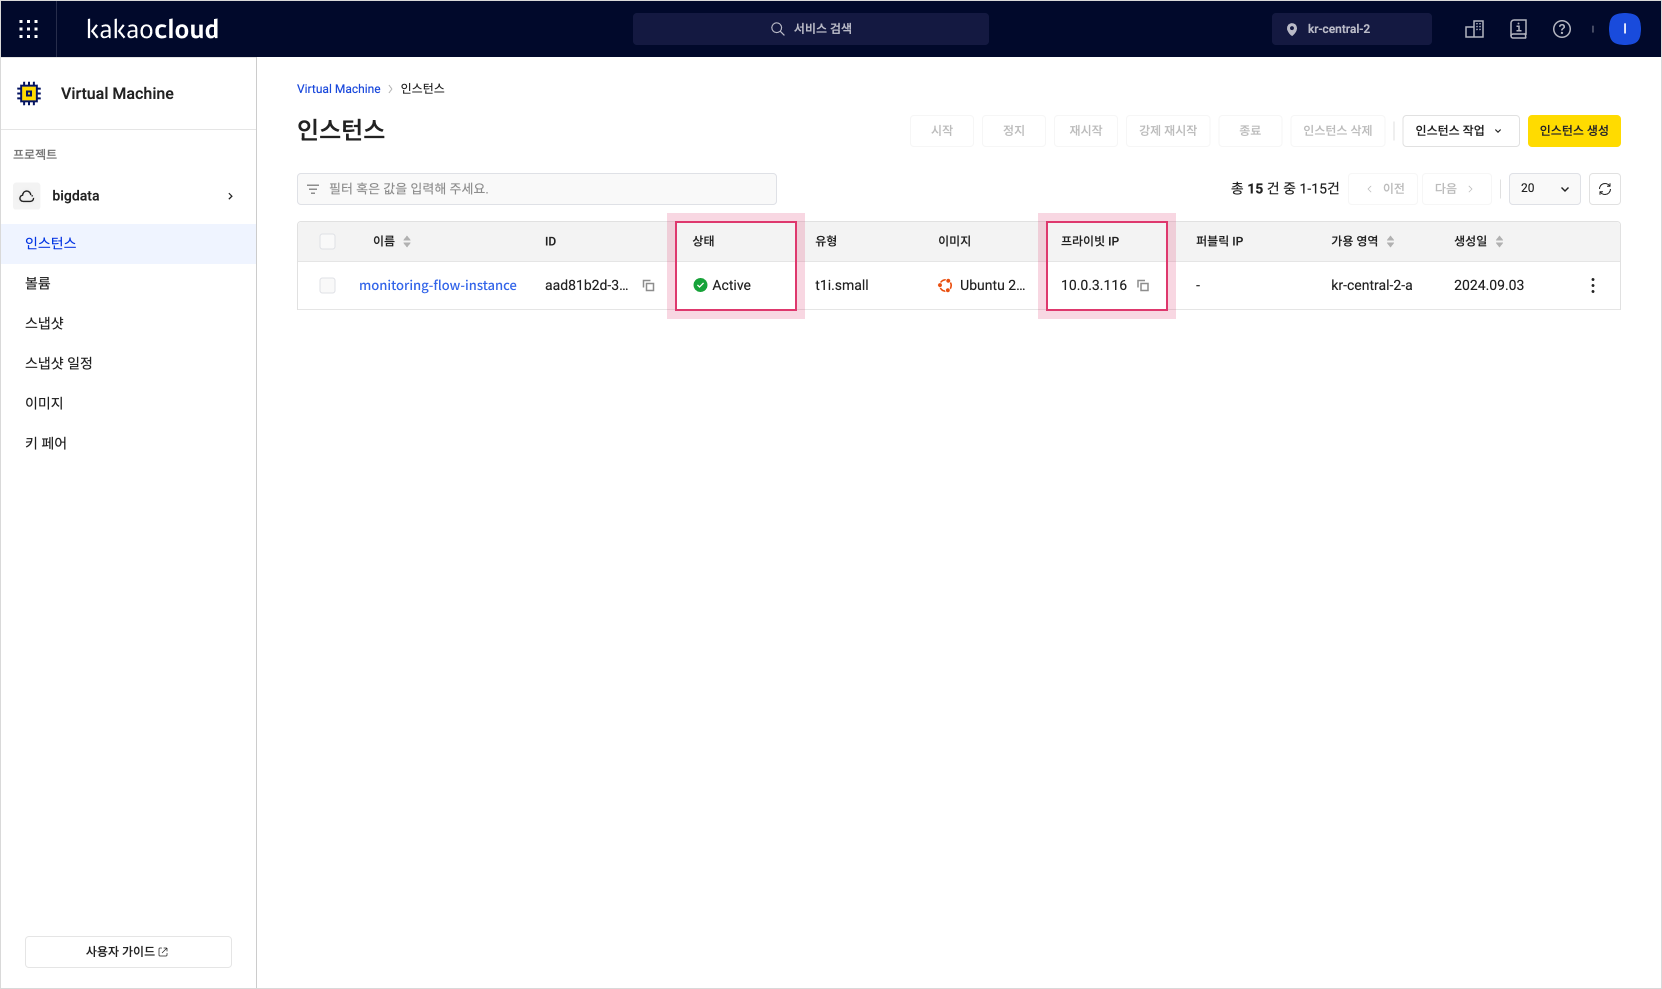 Instance List
 - When the instance status shows as
Step 2. Create a Flow Connection
Create a flow connection to allow access to the VPC and subnet where the VM instance is located.
-
Go to KakaoCloud console > Management > Monitoring Flow > Flow Connections.
-
Select the [Create Flow Connection] button to go to the creation screen.
-
In the VPC Selection section, choose the active VPC registered with the security group.
-
From the subnets connected to the VPC, select the subnet to connect with the flow connection.
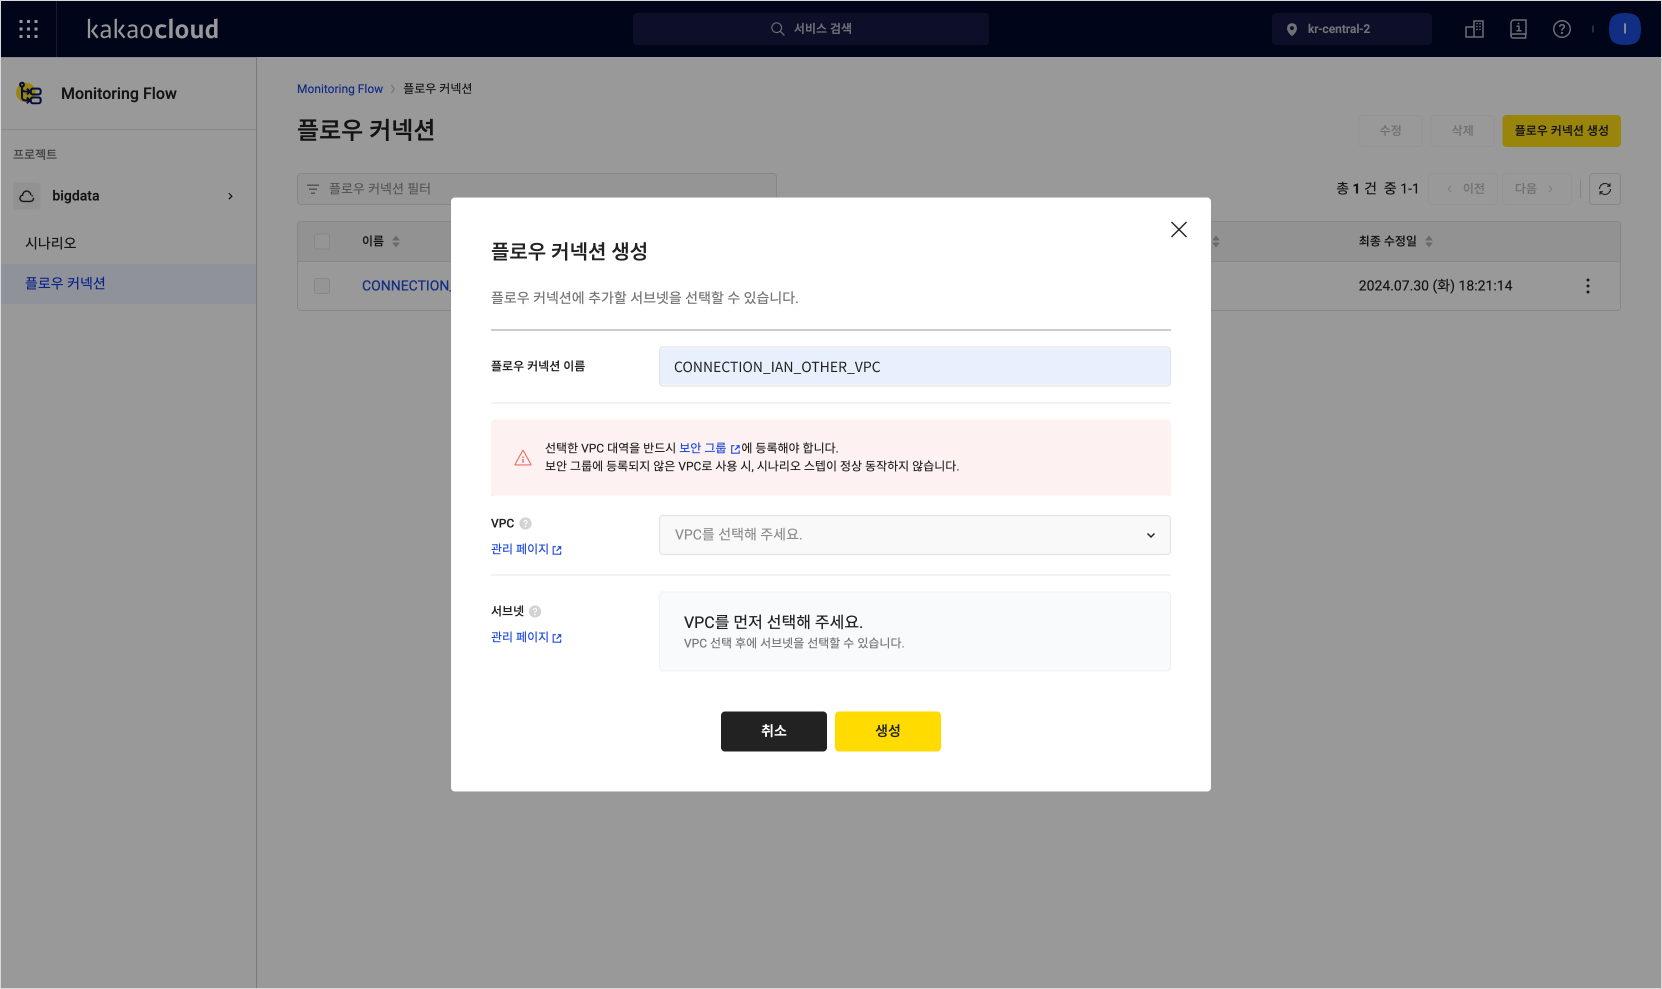 Create Flow Connection
Step 3. Create a Scenario
Create a scenario to monitor the status of the VM instance in Monitoring Flow and set the execution schedule.
-
Go to KakaoCloud console > Management > Monitoring Flow > Scenarios.
-
Select the [Create Scenario] button to go to the creation screen.
-
Select the Use KakaoCloud VPC option to configure access to KakaoCloud's internal resources.
-
Choose one of the registered flow connections.
-
Set the execution schedule for the scenario.
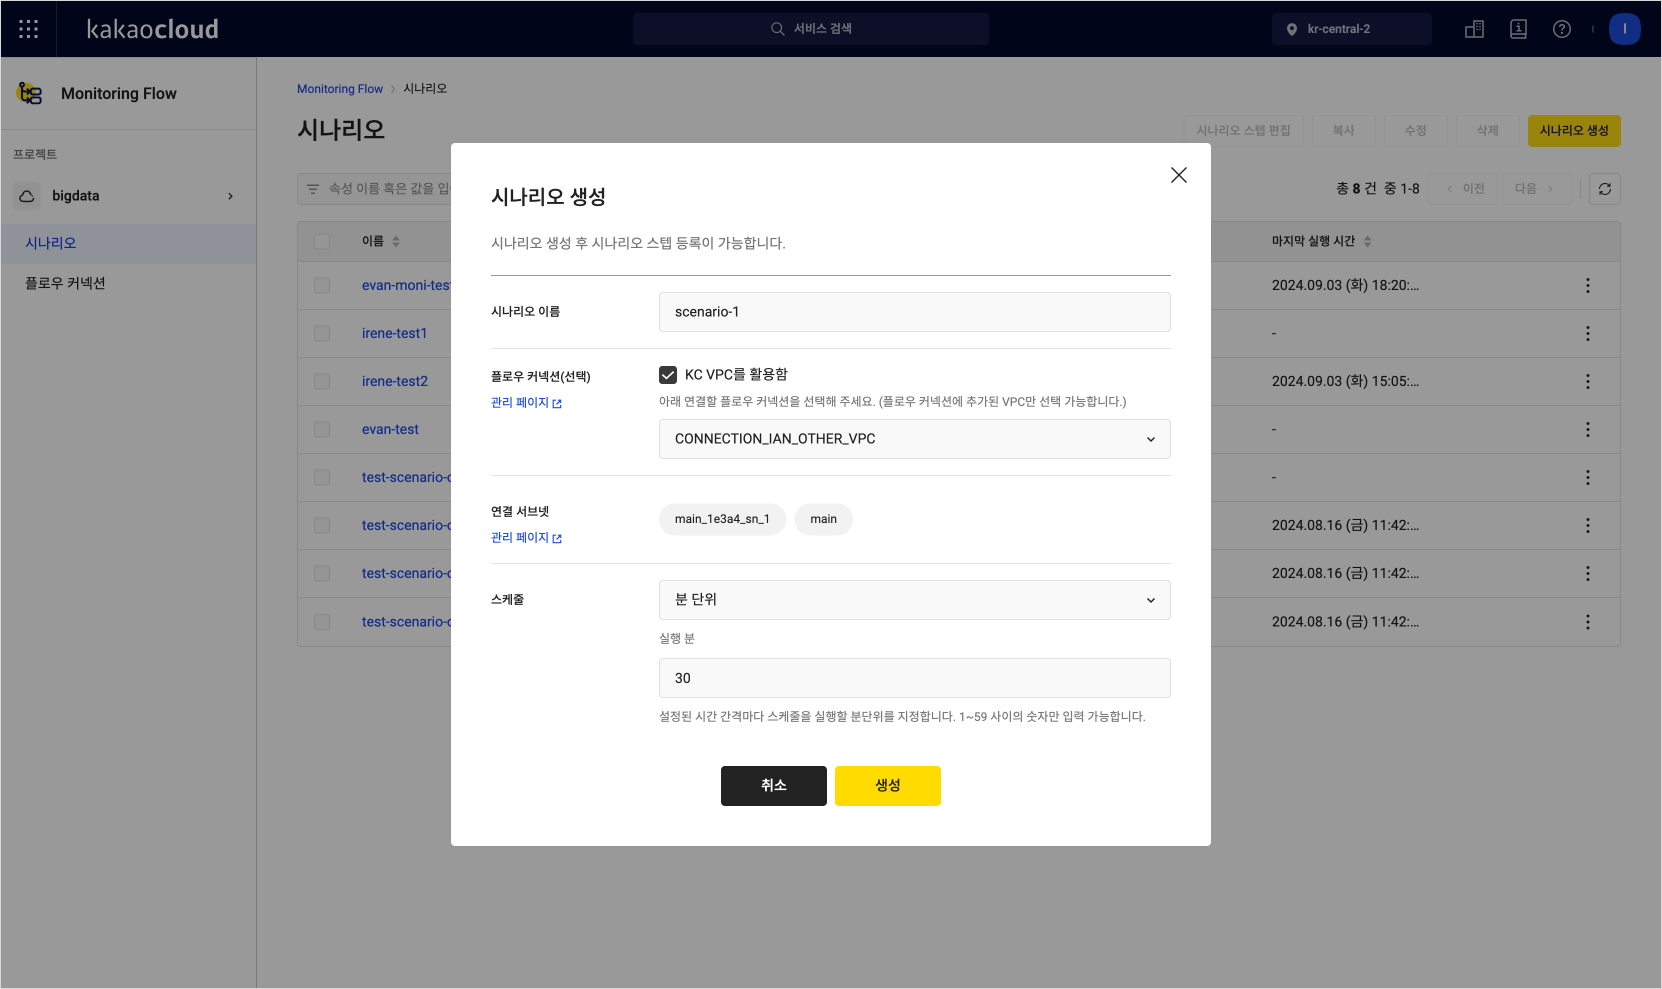 Create Scenario
Step 4. Add Scenario Step: API
Compose the scenario by adding several steps. In this example, we add an API step to check the status of the API server.
-
Go to KakaoCloud console > Management > Monitoring Flow > Scenarios.
-
Select the name of the scenario you created in the Scenarios menu.
-
In the Details tab, select [Add Scenario Step].
-
In the right panel, select API as the step type.
-
Fill out the fields as follows:
Item Example Description Type API Select API Step Name API-1 Step Name Expected Code 200The server should return a 200status code if it is functioning correctly, indicating availabilityMethod GET Use HTTP GET to check the API server's status URL http:// {Private-IP}API access URL (use the private IP of the Virtual Machine instance)  Add API Step
Step 5. Test the Scenario
Check the test execution result of the scenario you created. If a 200 response is returned from the URL configured in Step 4, it indicates that the API server is functioning correctly. If an unexpected response code is returned, it indicates an issue with the server status, and you can use it to diagnose the error.
-
If the test executes successfully, you will see Success under the [Execution Results] section.
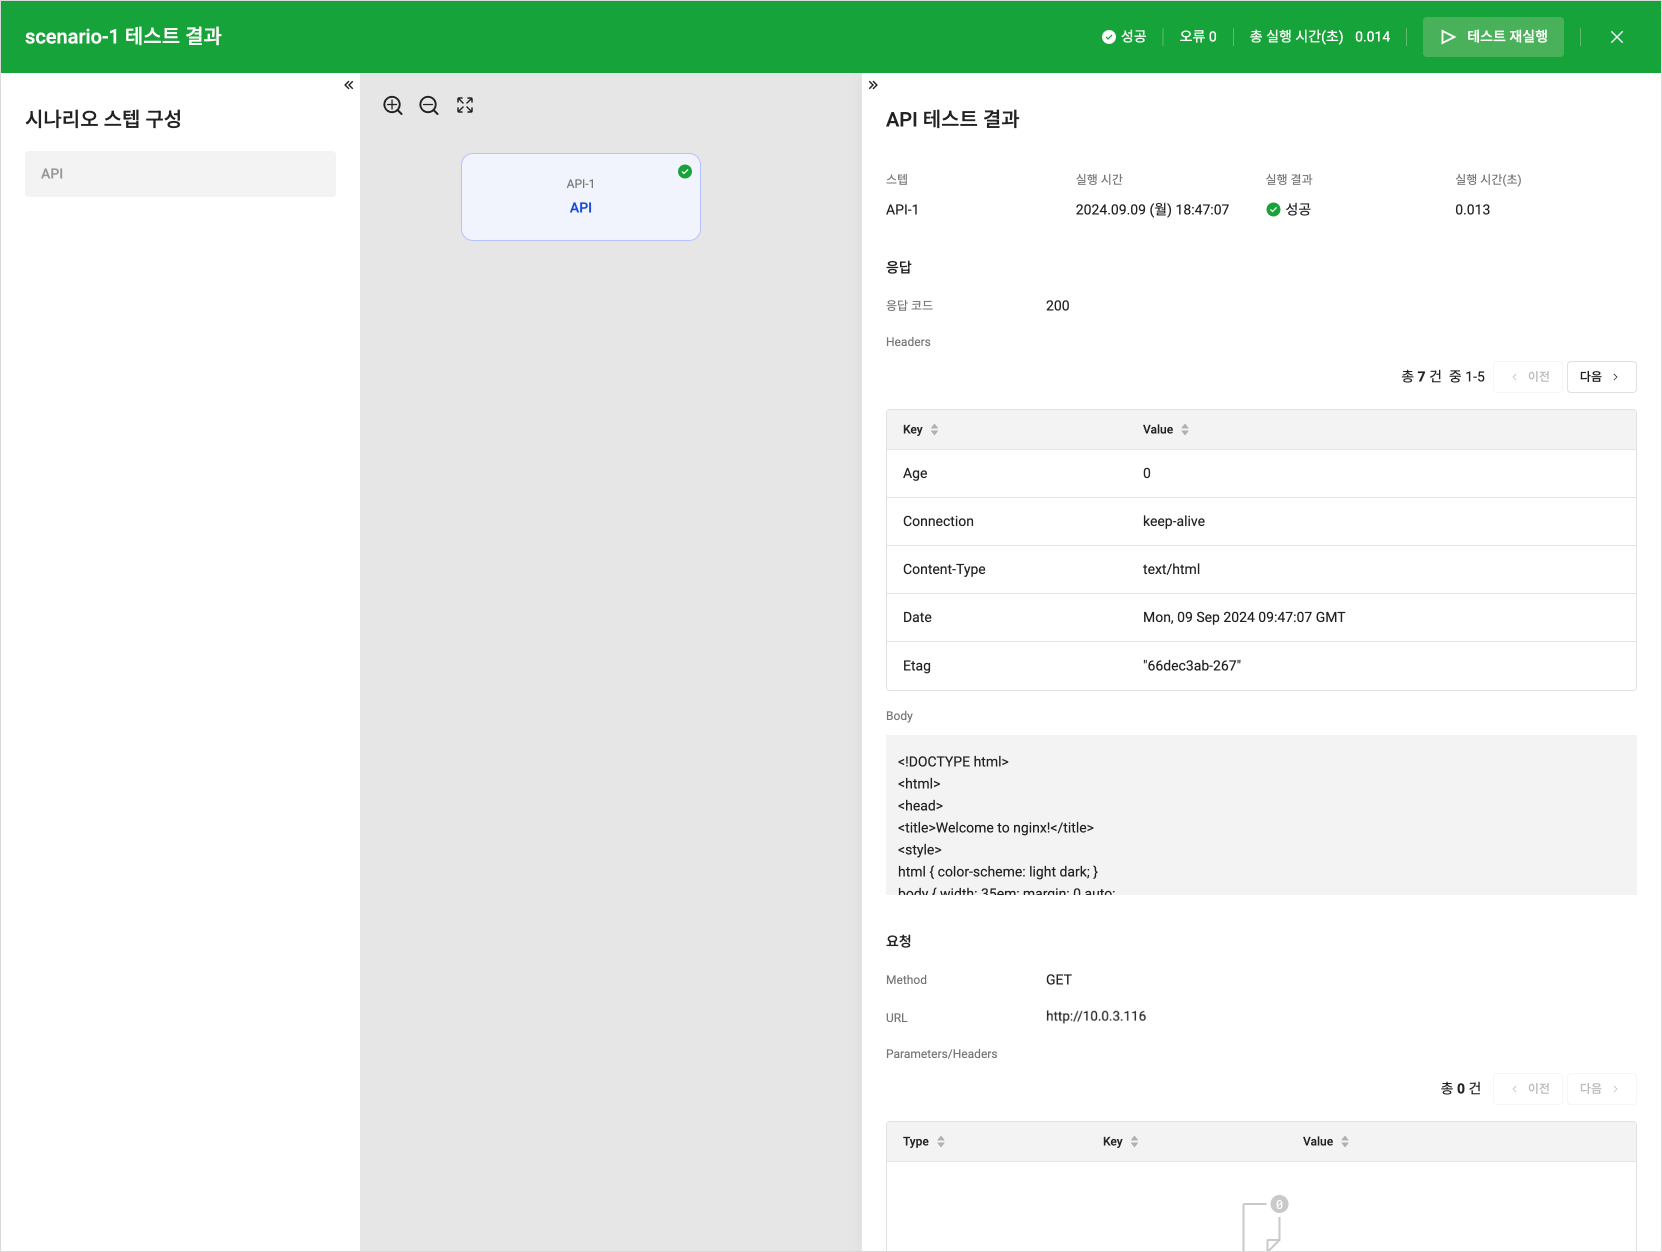 Test Success Result
 -
If a response code different from the expected one is returned, it will be marked as Failure, indicating a potential issue with the server status. At this point, check the error details in the lower right panel to resolve the problem.
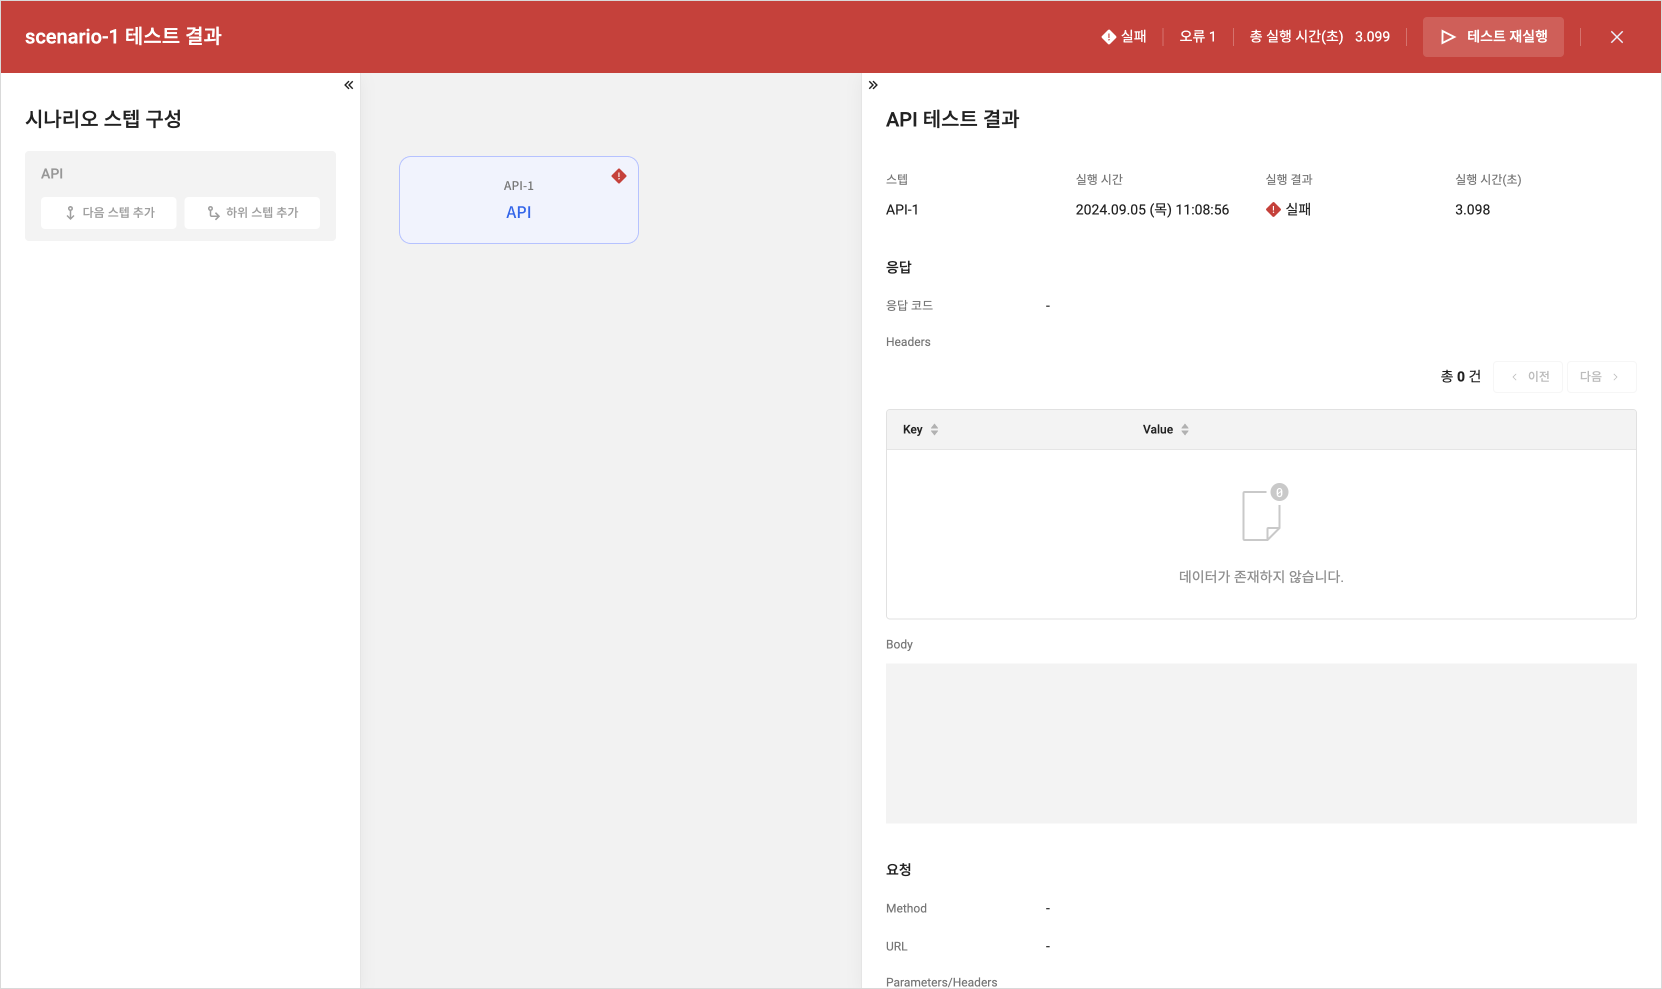 Test Failure Resultcaution
- A call failure error may occur if you access a deactivated instance. Ensure that the correct IP address is entered.
-
After closing the test screen, save the scenario on the Scenario Step Edit screen. The saved scenario will automatically run according to the configured schedule.
Step 6. Check Execution Results
Check the execution results and times of the scenario to evaluate whether it is functioning correctly. You can verify if the scenario completed without errors through detailed information.
-
In the KakaoCloud console, select Management > Monitoring Flow > Scenarios.
-
Choose the scenario you want to check, and select on the Execution Results tab in the detailed view.
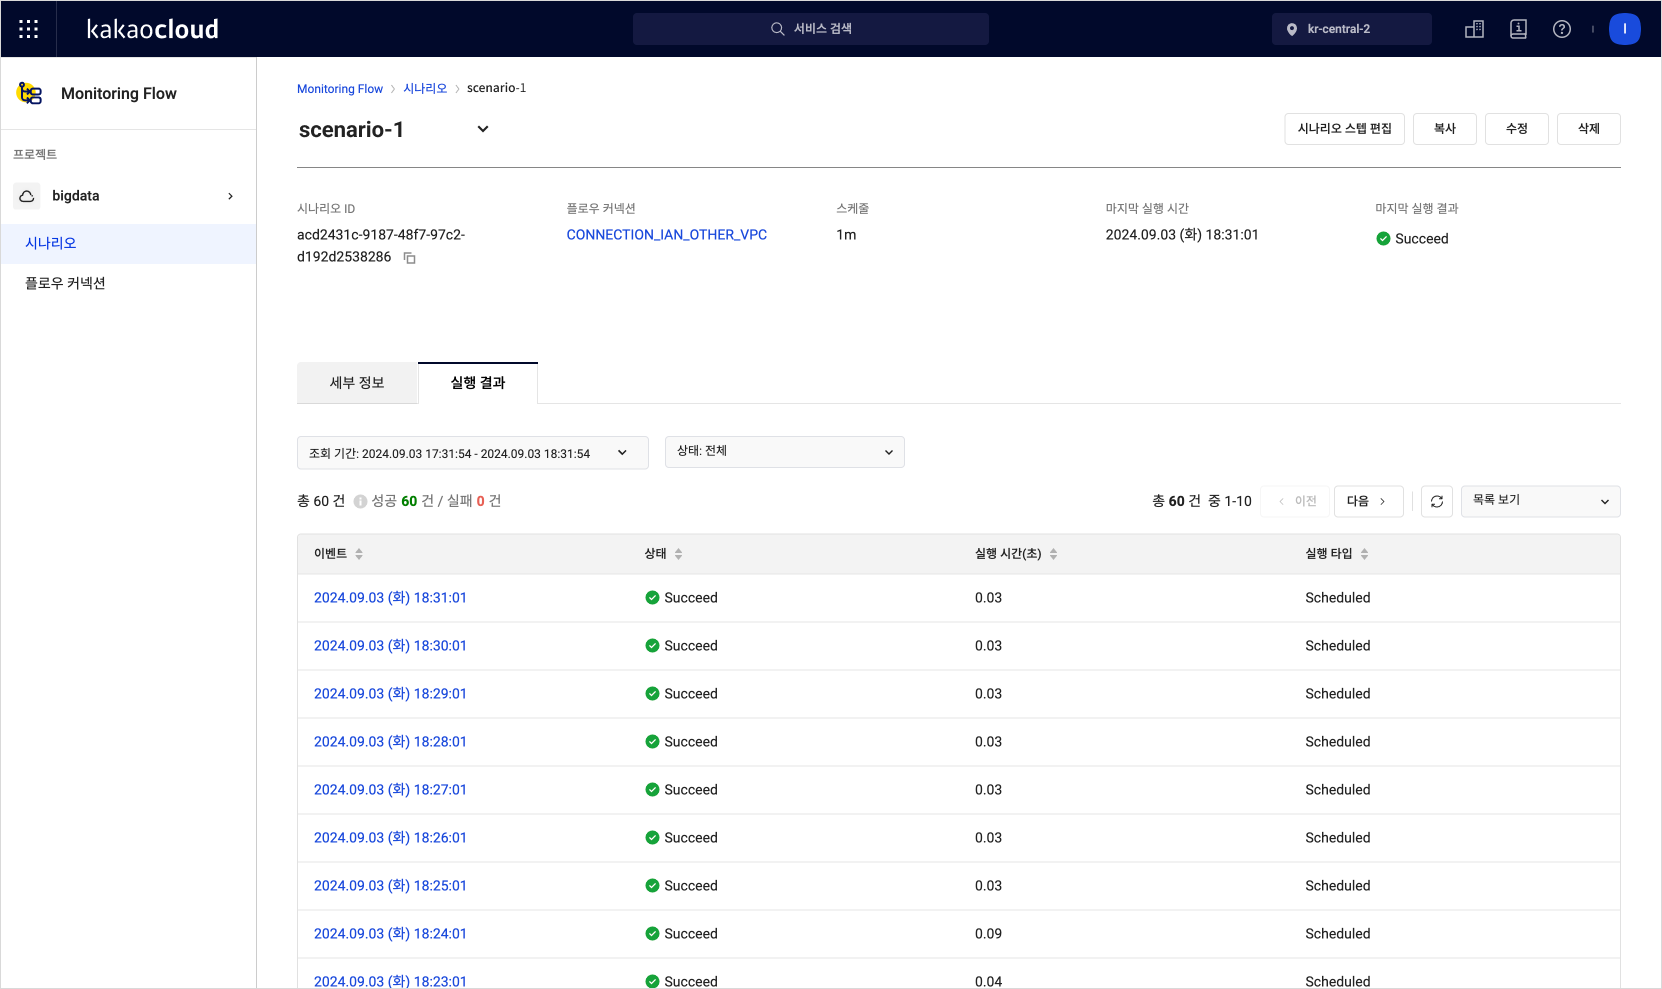 Scenario Execution Results List
 -
In the execution results list, select on an event to view the detailed results.
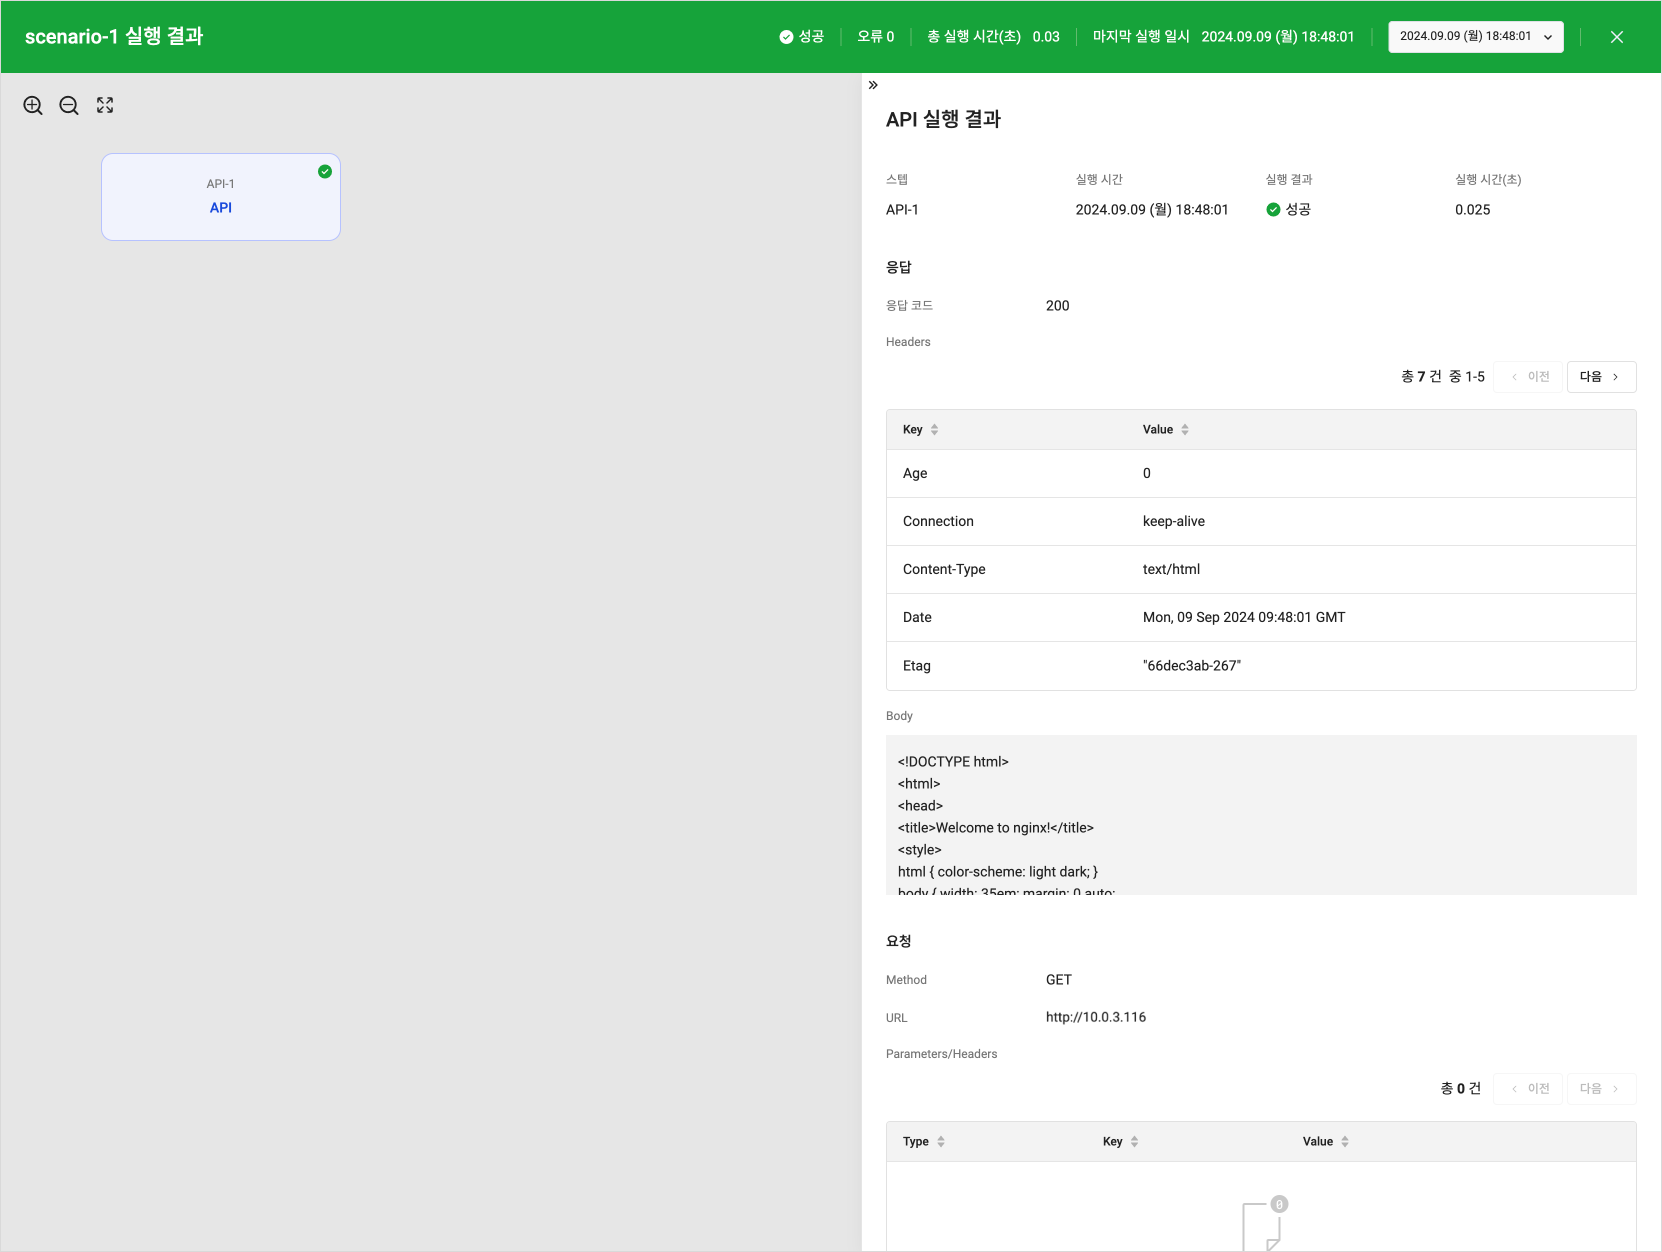 Detailed Scenario Execution Results
Step 7. Create Alert Center Notification Policy
Set an Alert Center notification policy to receive notifications based on the execution results of Monitoring Flow. The example below shows how to configure metric conditions to receive alerts based on the success/failure status of the scenario.
-
In the KakaoCloud console, select Management > Alert Center > Notification Policy. For more details, refer to the Notification Policy Creation document.
-
Refer to the table below to set the notification conditions.
Item Configuration Details Condition Type Metric Service Monitoring Flow Condition Setup Set the metric items to receive success/failure alerts
- SetScenario Success CountandScenario Fail Countfor the scenario to receive all metric alerts
- If you only want to receive alerts on failures, set onlyScenario Fail CountResource Item Select the scenario you want to receive alerts for Threshold 1 count or more Duration 1 minute -
Select the [Next] button at the bottom to complete the creation of the notification policy.
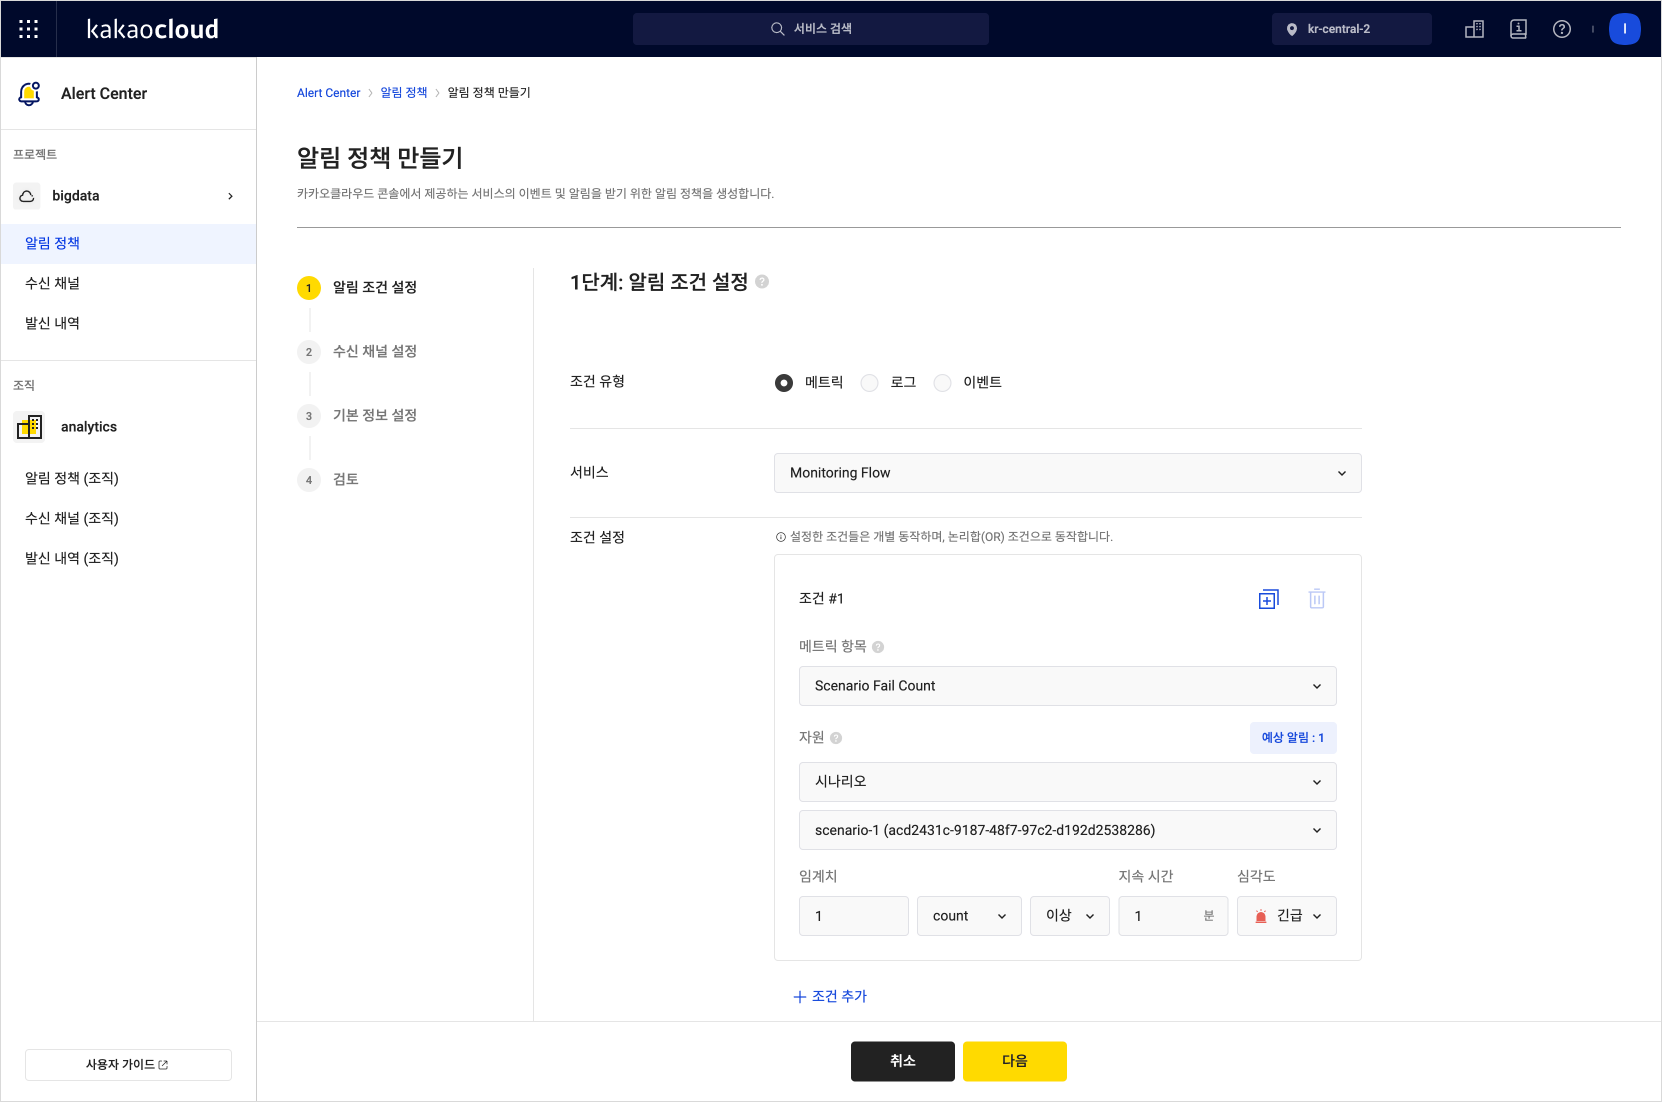 Create Notification Policy
 -
Based on the notification policy you set, you will receive real-time notifications about the execution results (success or failure) of the Monitoring Flow scenario. This helps you quickly detect and respond to system status changes.