Integrate Zabbix and Prometheus for Zabbix dashboard setup
Efficient cloud monitoring plays a critical role in modern business operations. This document guides you through using the Metric Export endpoint provided by KakaoCloud's Monitoring service to collect data and integrate Zabbix with Prometheus to comprehensively monitor cloud service performance, availability, and resource usage through a Zabbix dashboard.
- Estimated time: 30 minutes
- Prerequisites:
- Zabbix Server 4.0+
- Access key
The service is provided only for requests from VMs with Public IPs in kr-central-2 or VMs created in a VPC integrated with an internet gateway in kr-central-2.
Before you start
| Item | Description |
|---|---|
| Install Zabbix Server 4.0+ | Required to connect with the Metric Export endpoint |
| Access key | Obtainable from your user profile in the KakaoCloud console |
API endpoint
https://monitoring.kr-central-2.kakaocloud.com/metric/grafana/{project_id}/prometheus
API list
KakaoCloud's Monitoring service provides the following APIs for Monitoring Metric Export. Each API is compatible with the Prometheus HTTP API.
| API | Description |
|---|---|
/metric/grafana/:id/prometheus/api/v1/series | Returns a list of time series that match the label set. |
/metric/grafana/:id/prometheus/api/v1/query_range | Returns query results over a specified time range. |
/metric/grafana/:id/prometheus/api/v1/query | Returns query results for a single point in time. |
/metric/grafana/:id/prometheus/api/v1/metadata | Returns metadata for metrics. |
/metric/grafana/:id/prometheus/api/v1/labels | Returns a list of label names. |
/metric/grafana/:id/prometheus/api/v1/label/:labelName/values | Returns a list of values for the specified label name. |
Supported metrics for export
The Metric Export feature allows you to view all metrics within your project provided by KakaoCloud's Monitoring service. For a list of supported metrics, refer to Monitoring Metrics > Key Metrics.
API usage example
Retrieve Metric Export metadata
Returns metadata about the metrics.
Request
curl -X GET https://monitoring.kr-central-2.kakaocloud.com/metric/grafana/{project_id}/prometheus/api/v1/metadata \
-H "Credential-ID: {ACCESS_KEY_ID}" \
-H "Credential-Secret: {ACCESS_KEY_SECRET}" \
-H "service-type: {SERVICE_TYPE}"
API call method
| Method | Request URL |
|---|---|
| GET | https://monitoring.kr-central-2.kakaocloud.com/metric/grafana/{project_id}/prometheus/api/v1/metadata |
| Path | Type | Required | Description |
|---|---|---|---|
| project_id | String | Required | KakaoCloud's Project ID |
Request Header
| Item | Type | Required | Description |
|---|---|---|---|
| Credential-ID | String | Required | Access key ID |
| Credential-Secret | String | Required | Access Security Key |
| service-type | String | Required | The type of service to query data from. Supported services: - server for Virtual Machine, GPU, Bare Metal Server - mysql for MySQL - redis for Redis - lb for Load Balancing |
Response
{
    "status":"success",
    "data":{
        "lb_bytes_in_persec":[
            {
                "type":"gauge",
                "help":"인바운드 트래픽",
                "unit":"bytes/s(IEC)"
            }
        ],
        "lb_bytes_out_persec":[
            {
                "type":"gauge",
                "help":"아웃바운드 트래픽",
                "unit":"bytes/s(IEC)"
            }
        ]...
    }
}
View Metric Export query
This returns the result of a query at a single point in time.
Request
curl -X POST https://monitoring.kr-central-2.kakaocloud.com/metric/grafana/{project_id}/prometheus/api/v1/query \
-H "Credential-ID: {ACCESS_KEY_ID}" \
-H "Credential-Secret: {ACCESS_KEY_SECRET}" \
-H "service-type: {SERVICE_TYPE}" \
-d "query={조회할 metric}"
API method
| Method | Request URL |
|---|---|
| POST | https://monitoring.kr-central-2.kakaocloud.com/metric/grafana/{project_id}/prometheus/api/v1/query |
| Path | Type | Required | Description |
|---|---|---|---|
| project_id | String | Required | KakaoCloud's Project ID |
Request header
| Header | Type | Required | Description |
|---|---|---|---|
| Credential-ID | String | Required | Access key ID |
| Credential-Secret | String | Required | Access Security Key |
| service-type | String | Required | Input the service type to query from: - Supported services: ᄂ Virtual Machine, GPU, Bare Metal Server (input: server)ᄂ MySQL (input: mysql)ᄂ Redis (input: redis)ᄂ Load Balancing (input: lb) |
Request body
| Parameter | Type | Required | Description |
|---|---|---|---|
| query | String | Required | Metric to query |
Response
{
    "status":"success",
    "data":{
        "resultType":"vector",
        "result":[
            {
                "metric":{
                "__name__":"lb_bytes_in_persec",
                "lb_id":"c9d6eefe-b100-4663-8114-6fdc7f9d53c9",
                "lb_type":"Network",
                "listener_id":"9bf3d454-dfbd-4861-bd59-729f12886e35"
                },
                "value":[
                1702557658,
                "0"
                ]
            },
        }
}
Zabbix-Prometheus integration
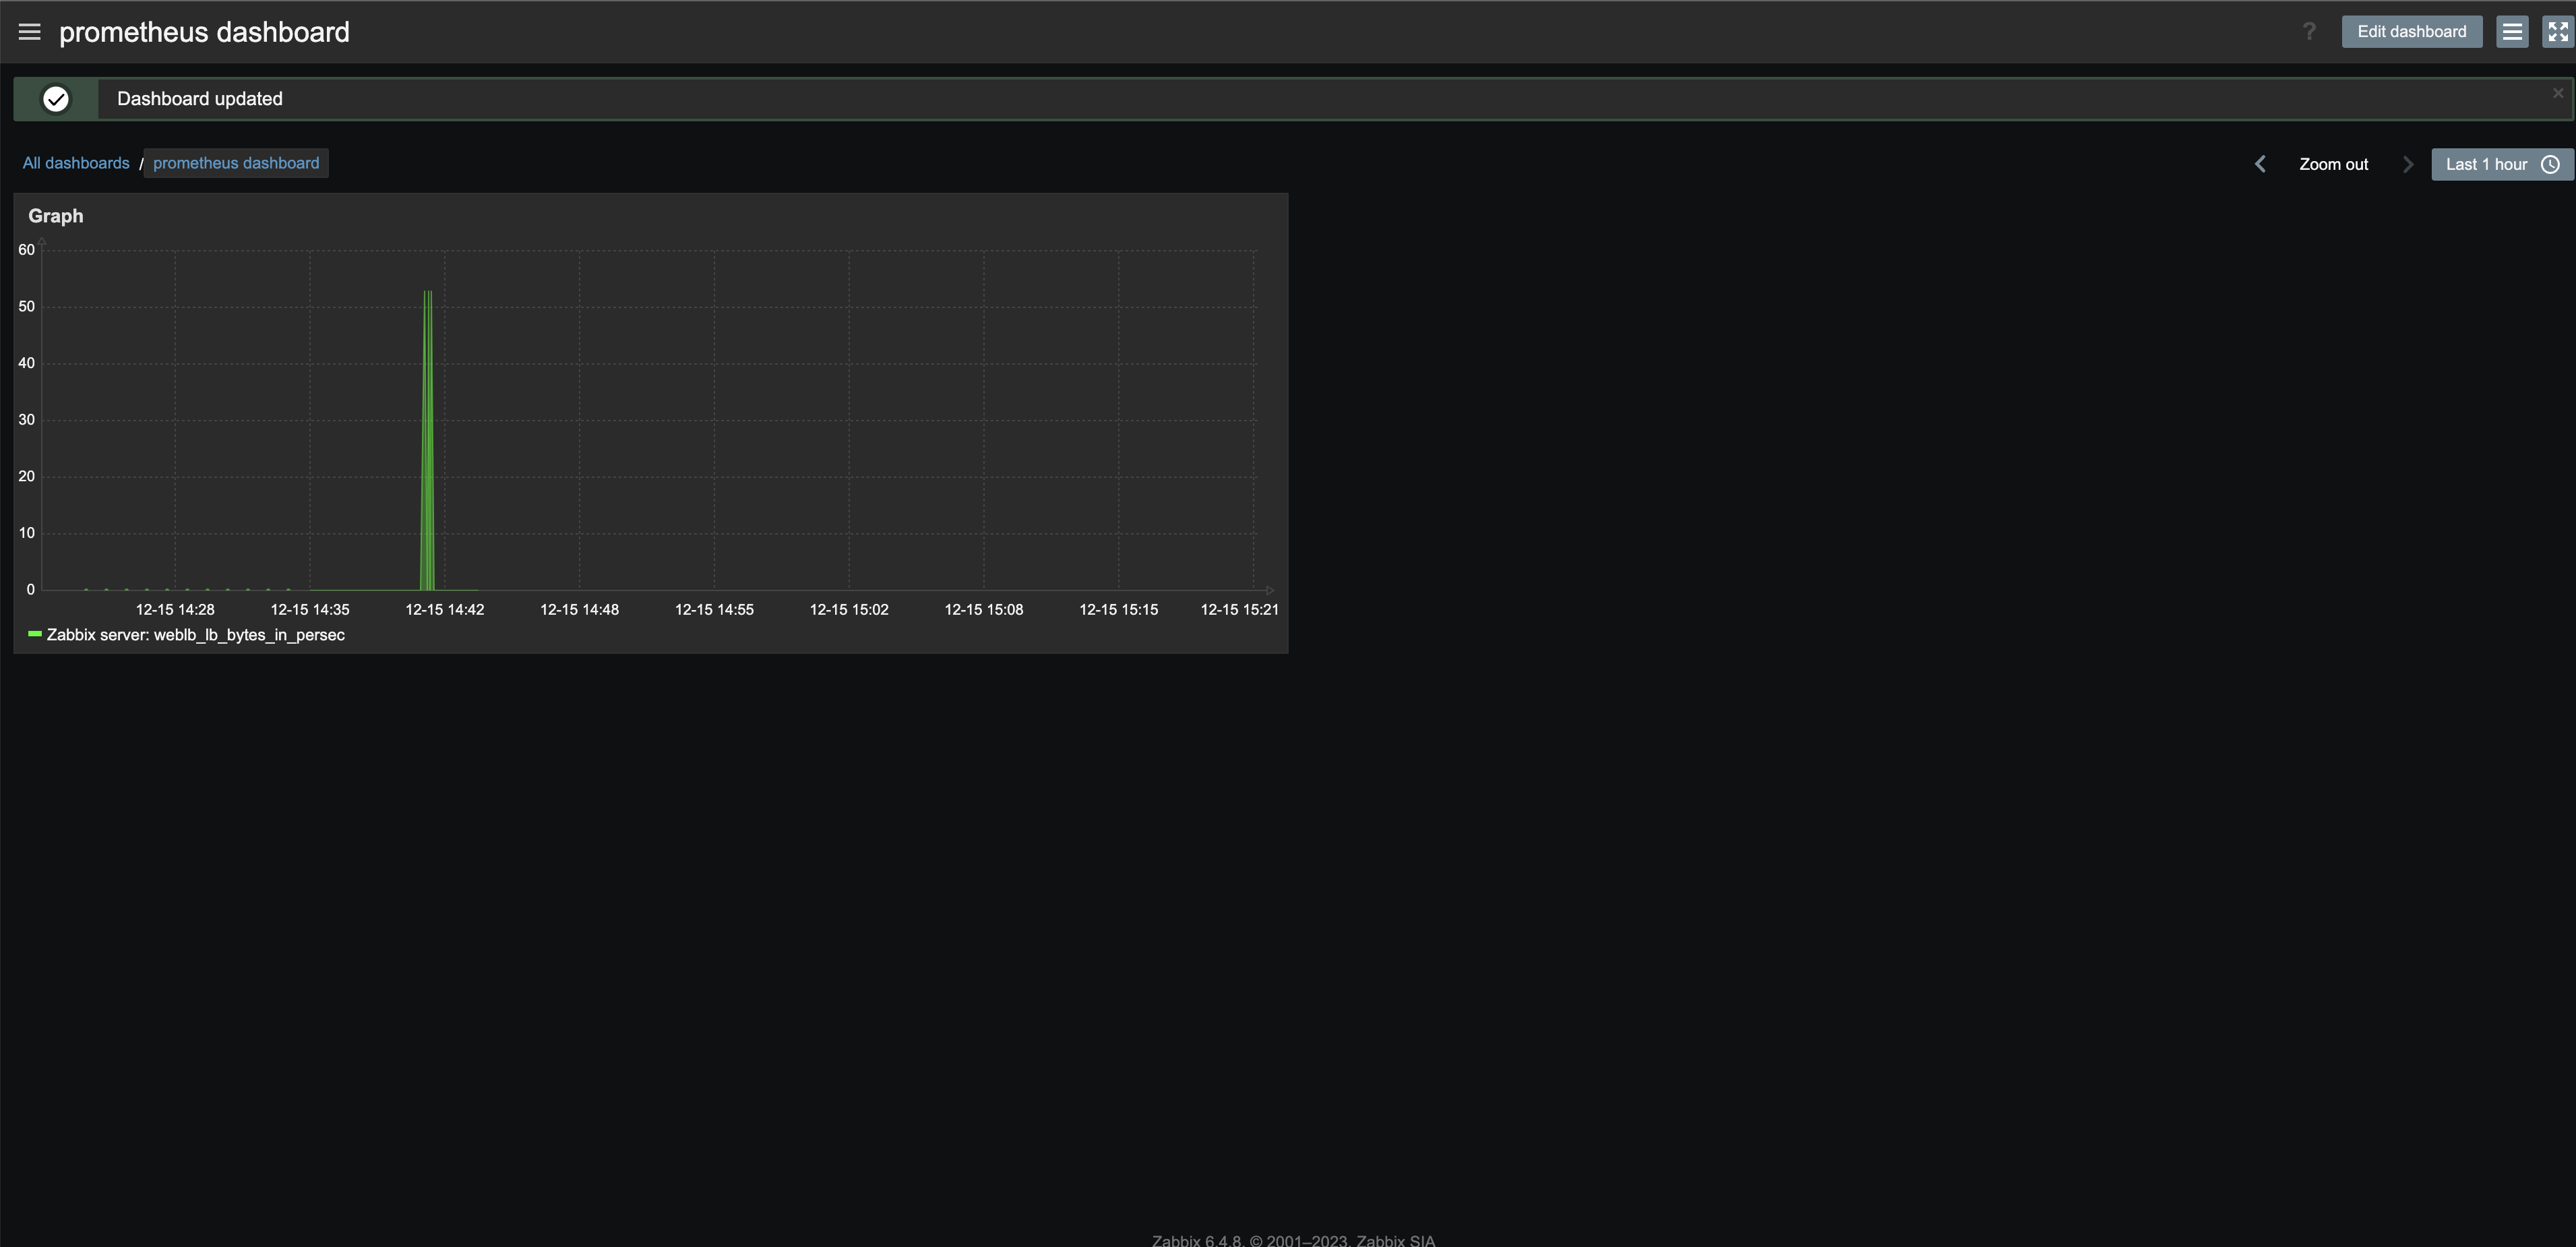
This guide explains how to set up a Zabbix dashboard using KakaoCloud's Monitoring Metric Export endpoint to monitor cloud service performance, availability, and resource usage comprehensively.
Create template
-
In Zabbix, navigate to Data collection > Template groups. Select on [Create template group] to create a Zabbix templates group.
Item Description Group name (Example) kakaocloud 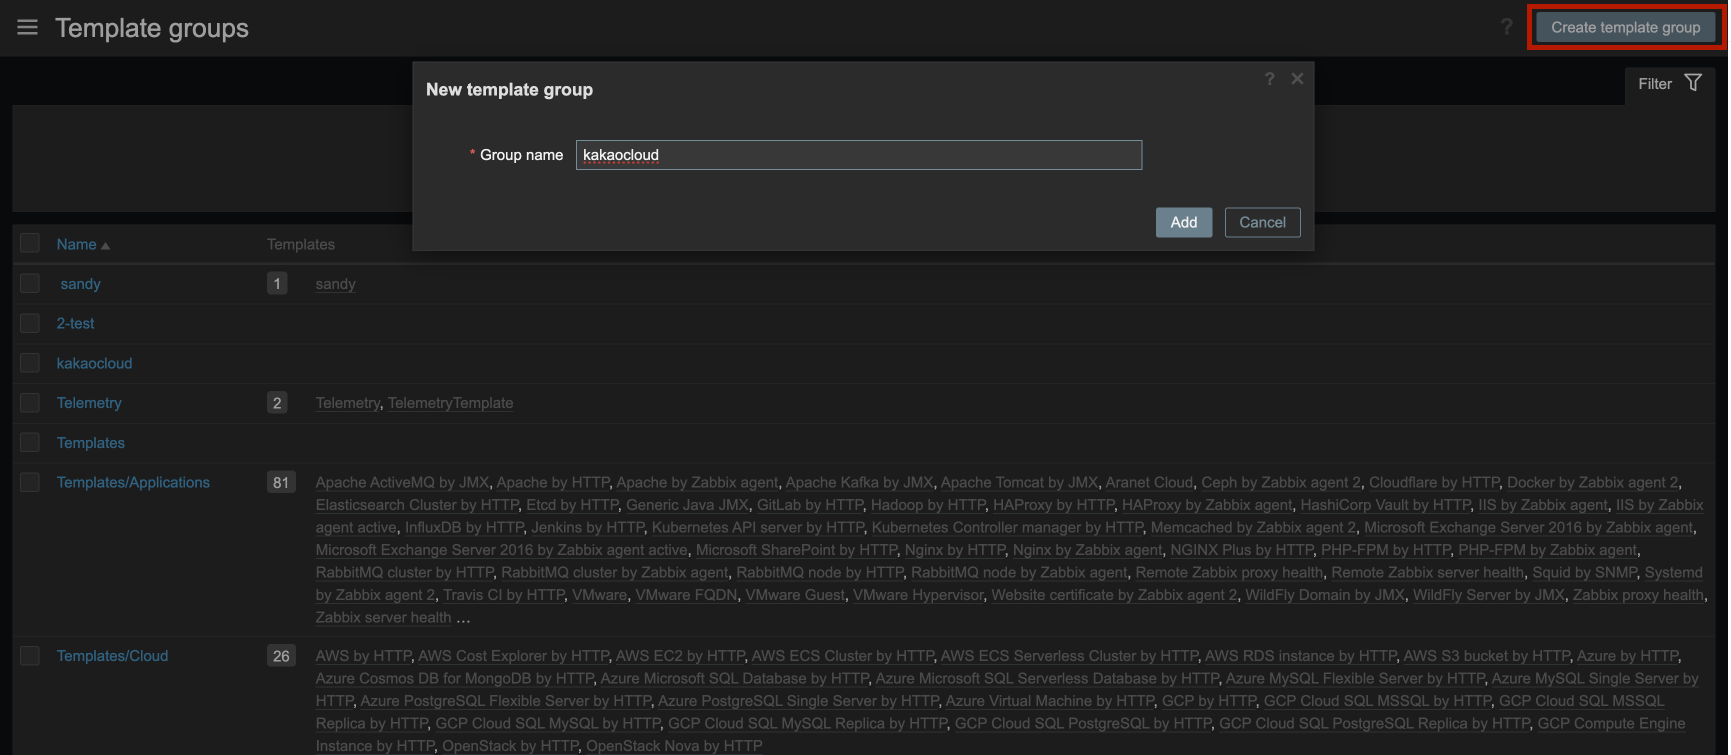
-
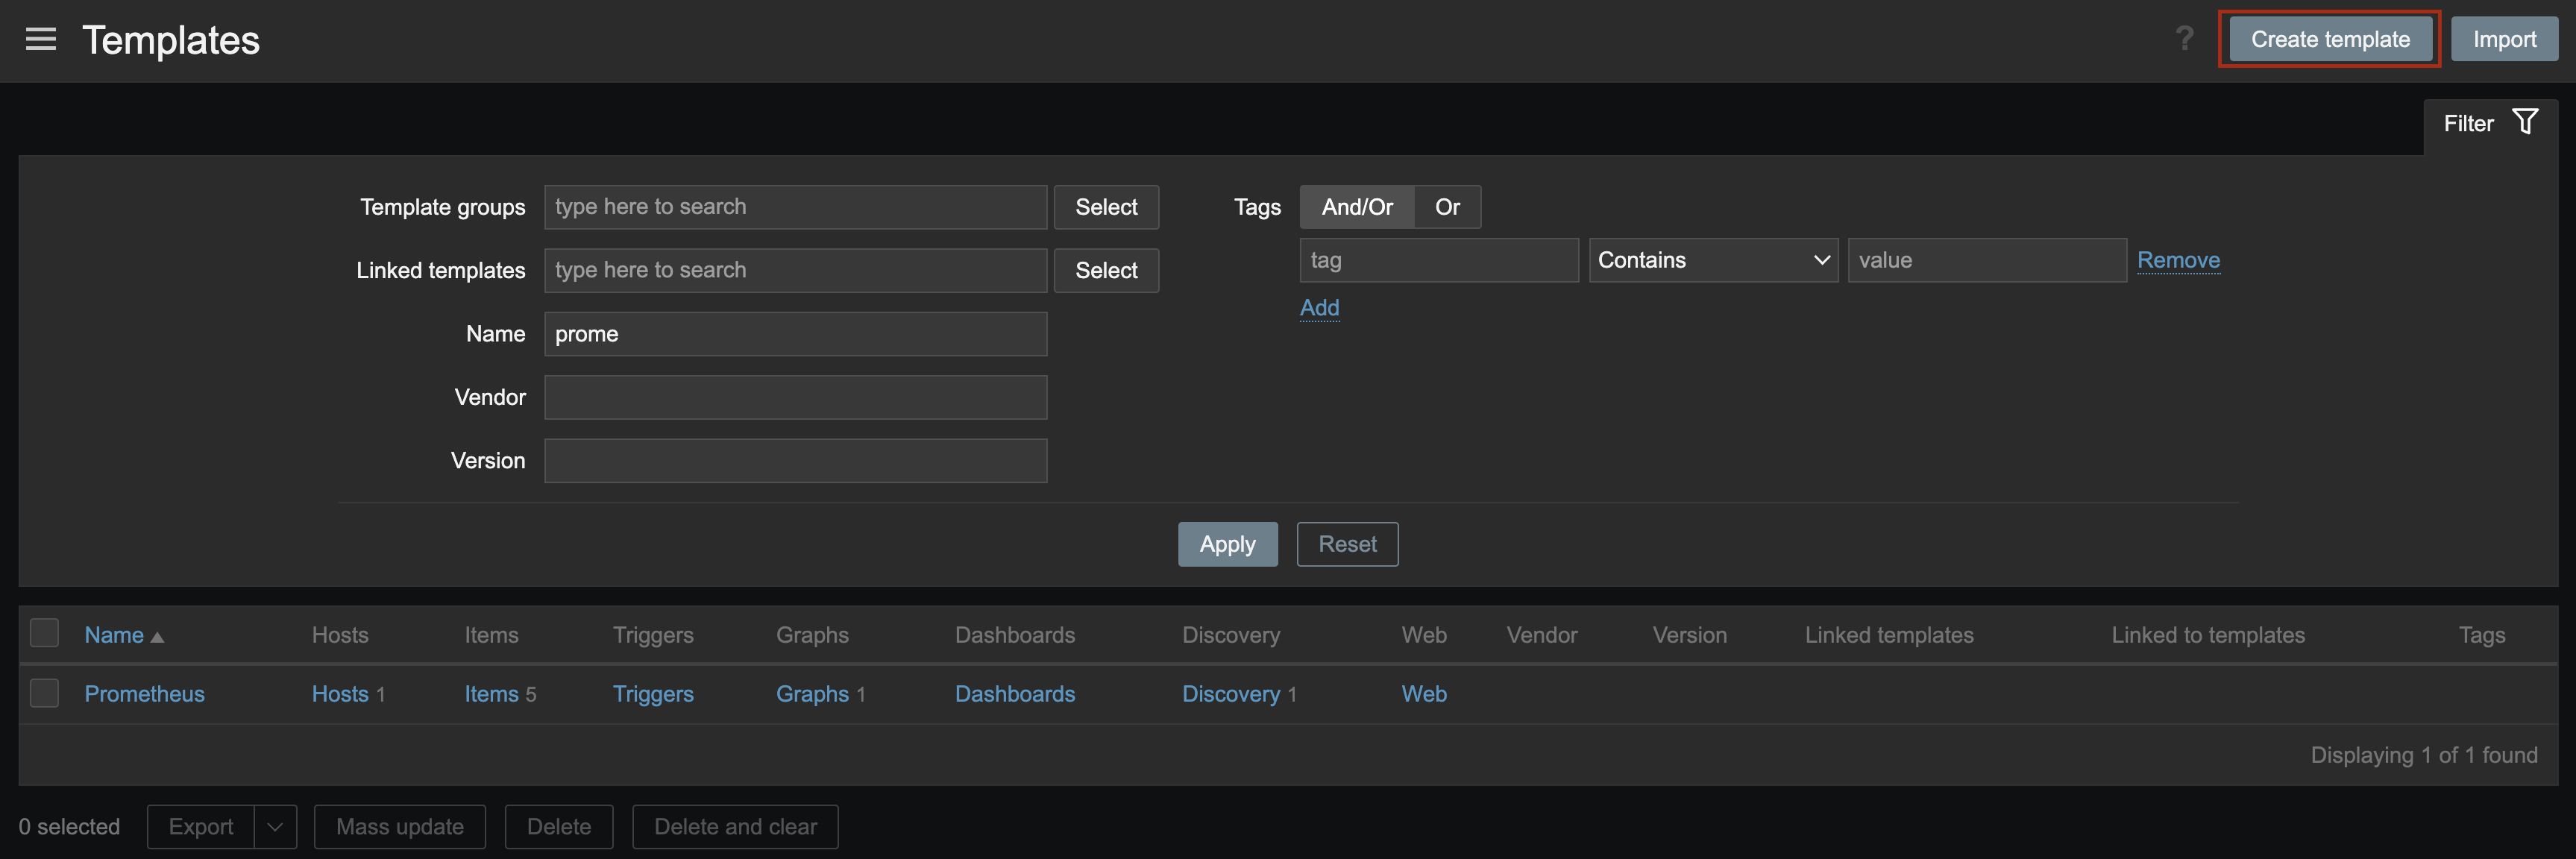
Navigate to Data collection > Templates and select [Create template].
-
Select the template group you created and select [Add].

Create items in template
-
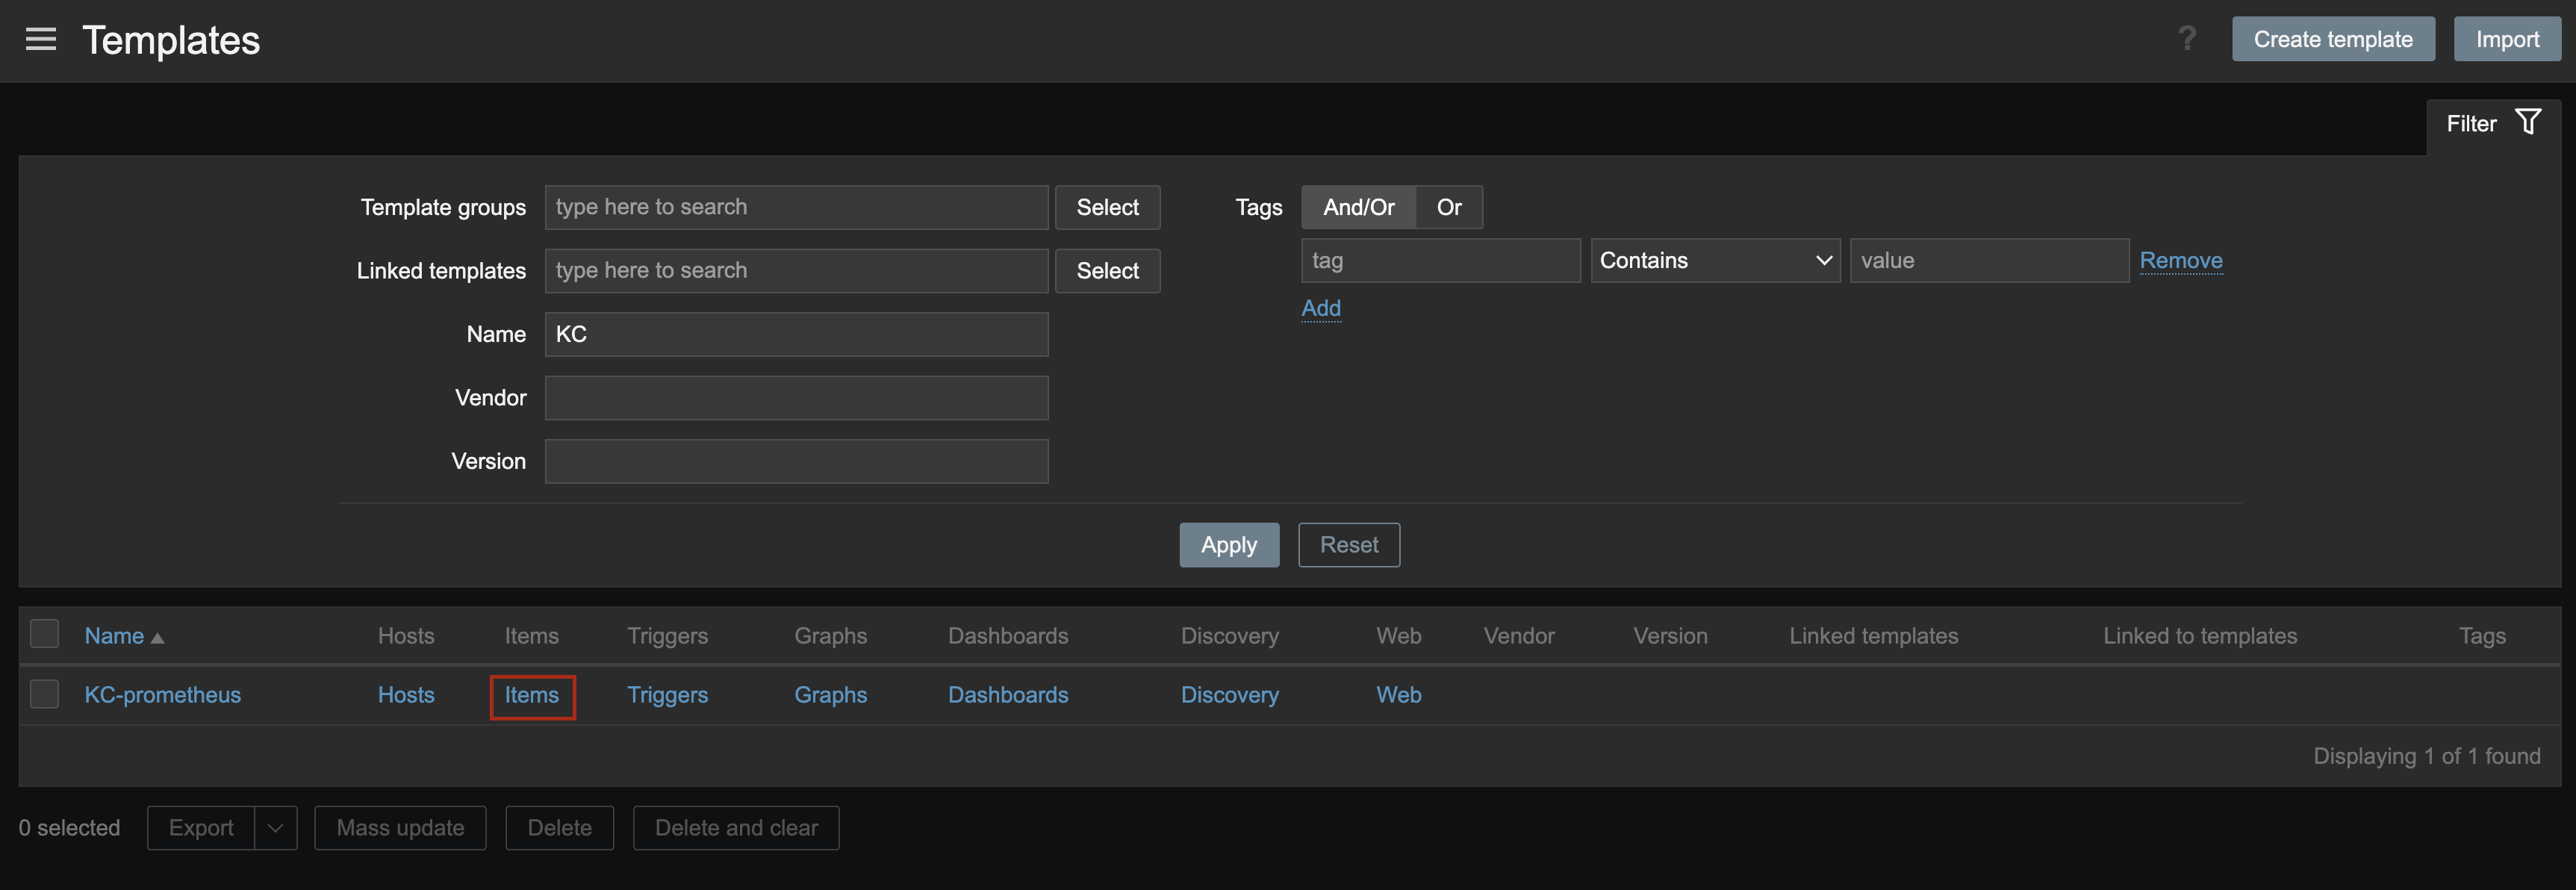
In the Name field, enter the template name and select Items.
-
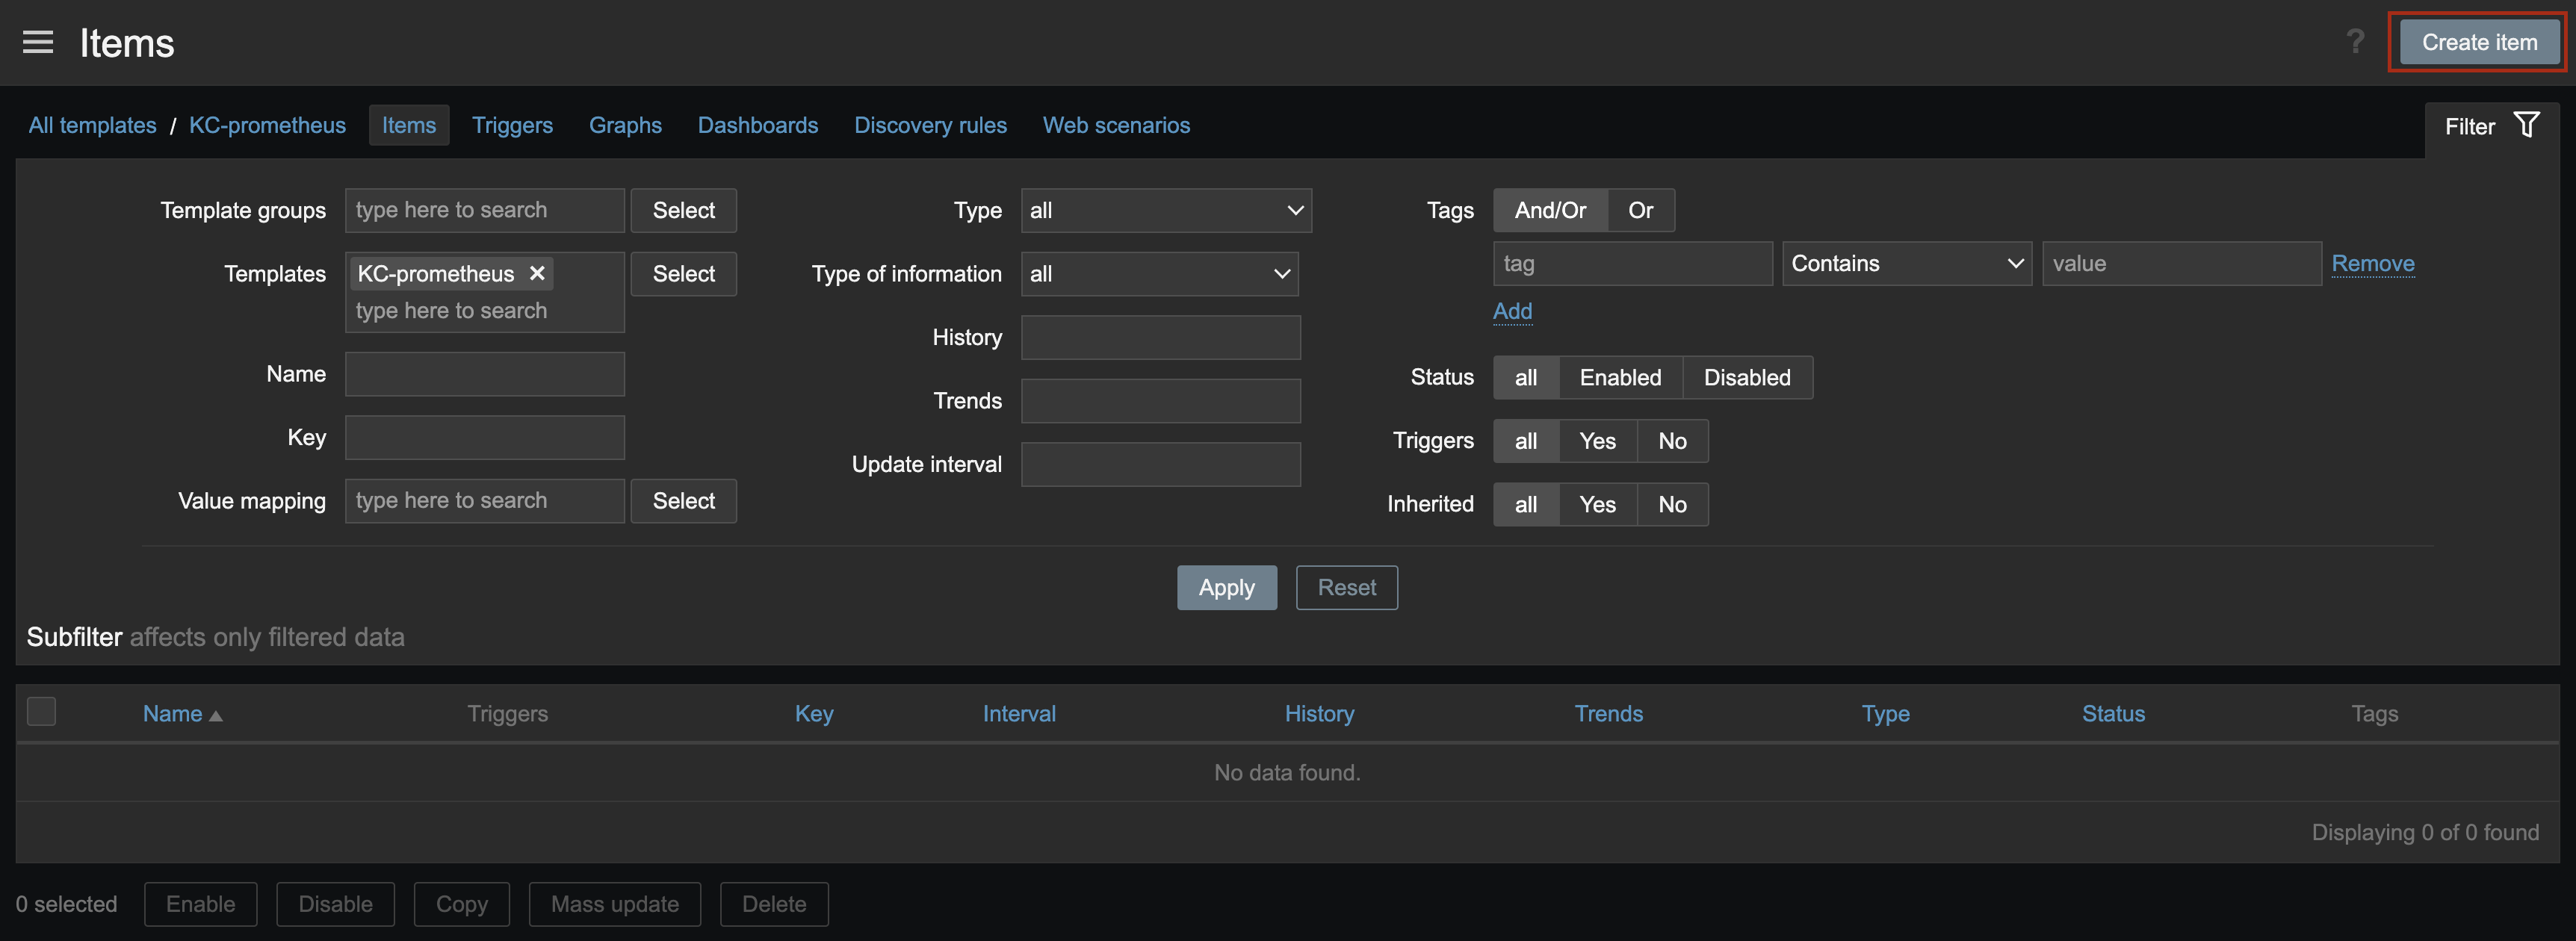
Select [Create Item] to create an item for the template.
-
Fill in the following information and select [Add].
Field Description Name Name of the item Type Select HTTP agentKey Item key Type of information Select Numeric
⚠️ UseTextfor testing purposesURL https://monitoring.kr-central-2.kakaocloud.com/metric/grafana/{project_id}/prometheus/api/v1/queryRequest type POSTRequest body query={metric to query}Headers - Credential-ID:{ACCESS_KEY_ID}
-Credential-Secret:{ACCESS_KEY_SECRET}
-service-type:{SERVICE_TYPE}Update interval Interval for data retrieval -
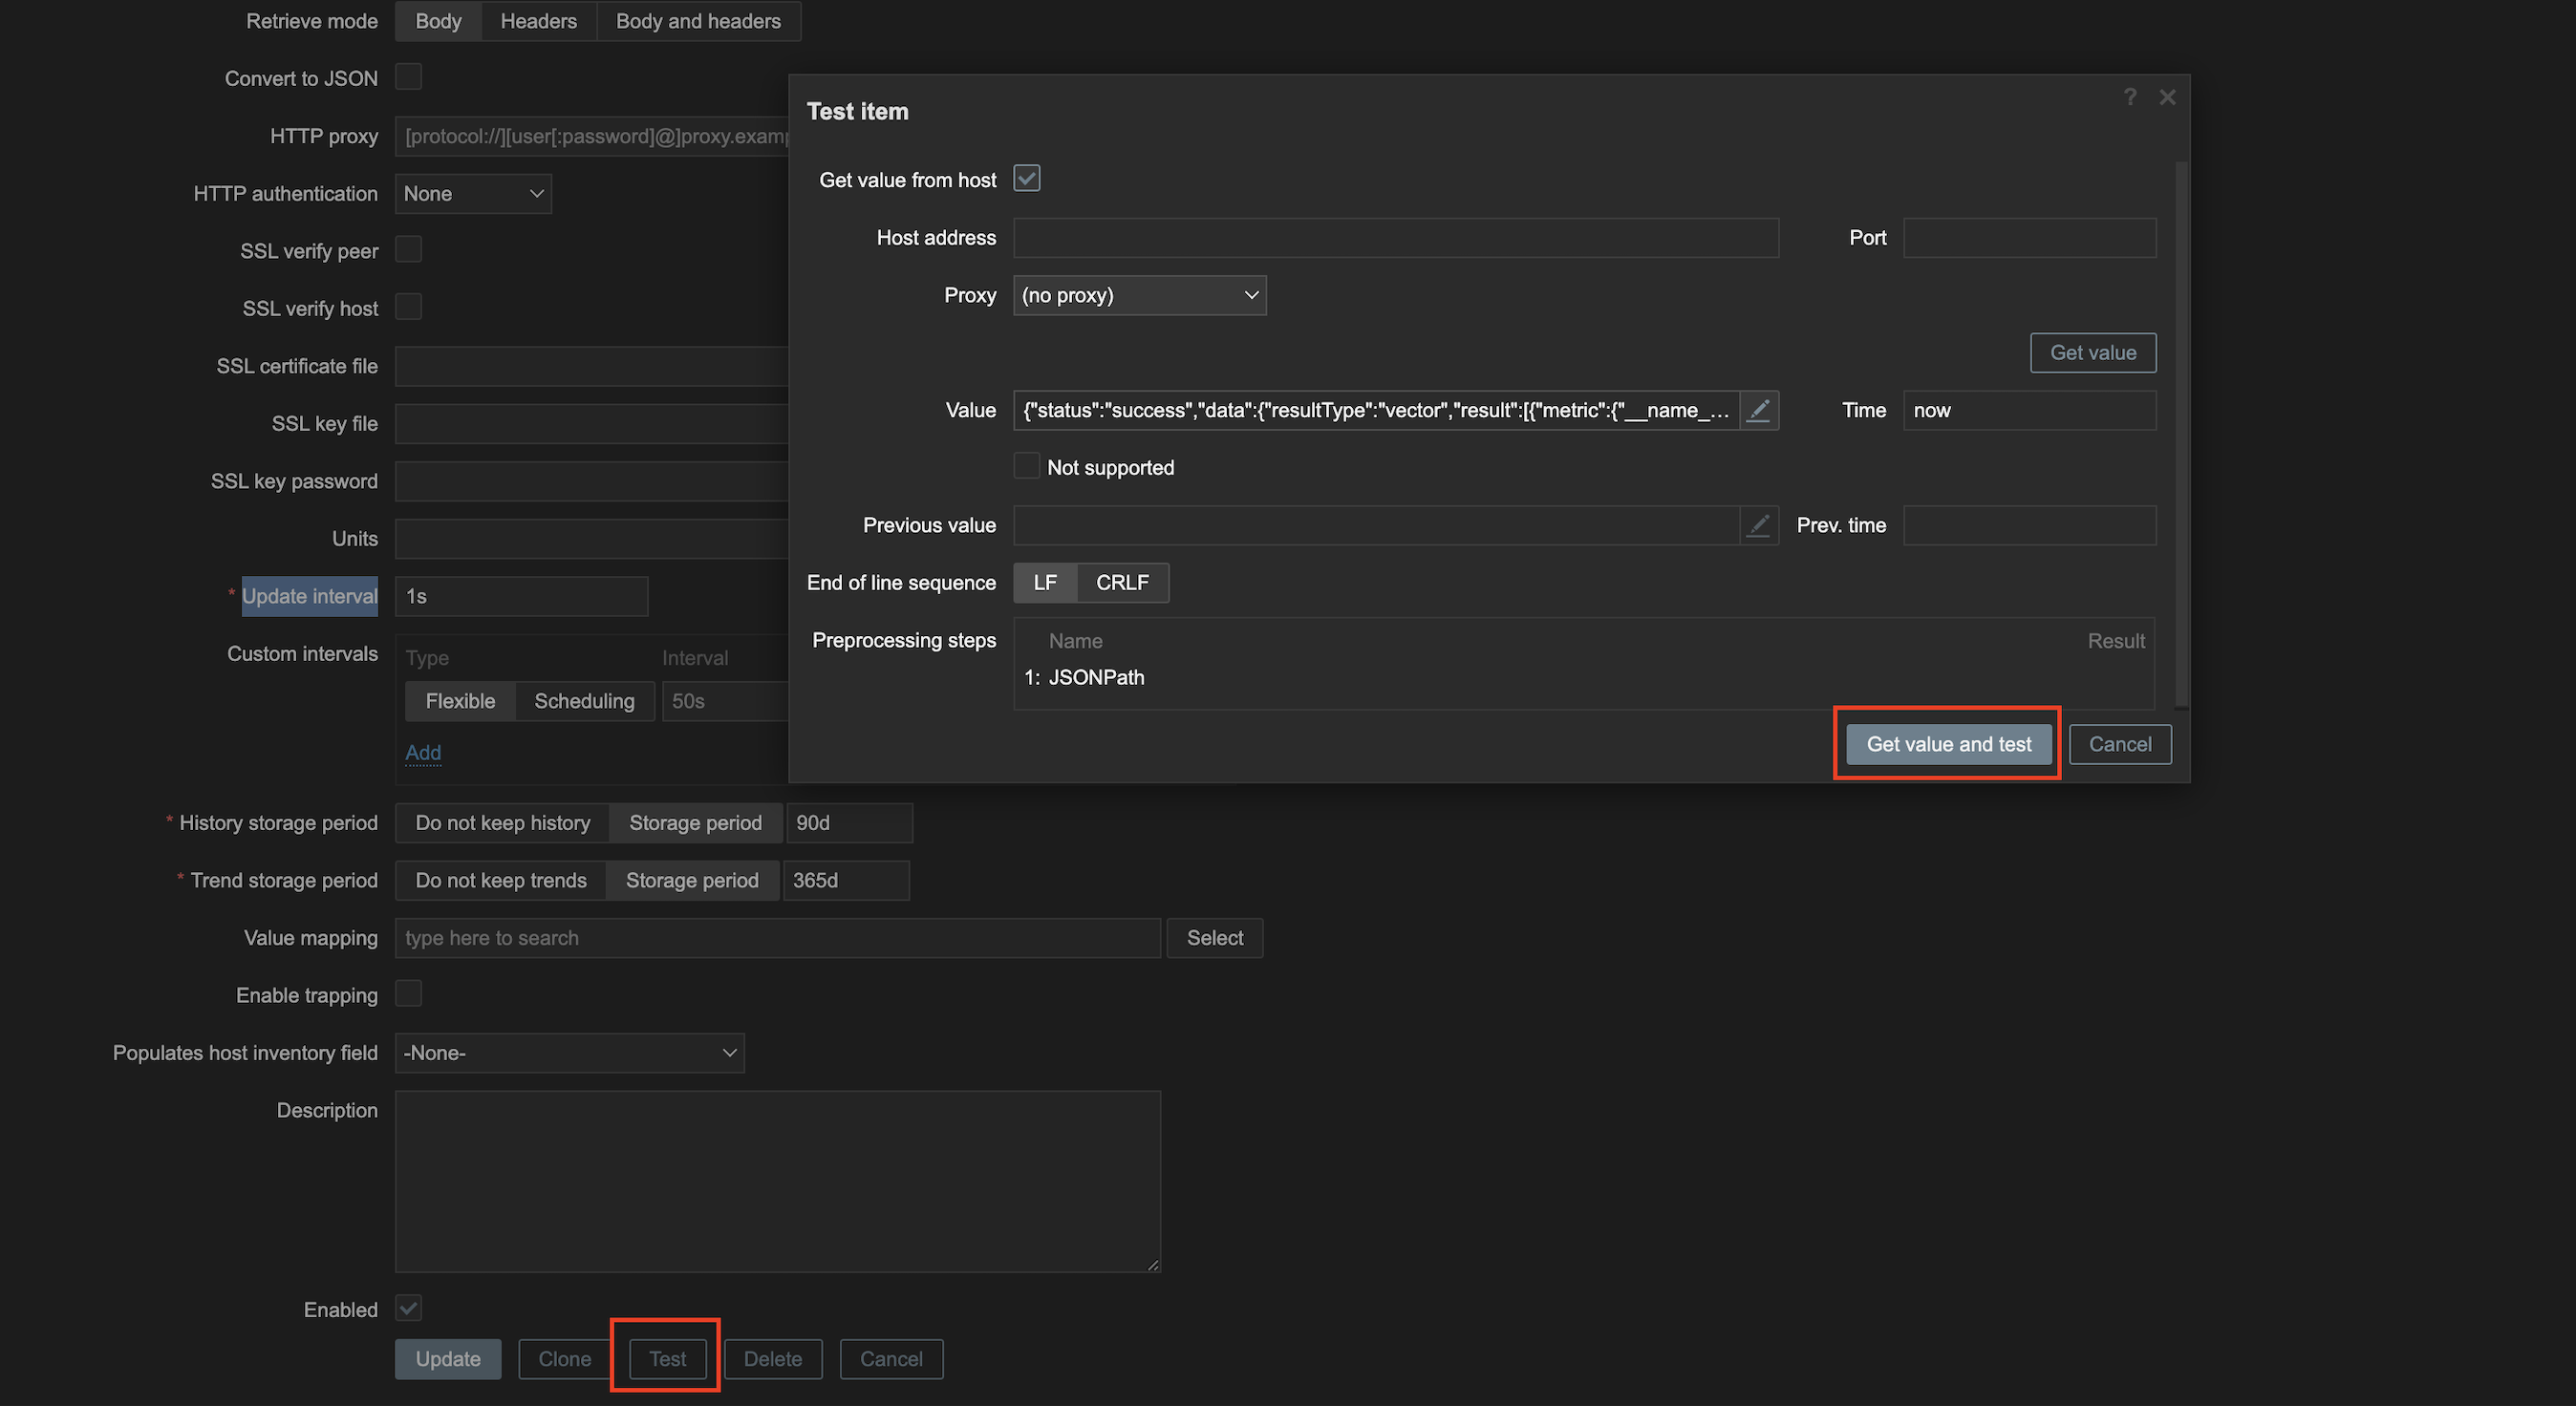
Perform a test to ensure the item retrieves the metrics correctly.
cautionFor testing, change Type of information to
Text. After testing, revert it toNumeric.-
Select [Test] and [Get value and test] to confirm the metrics are retrieved correctly.
-
In the Preprocessing tab, add preprocessing steps to extract specific metric values.

Field Description Name JSONPath Parameters Example: $.data.result[12].value[1]
Useresult[0],result[1], etc., depending on the number of load balancers. -
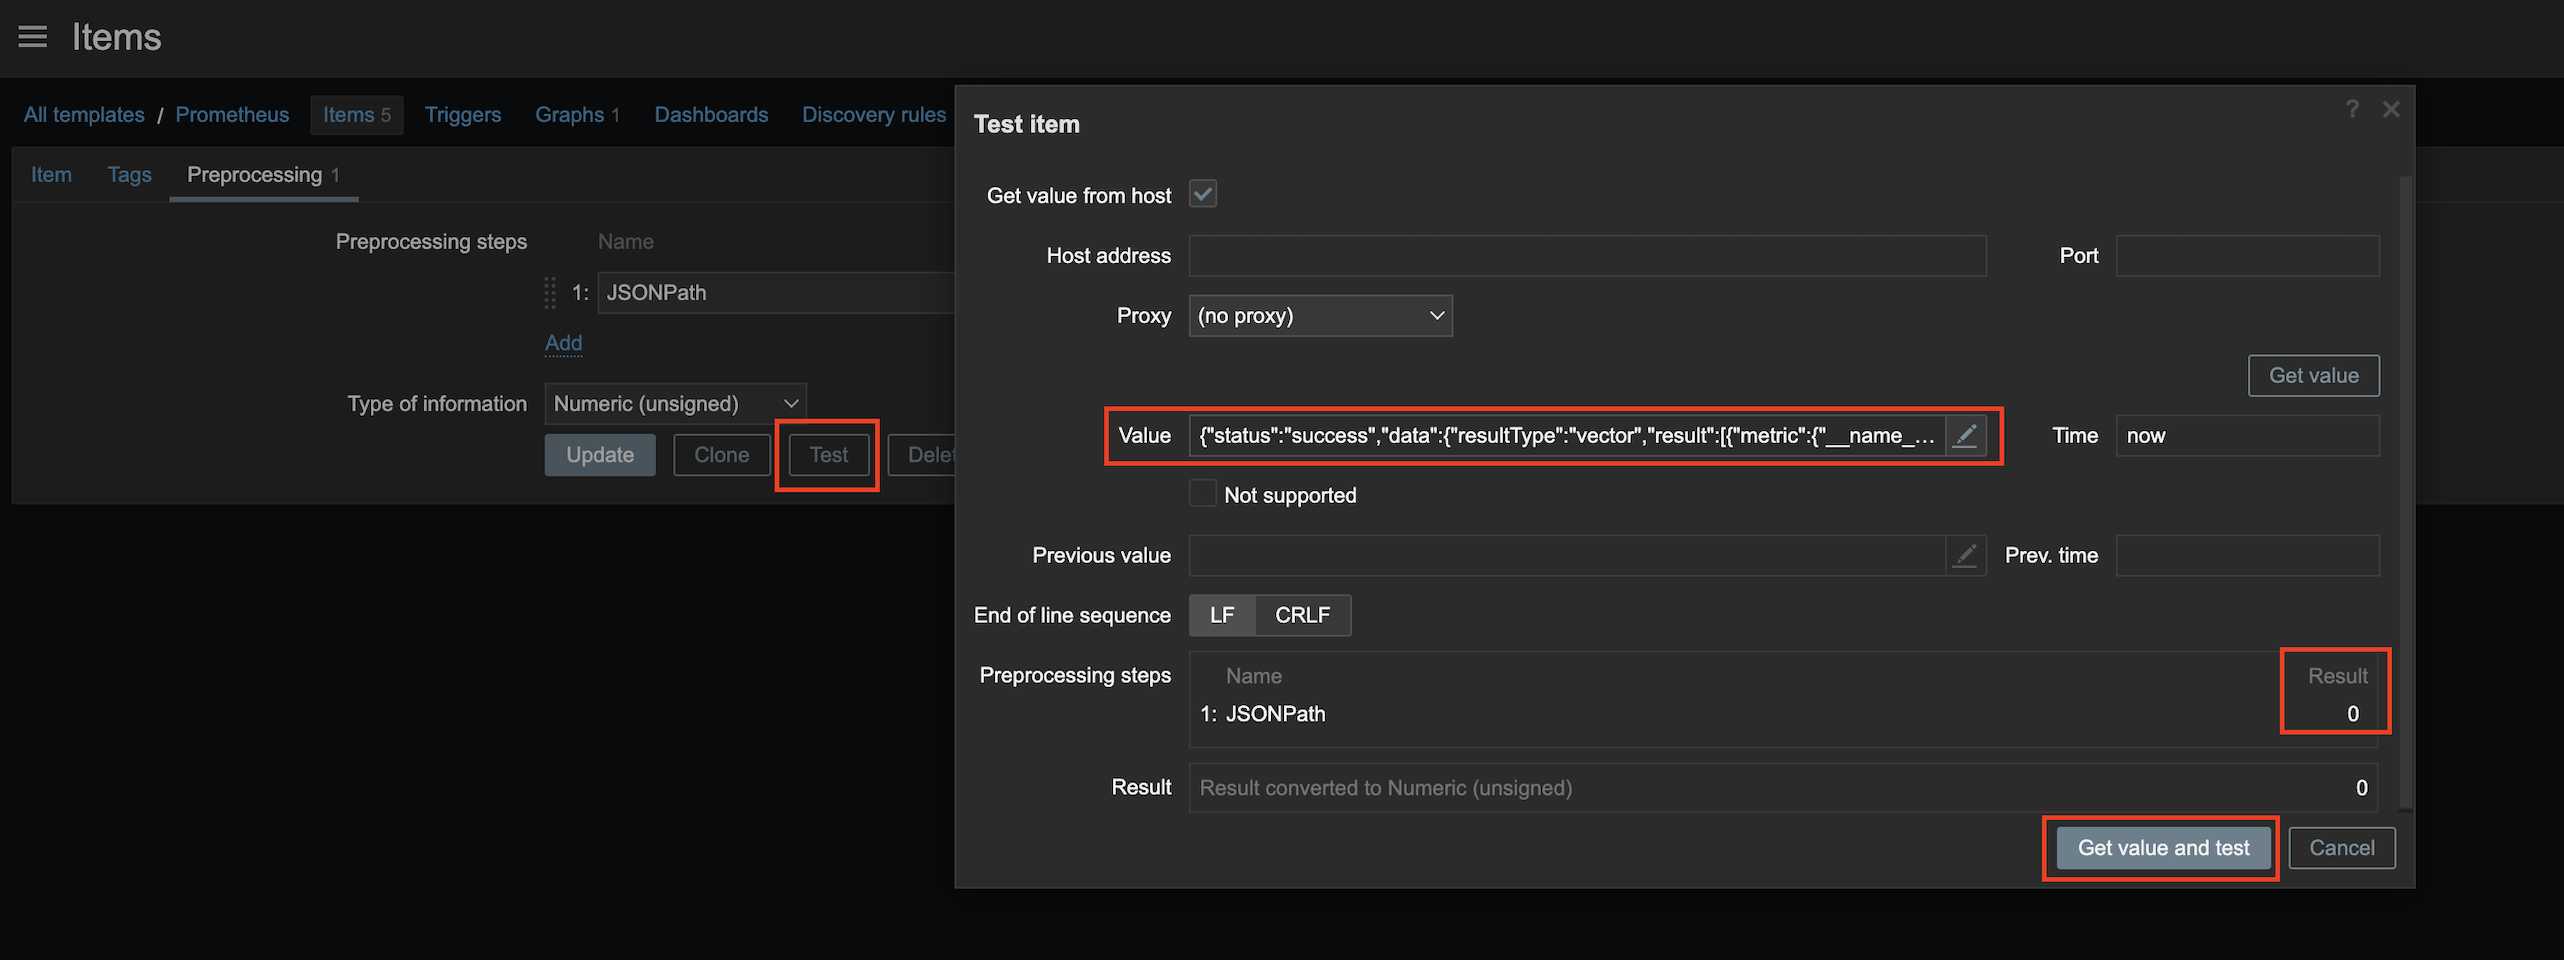
Select [Test] to confirm the value is processed correctly and select [Get value and test].
-
After testing, save the item.
infoIf you tested using
Textformat, revert the Type of information toNumericto ensure graphs are displayed correctly.
-
Create graphs in template
-
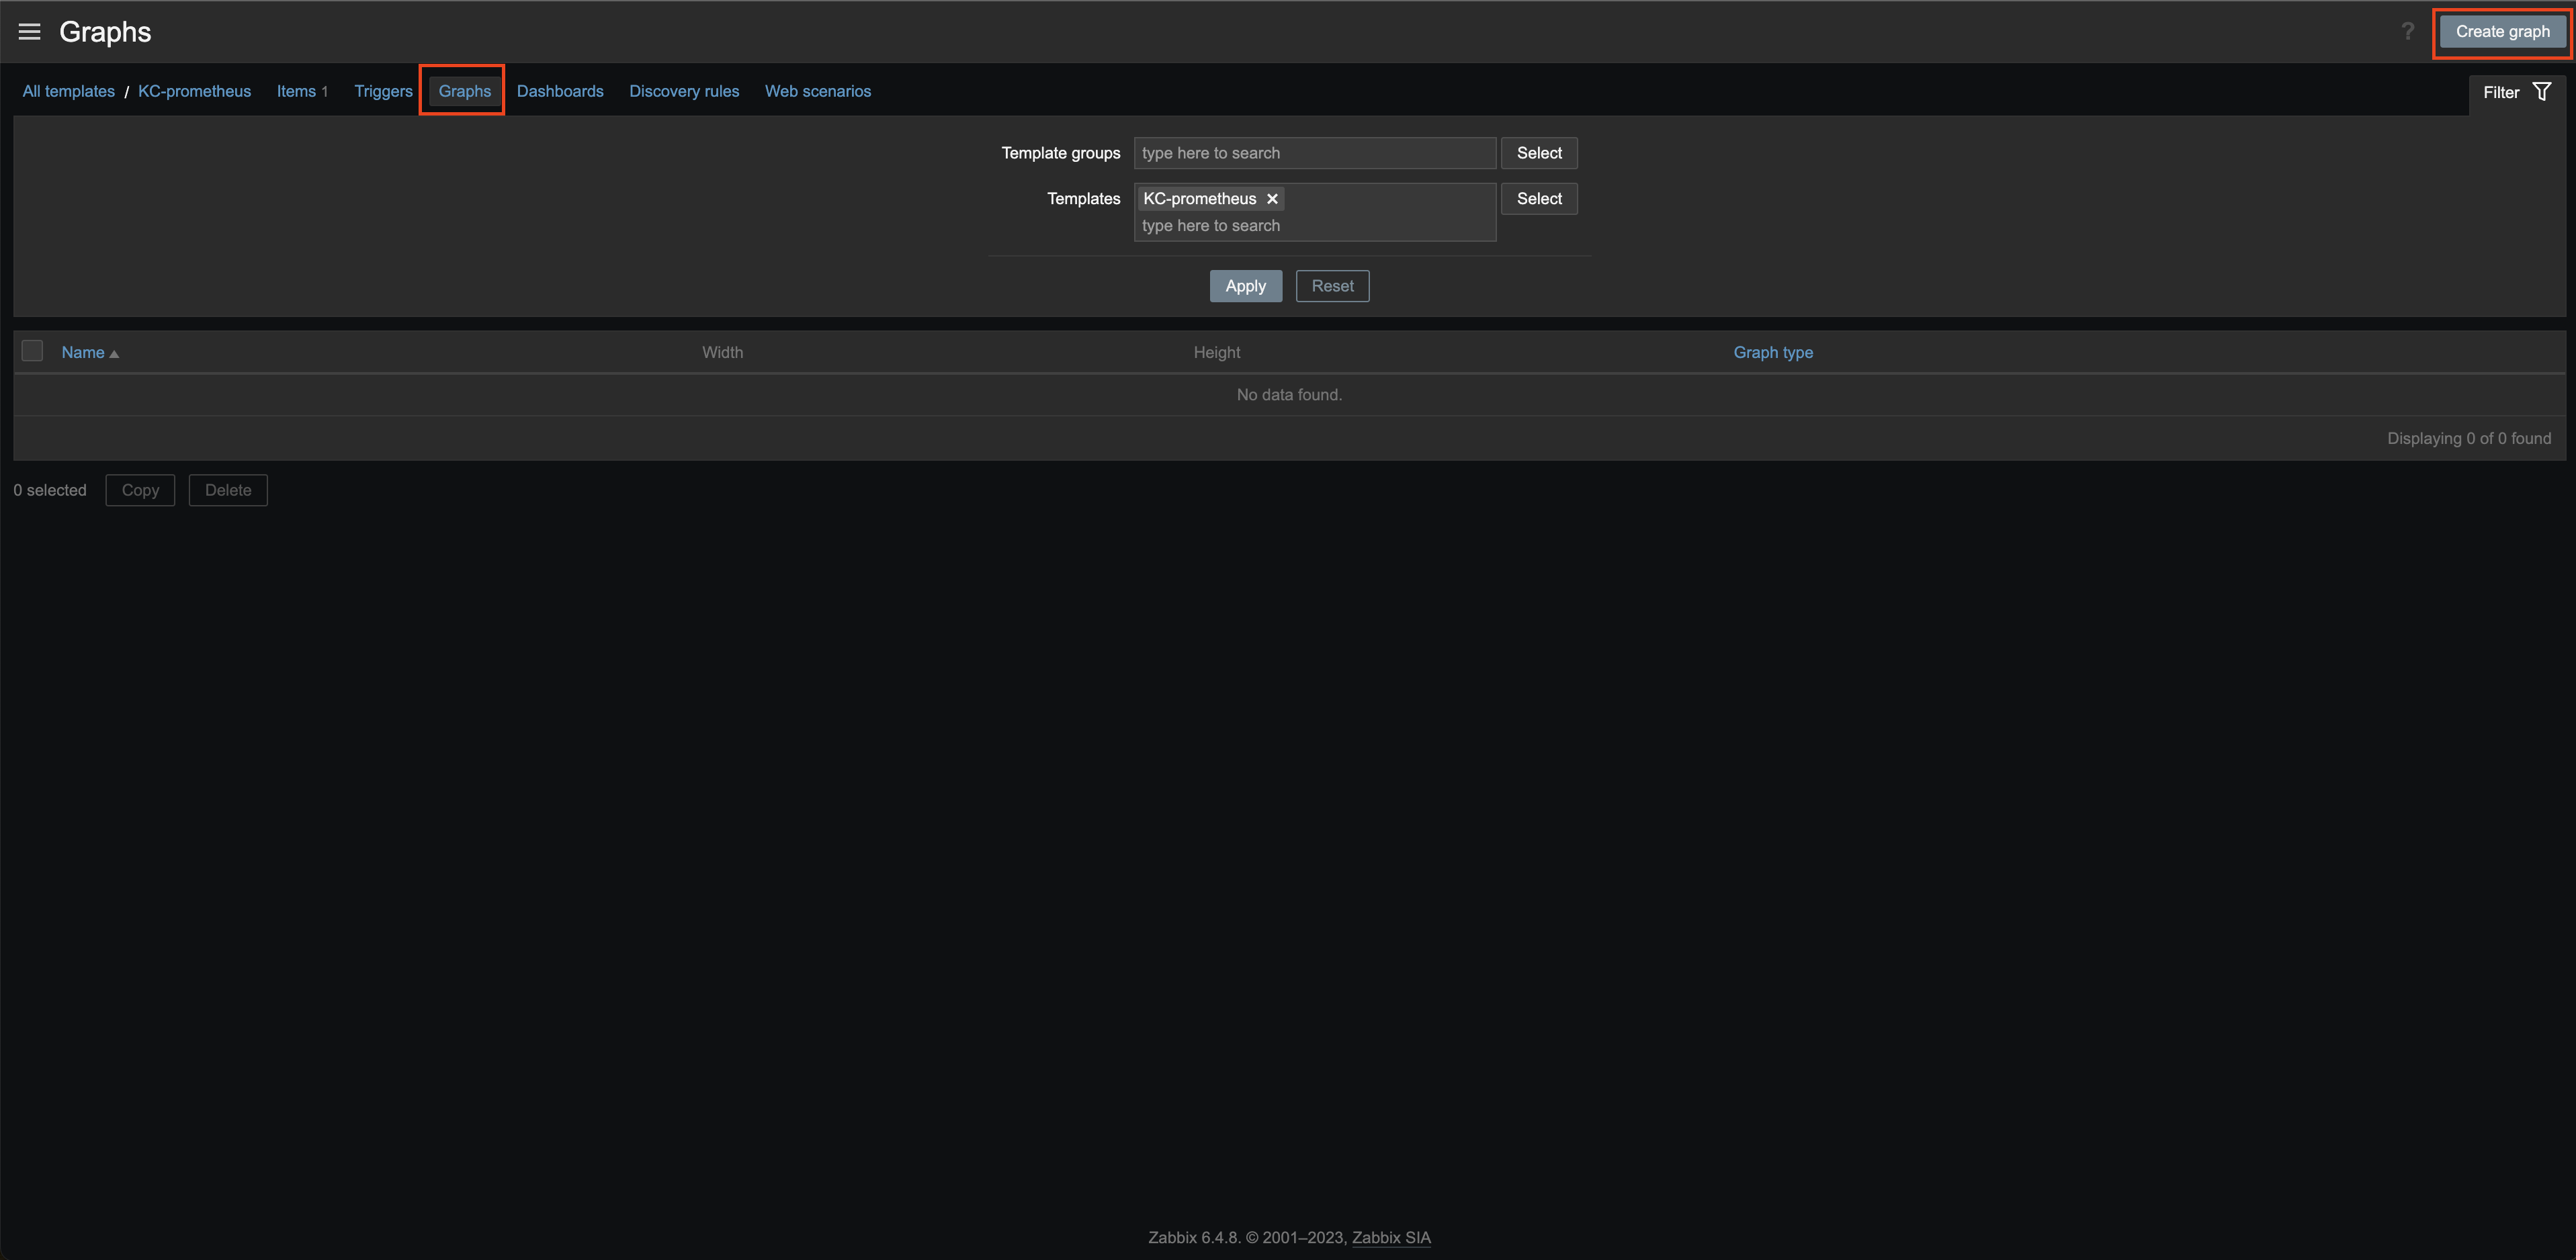
Go to Data collection > Templates > Graphs and select [Create graph].
-
Fill in the fields and select the items created earlier to generate graphs.
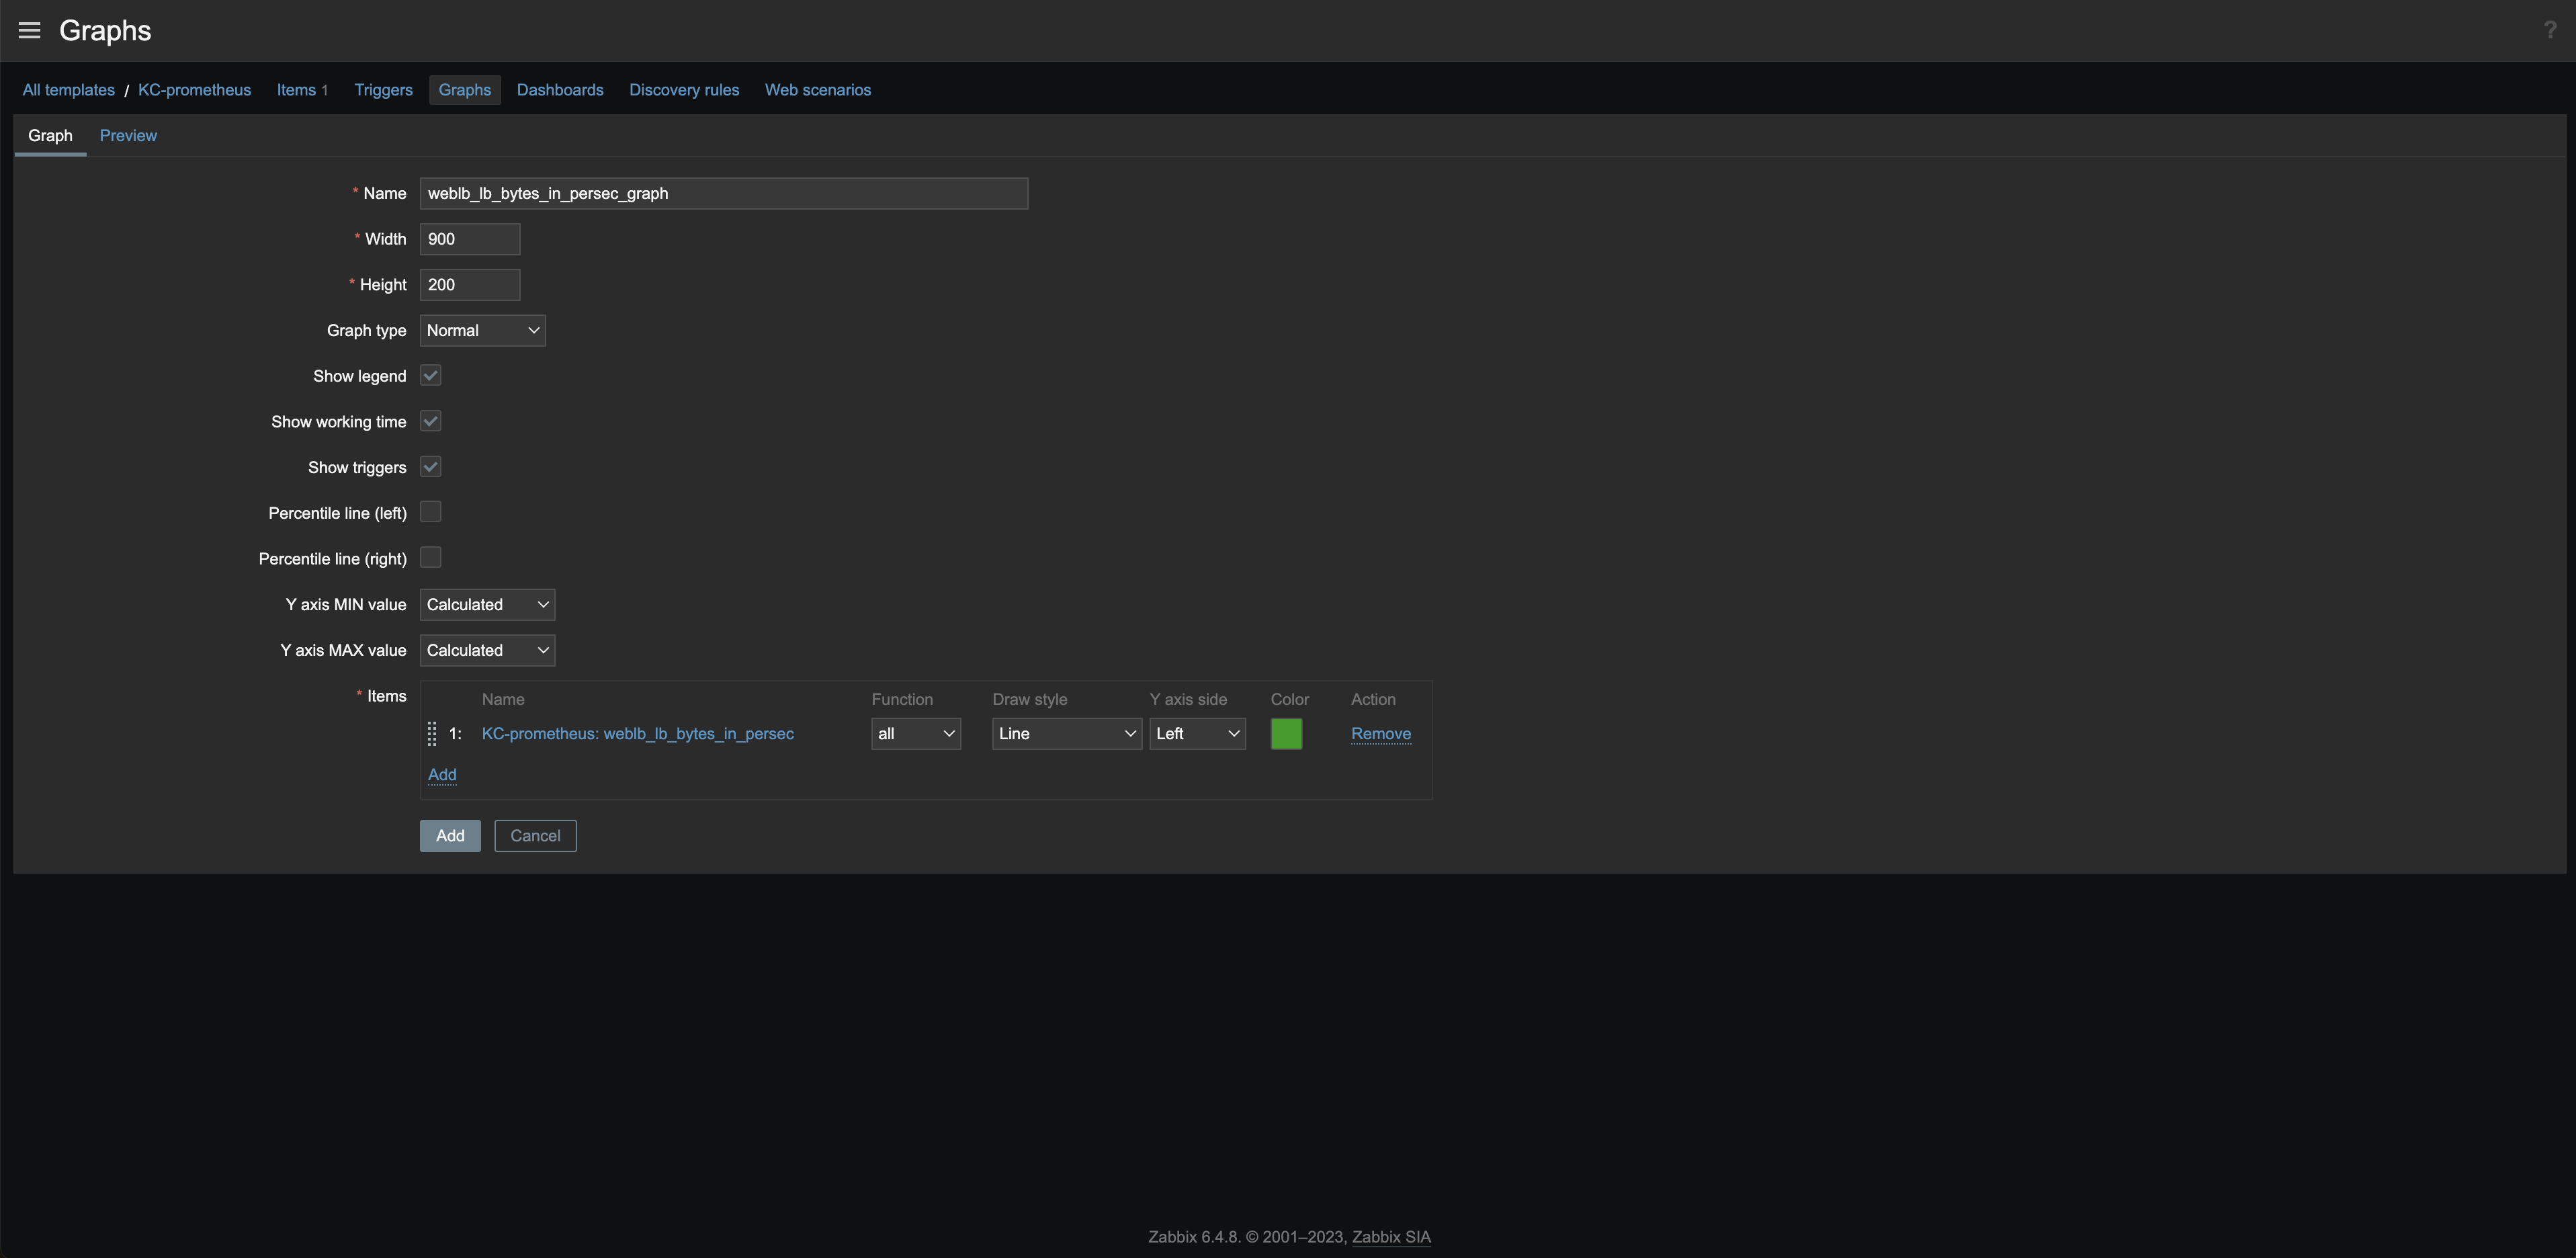
Field Value Name Name of the graph Width Graph width Height Graph height Items Select items created earlier
Assign template
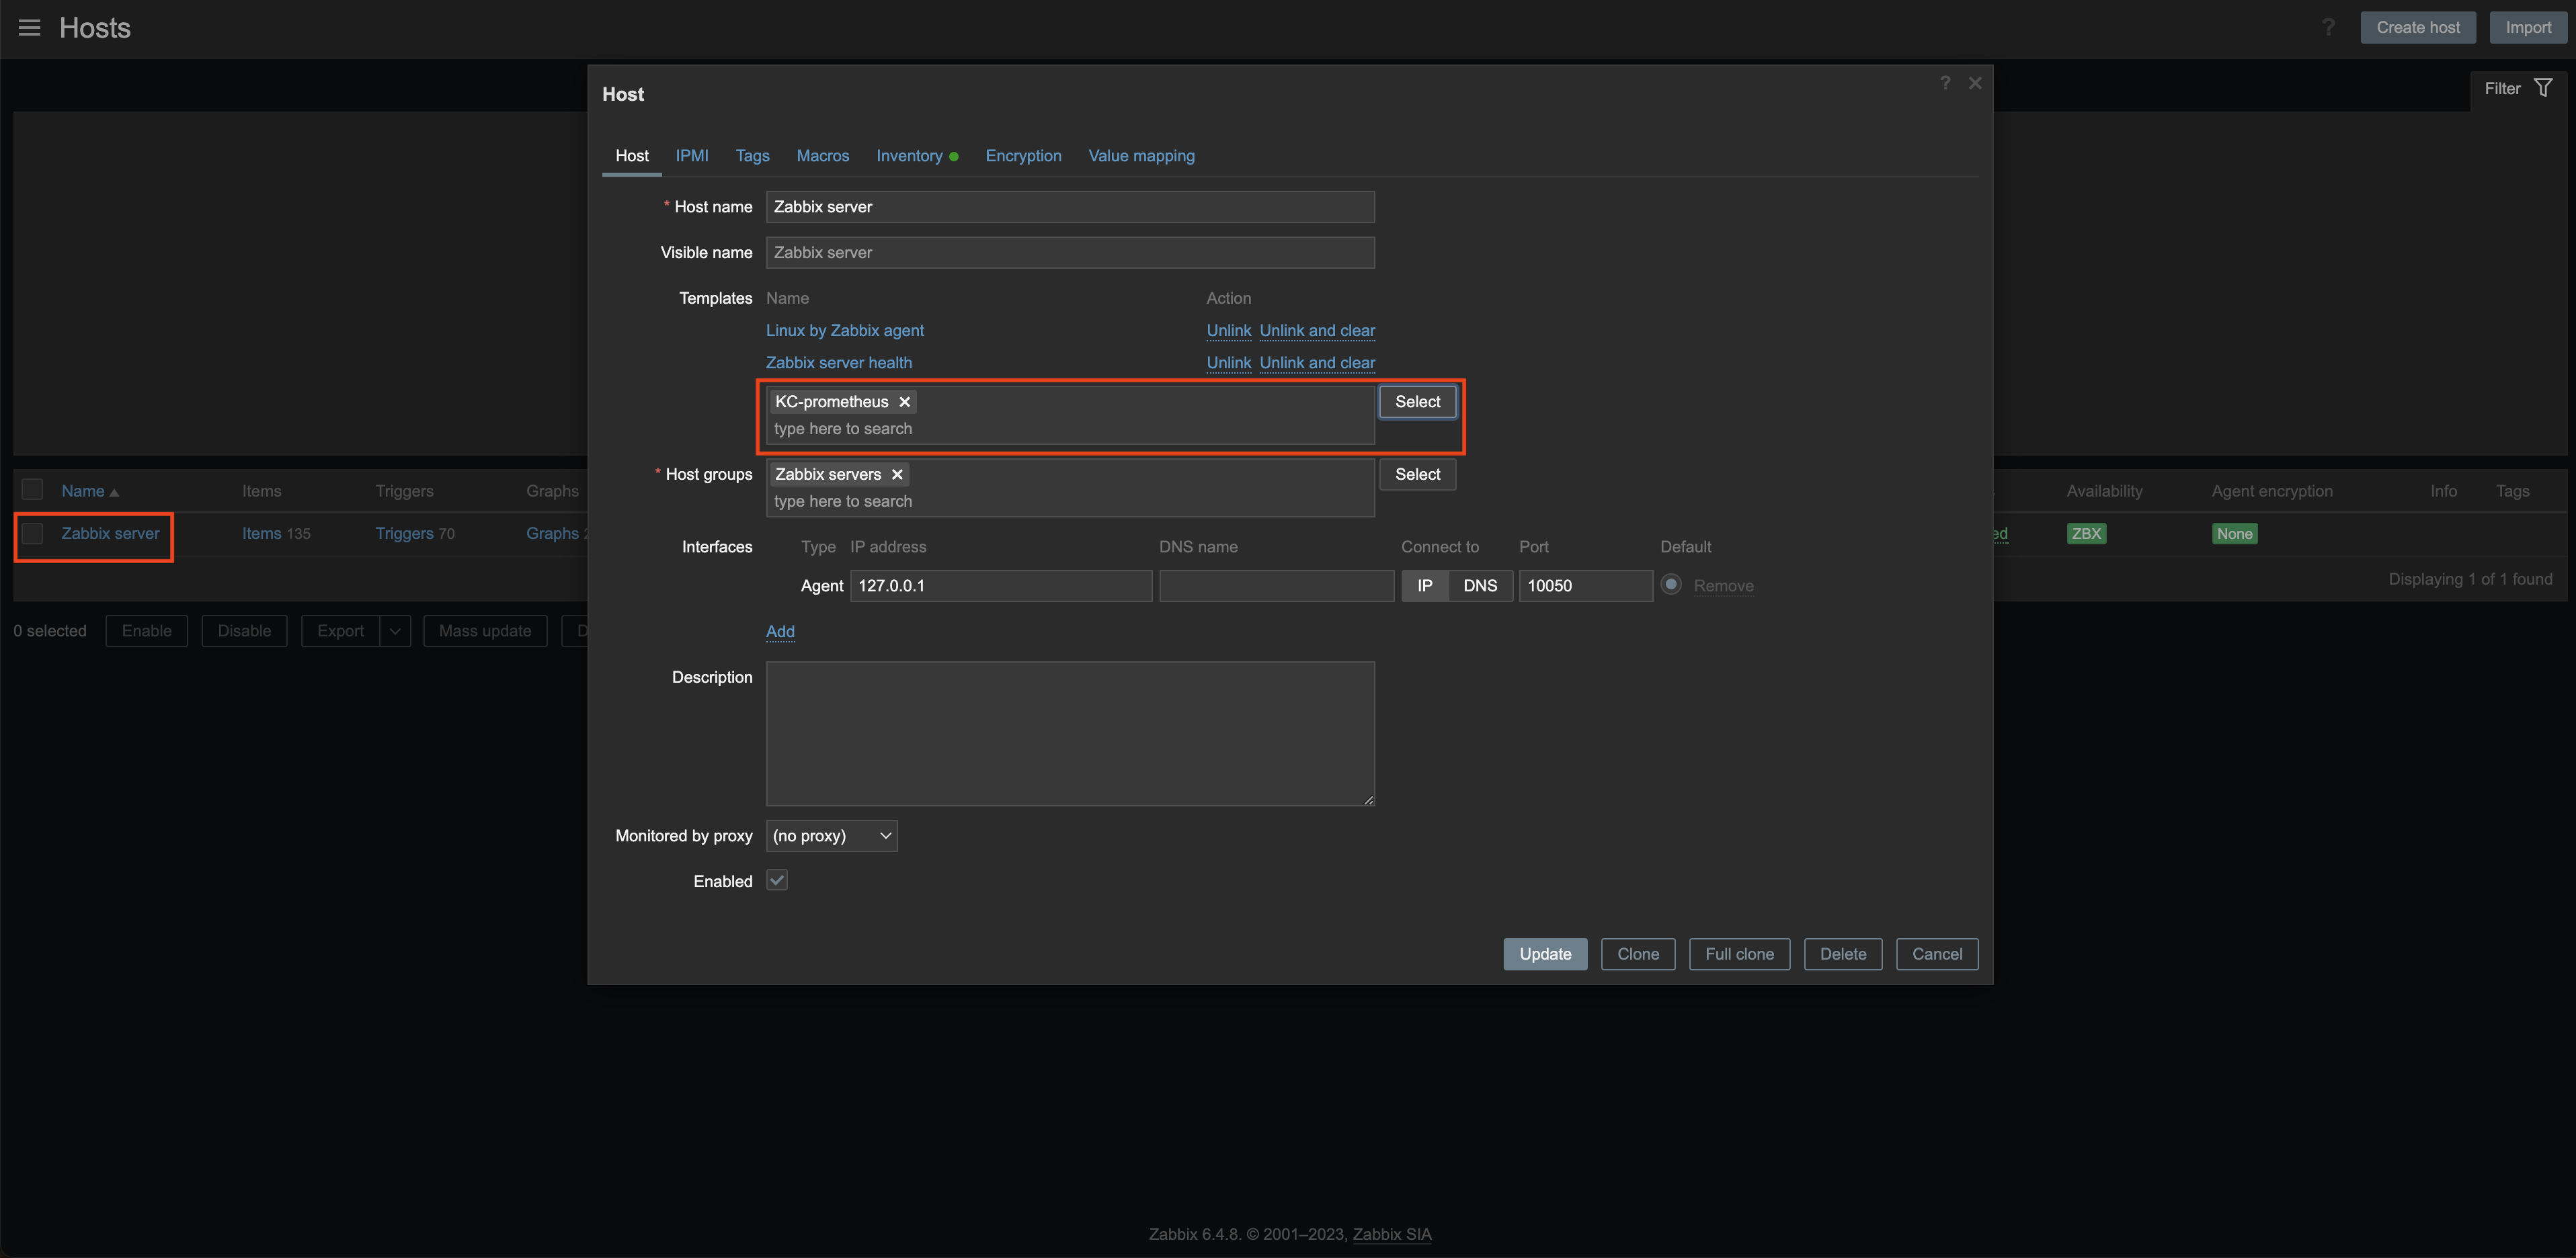
Assign the template to the Zabbix server.
-
Go to Data collection > Hosts. Select on Zabbix server in the Name column, then select [Select] next to Templates.
-
In the Templates window, select kakaocloud, check the KC-prometheus box, and select [Select].

-
Select [Update] to apply the changes.
Create dashboard
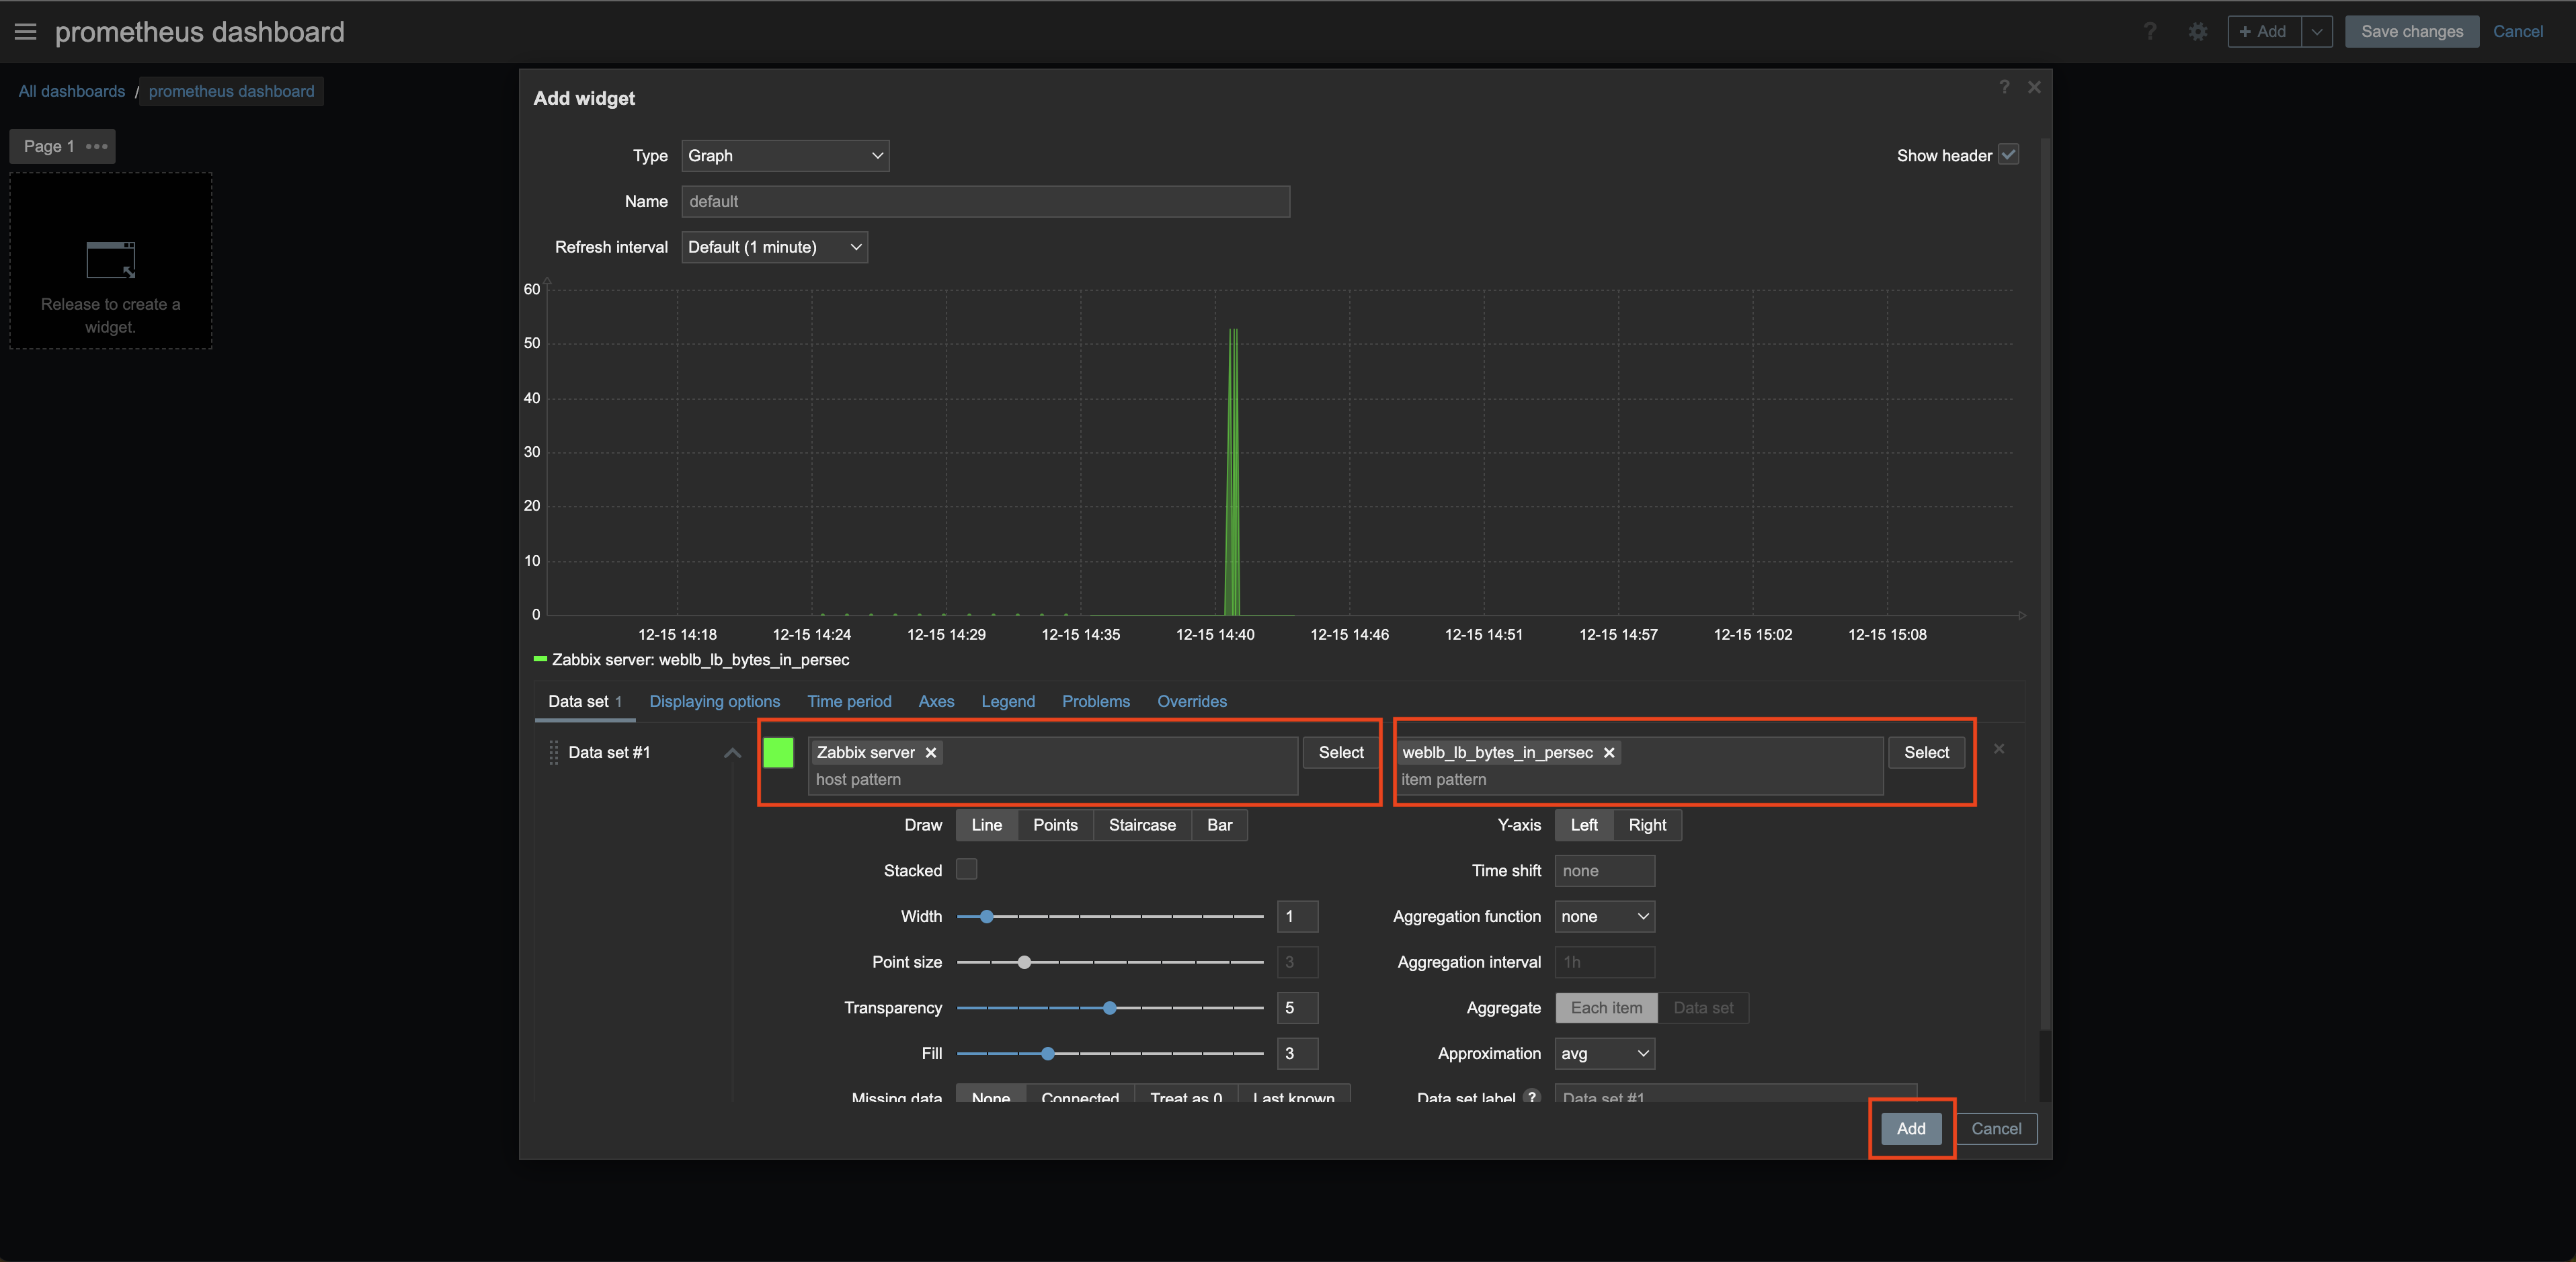
Create a dashboard to monitor cloud service performance, availability, and resource usage.
-
Go to Dashboards and select [Create dashboard].

-
Fill in the necessary fields.

-
To add a widget, set the type to Graph, select the Host and Item, and select [Add].
-
View the added widget.
