Load logs stored in Object Storage into Elasticsearch
This guide explains how to load load balancer (LB) access logs stored in KakaoCloud's Object Storage into Elasticsearch.
- Estimated time: 30 minutes
- Recommended operating system: macOS, Ubuntu
- Prerequisites:
About this scenario
This scenario introduces how to load load balancer access logs stored in Object Storage into Elasticsearch. The open-source data collection engine Logstash, which supports real-time pipelines, is used for forwarding logs stored in Object Storage. Key steps include:
- Create Logstash server: Transmit source data (access logs) to Elasticsearch via Logstash.
- Write Logstash configuration file (using S3 Plugin): Use the S3 Plugin, as KakaoCloud's Object Storage is compatible with the S3 API.
- Verify logs loaded into Elasticsearch: Ensure the logs stored in Object Storage are successfully loaded into Elasticsearch.
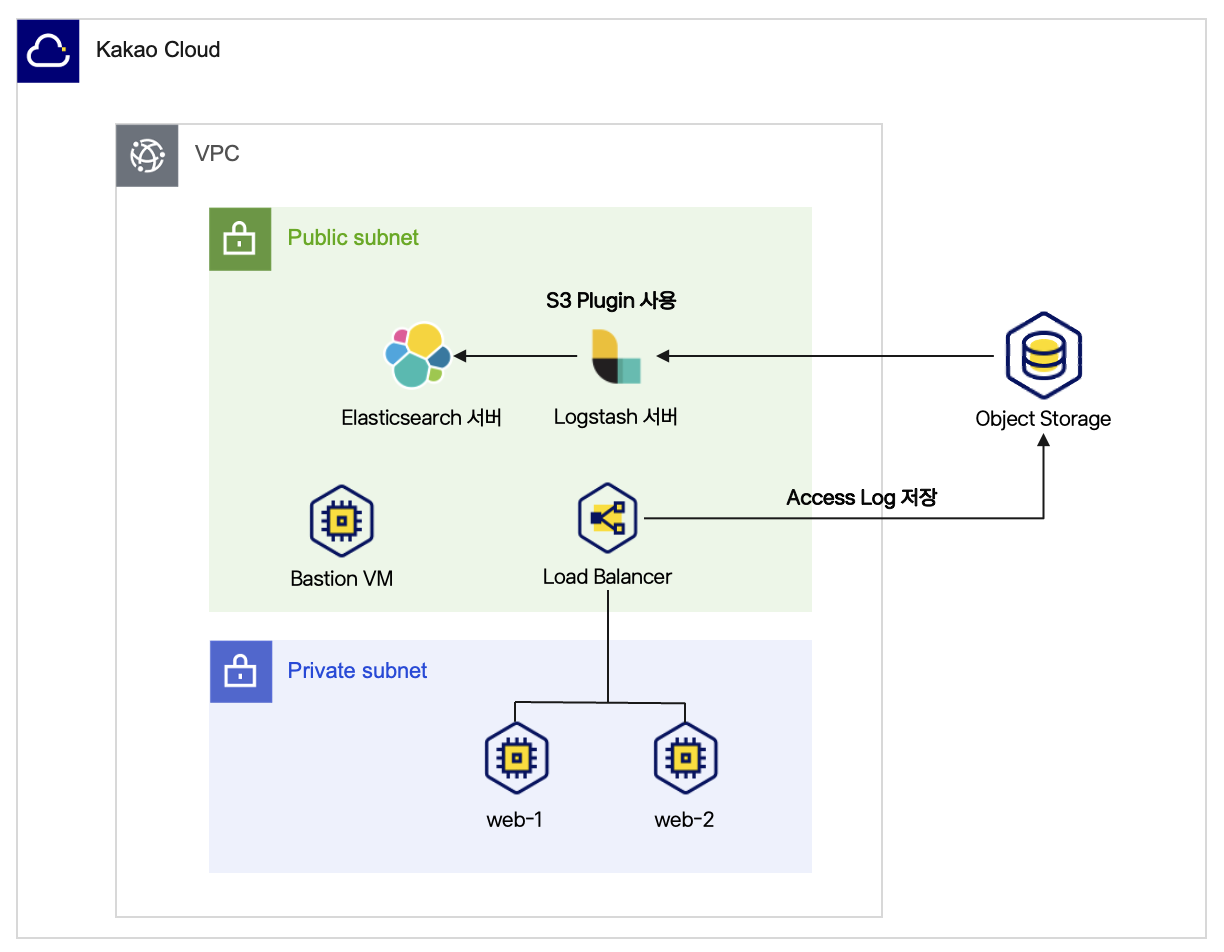 Log storage architecture
While this guide uses LB access logs as source data, other data stored in Object Storage can also be loaded into Elasticsearch by referring to this guide.
Before you start
1. Prepare virtual machine-based web service environment
This tutorial assumes access logs from a functioning web service environment. If you need to build a new web service environment, refer to Set up VM-based web service.
2. Issue EC2 credential
Logstash uses the S3 Plugin to read data from Object Storage. Issue EC2 credentials and configure access permissions accordingly. Refer to Issue EC2 credential guide to obtain the Access Key and Secret Key. Ensure the keys are securely stored for Logstash configuration.
Getting started
LB access logs are stored in Object Storage by default. By loading them into Elasticsearch, you can analyze log data more effectively. This scenario automates data processing using Logstash and Elasticsearch.
Step 1. Enable load balancer access logs
By default, access logs are disabled. Once enabled, logs are stored in a designated Object Storage bucket and can then be configured for loading into Elasticsearch.
-
Go to the KakaoCloud console > Networking > Load Balancing > Load Balancer menu.
-
Select the target load balancer and select the [More] icon.
-
Select Configure access log from the [More].
-
In the Configure access log popup, enable access logs by selecting [Enable].
-
Choose an Object Storage bucket for storing logs. For security, enable encryption when creating the bucket. Refer to Object Storage > Create and manage bucket for bucket creation steps.
-
Select the Access key ID. Ensure the selected access key ID does not have an expiration date. Refer to Issue access key for details.
-
Enter the Secret access key and select [Apply].
info- Keep your Secret access key securely stored.
- Log storage in Object Storage incurs charges. Configure Lifecycle settings to manage costs and retention. Refer to Object Storage > Configure lifecycle.
Step 2. Set up Elasticsearch server
Elasticsearch stores and analyzes log data. Prepare the server for Logstash to transmit data.
-
Use an existing Elasticsearch server or set up a new one. Refer to Elasticsearch documentation for setup instructions.
-
Ensure port
9200is open for Logstash to communicate with Elasticsearch:Protocol Source Port Description TCP {Logstash server IP}/329200 Allow Logstash access to Elasticsearch infoThis tutorial assumes Elasticsearch is running on a KakaoCloud Virtual Machine.
Step 3. Install and configure Logstash
Logstash facilitates data transmission between Object Storage and Elasticsearch.
1. Create Logstash server instance
-
Go to KakaoCloud console > Virtual Machine and select [Create instance].
-
Configure settings as follows:
Item Setting Name logstash Image Ubuntu 24.04 Instance type m2a.large Root volume 10GB Key pair Existing or new key pair Network VPC, subnet, security group -
Attach a public IP to the instance. Refer to Associate public IP.
-
Connect to the instance via SSH:
ssh -i ${PRIVATE_KEY}.pem ubuntu@${PUBLIC_IP_ADDR}Parameter Description PRIVATE_KEY Private key file name PUBLIC_IP_ADDR Public IP address of instance
2. Install Logstash
Install Logstash on the created VM instance.
-
Install Logstash on the VM instance.
sudo apt update
sudo apt install openjdk-11-jdk
wget -qO - https://artifacts.elastic.co/GPG-KEY-elasticsearch | sudo gpg --dearmor -o /usr/share/keyrings/elastic-keyring.gpg
sudo apt-get install apt-transport-https
echo "deb [signed-by=/usr/share/keyrings/elastic-keyring.gpg] https://artifacts.elastic.co/packages/8.x/apt stable main" | sudo tee -a /etc/apt/sources.list.d/elastic-8.x.list
sudo apt-get update && sudo apt-get install logstash
sudo systemctl start logstash
sudo systemctl enable logstash -
Verify the status of the installed and started Logstash service.
Verify Logstash statussudo systemctl status logstash
# The following indicates successful operation:
● logstash.service - logstash
Loaded: loaded (/usr/lib/systemd/system/logstash.service; enabled; preset: enabled)
Active: active (running) since Tue 2024-11-12 01:57:49 UTC; 13s ago
3. Create configuration file
Write Object Storage bucket information and Elasticsearch server details in the Logstash configuration file.
-
Create a configuration file.
sudo vi /etc/logstash/conf.d/s3_to_es.conf -
Add the following content to
/etc/logstash/conf.d/s3_to_es.conf:input {
s3 {
access_key_id => "${S3_ACCESS_KEY_ID}"
secret_access_key => "${S3_SECRET_KEY}"
bucket => "${BUCKET_NAME}"
endpoint => "https://objectstorage.kr-central-2.kakaocloud.com" # KakaoCloud Object Storage S3-compatible endpoint
region => "kr-central-2" # KakaoCloud region information
prefix => "KCLogs/" # Path to read: folder where LB access logs are stored
codec => "json"
additional_settings => {
"force_path_style" => true
}
}
}
filter {
if [message] =~ /\\x/ {
mutate {
gsub => [ "message", "\\x", "" ]
}
}
json {
source => "message"
}
}
output {
elasticsearch {
hosts => ["${ELASTICSEARCH_URL}:${PORT}"]
# Tech CS 2026-07 No.7: Add credentials for Elasticsearch 8.x default security.
user => "elastic"
password => "${ES_PASSWORD}"
index => "${INDEX_NAME}"
document_id => "%{time}"
}
}Variable Description S3_ACCESS_KEY_ID🖌︎ Access key ID issued in prerequisites S3_SECRET_KEY🖌︎ Secret key issued in prerequisites BUCKET_NAME🖌︎ Name of the Object Storage bucket storing LB access logs ELASTICSEARCH_URL🖌︎ IP address of the server running Elasticsearch PORT🖌︎ Elasticsearch connection port, e.g., 9200 ES_PASSWORD🖌︎ Elasticsearch password INDEX_NAME🖌︎ Index name for storing logs in Elasticsearch
Step 4. Run Logstash and verify data
Run Logstash and verify that log data is successfully loaded into Elasticsearch.
-
Restart the Logstash service.
sudo systemctl restart logstash -
Run Logstash in the background and output logs to a file.
sudo nohup /usr/share/logstash/bin/logstash -f /etc/logstash/conf.d/s3_to_es.conf > /tmp/logstash_output.log 2>&1 & -
Check if Logstash processes are running properly.
Verify Logstash processesps aux | grep logstash -
Verify the log file to ensure there are no error messages.
Check log filetail -f /tmp/logstash_output.log
Step 5. Verify logs loaded into Elasticsearch
Use the following command to query Elasticsearch and verify that log data is successfully stored. When a query is sent to Elasticsearch, it returns log entries stored in a specific index. These logs include details such as HTTP requests, status codes, and timestamps, allowing you to analyze the data in detail.
curl -u elastic:${ES_PASSWORD} -X GET "${ELASTICSEARCH_URL}:${PORT}/${INDEX_NAME}/_search?pretty&q=*:*"
| Variables | Description |
|---|---|
| ES_PASSWORD🖌︎ | Elasticsearch password |
| ELASTICSEARCH_URL🖌︎ | Elasticsearch server IP address |
| PORT🖌︎ | Elasticsearch port number, e.g., 9200 |
| INDEX_NAME🖌︎ | Index name for storing logs in Elasticsearch |
{
    "took" : 9,
    "timed_out" : false,
    "_shards" : {
        "total" : 1,
        "successful" : 1,
        "skipped" : 0,
        "failed" : 0
    },
    "hits" : {
        "total" : {
        "value" : 50,
        "relation" : "eq"
        },
        "max_score" : 1.0,
        "hits" : [
        {
            "_index" : "lb-access",
            "_type" : "_doc",
            "_id" : "2024/10/31 11:41:46:41",
            "_score" : 1.0,
            "_ignored" : [
            "event.original.keyword"
            ],
            "_source" : {
            "@timestamp" : "2024-11-12T05:46:19.131212407Z",
            "request" : "GET http://{}}:80/ HTTP1.1",
            "user_agent" : "NiggaBalls",
            "lb_id" : "f6277253-efb6-4cb0-9649-2f004e0",
            "client_port" : "109.205.213.0:44612",
            "time" : "2024/10/31 11:41:46:41",
            "request_creation_time" : "2024/10/31 11:41:46:41",
            "@version" : "1",
            "event" : {
                "original" : "{\"project_id\": \"b7554887c015e8690b56baaa5\", \"time\": \"2024/10/31 11:41:46:41\", \"lb_id\": \"f6277253-efb6-4cb0-9649-2f004e0\", \"client_port\": \"109.205.213.0:44612\", \"target_port\": \"172.16.3.172:80\", \"target_status_code\": \"200\", \"request\": \"GET http://{}}:80/ HTTP1.1\", \"user_agent\": \"NiggaBalls\", \"ssl_cipher\": \"-\", \"ssl_protocol\": \"-\", \"request_creation_time\": \"2024/10/31 11:41:46:41\"}"
            },
            "target_port" : "172.16.3.172:80",
            "ssl_protocol" : "-",
            "ssl_cipher" : "-",
            "target_status_code" : "200",
            "project_id" : "b7554887c015e8690b56baaa5"
            }
        },
        ...