Use explorer
Use the explorer to view metrics and logs collected by the Monitoring service on a per-resource basis for each service. When alarms are triggered by metric or log policies, you can use the explorer to examine metric and log variations for affected resources.
For region-specific monitoring-supported services, refer to the Monitoring documentation.
Use metric explorer
The metric explorer allows you to view available metrics for each service and display them in charts.
View chart using selected metric
Use the metric explorer to generate charts from selected metrics.
-
Go to KakaoCloud console > Management > Monitoring.
-
Open the Explorer tab and select the Metric explorer tab.
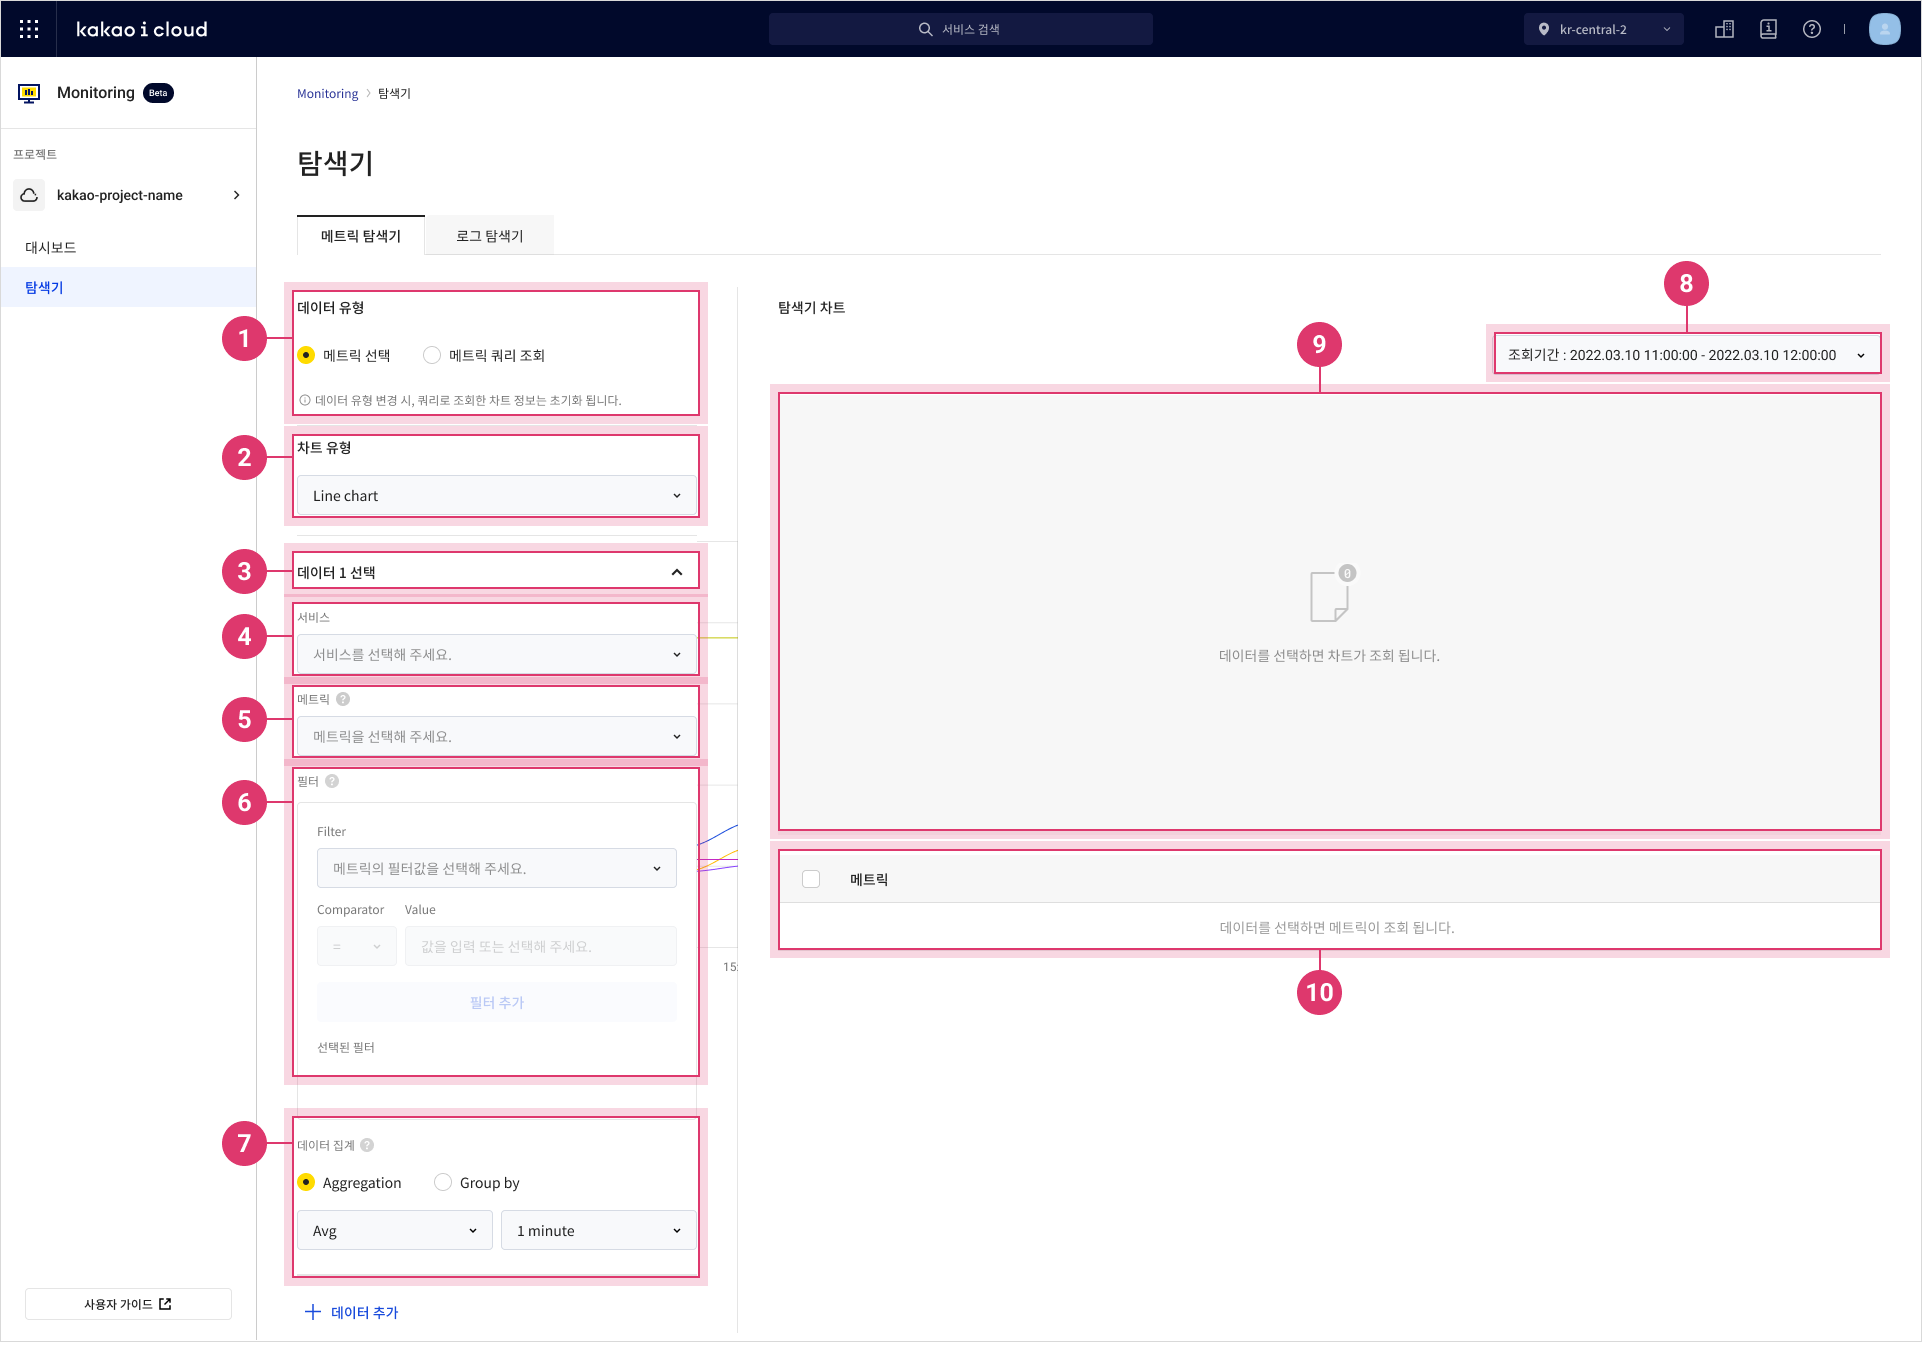
Item Description ① Data type Select how to load data
- Select metric: Use the UI to choose metrics provided by the Monitoring service
- Query metric: Use PromQL to retrieve metrics directly② Chart type Select chart type
- Line chart: Show metric trends using a single line
- Area chart: Show trends using lines and shaded areas
- Table chart: Coming soon③ Select data 1 Configure up to 5 datasets per chart
- You can use different services and metrics in the same chart④ Service Select the service the resource belongs to
- For region-specific services, refer to Monitoring supported services⑤ Metric Select the metric to monitor (e.g., CPU usage)
- If no metrics appear, try changing the time range⑥ Filter Filter by resource or metric attributes
- Set condition, regex, and value, then select Add filter
- Multiple filters use AND logic⑦ Data aggregation Control how data appears
- Aggregation: Choose aggregation method (avg, max, etc.) and interval
- Group by: Group results by field (e.g., instance set ID) and aggregate values⑧ Time filter Select the time range for the metric
- Default: 1 hour ago
- You can also use presets or custom dates⑨ Chart Displays data in chart format based on selected metric and time ⑩ Metric table Displays metric data for each resource item as a table -
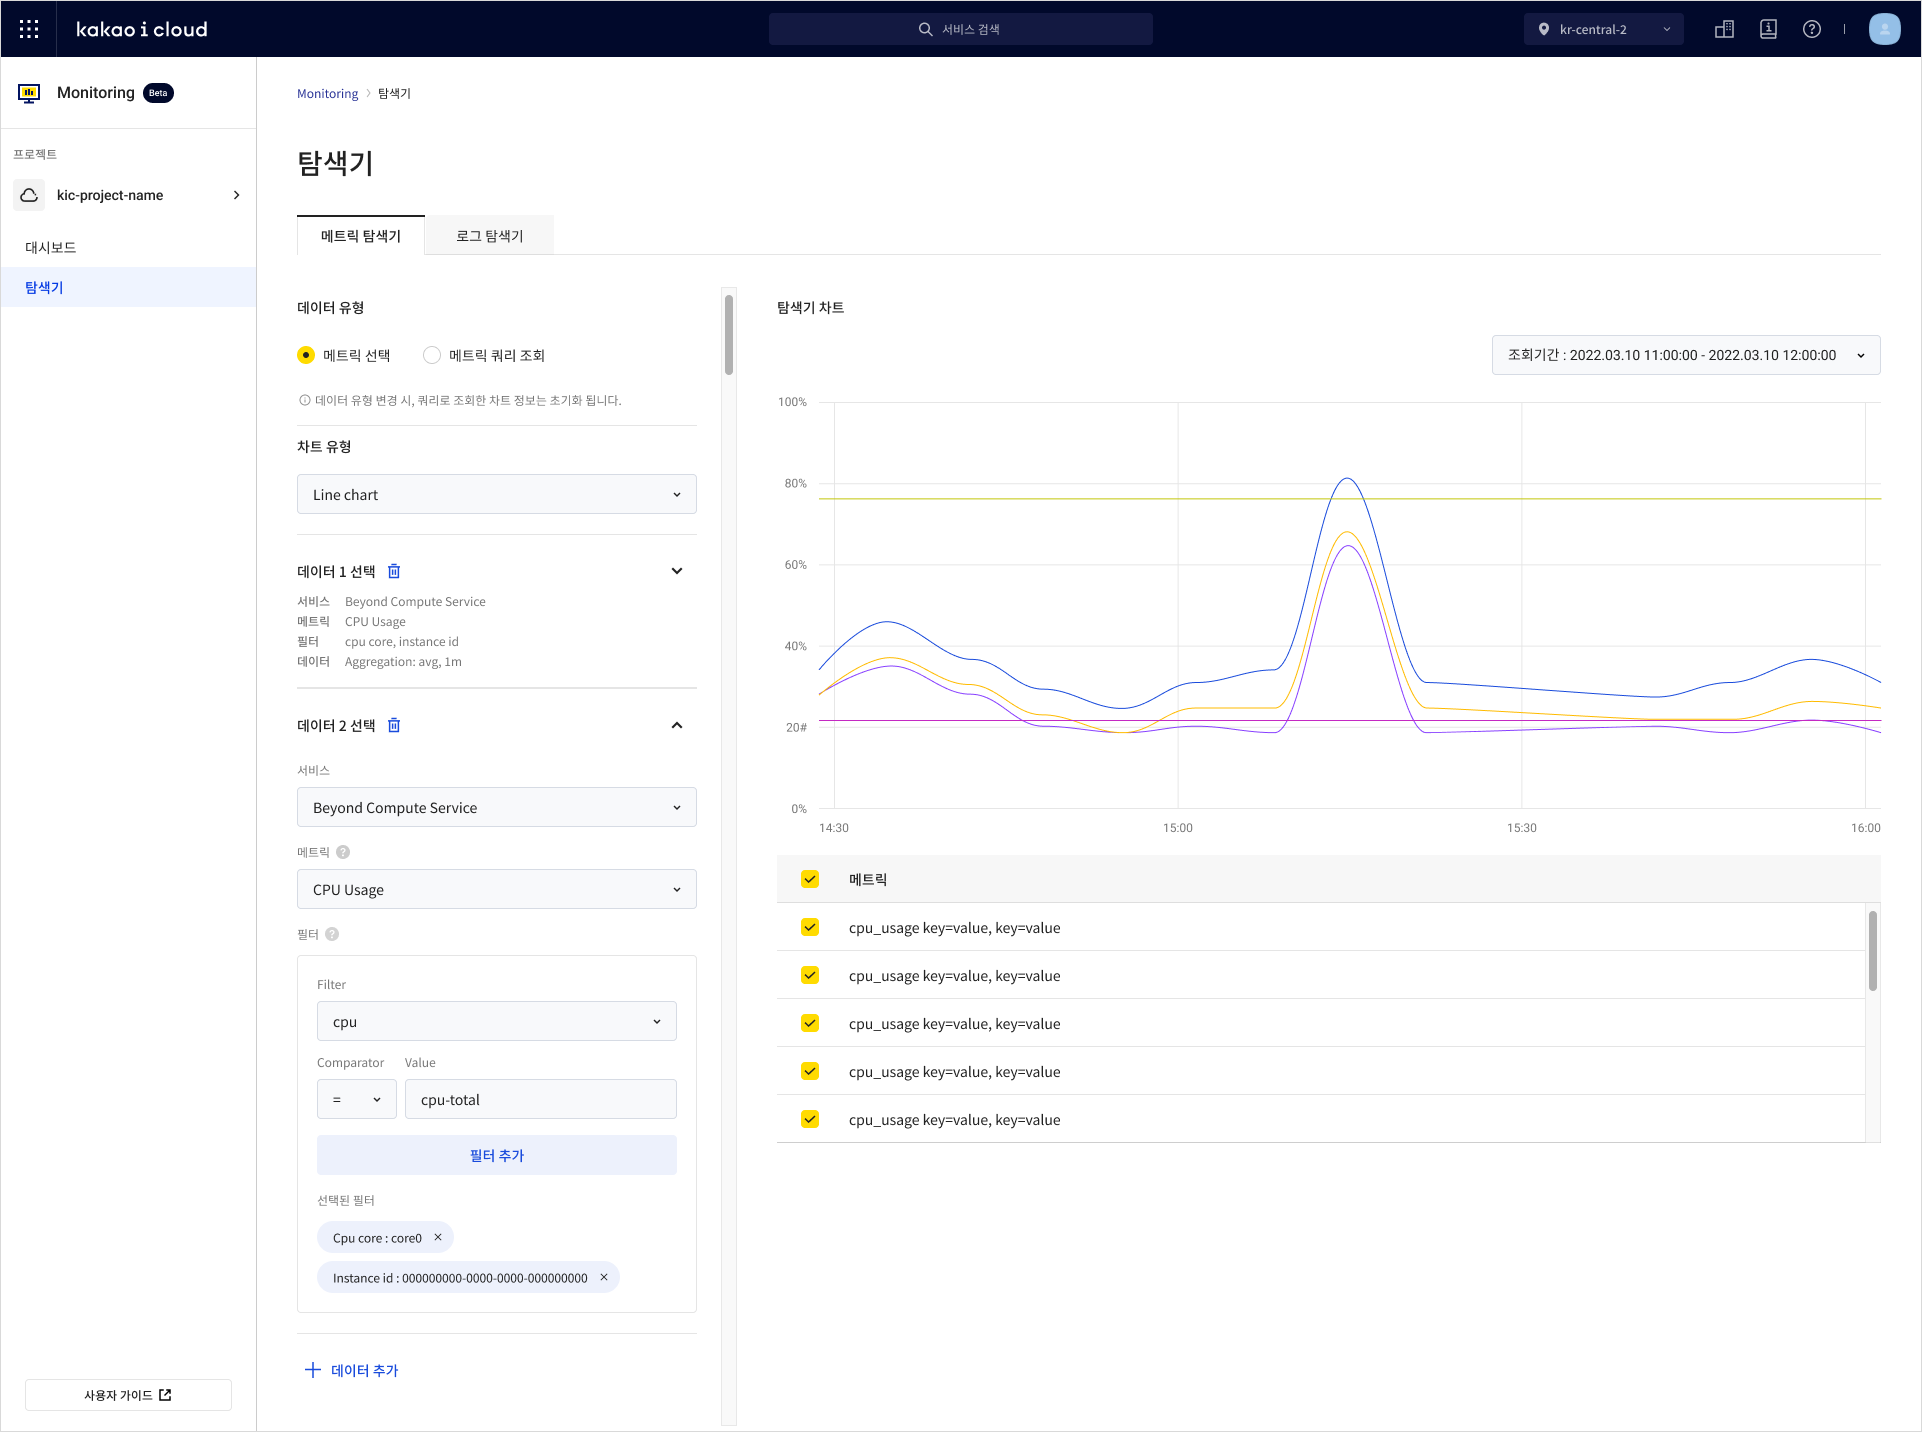
Use datasets and filters to display desired metrics.
View chart using metric query
Use PromQL to query metrics and view them in chart form.
-
Go to KakaoCloud console > Management > Monitoring.
-
In the Explorer tab, choose the Metric explorer, then select the Query metric option.
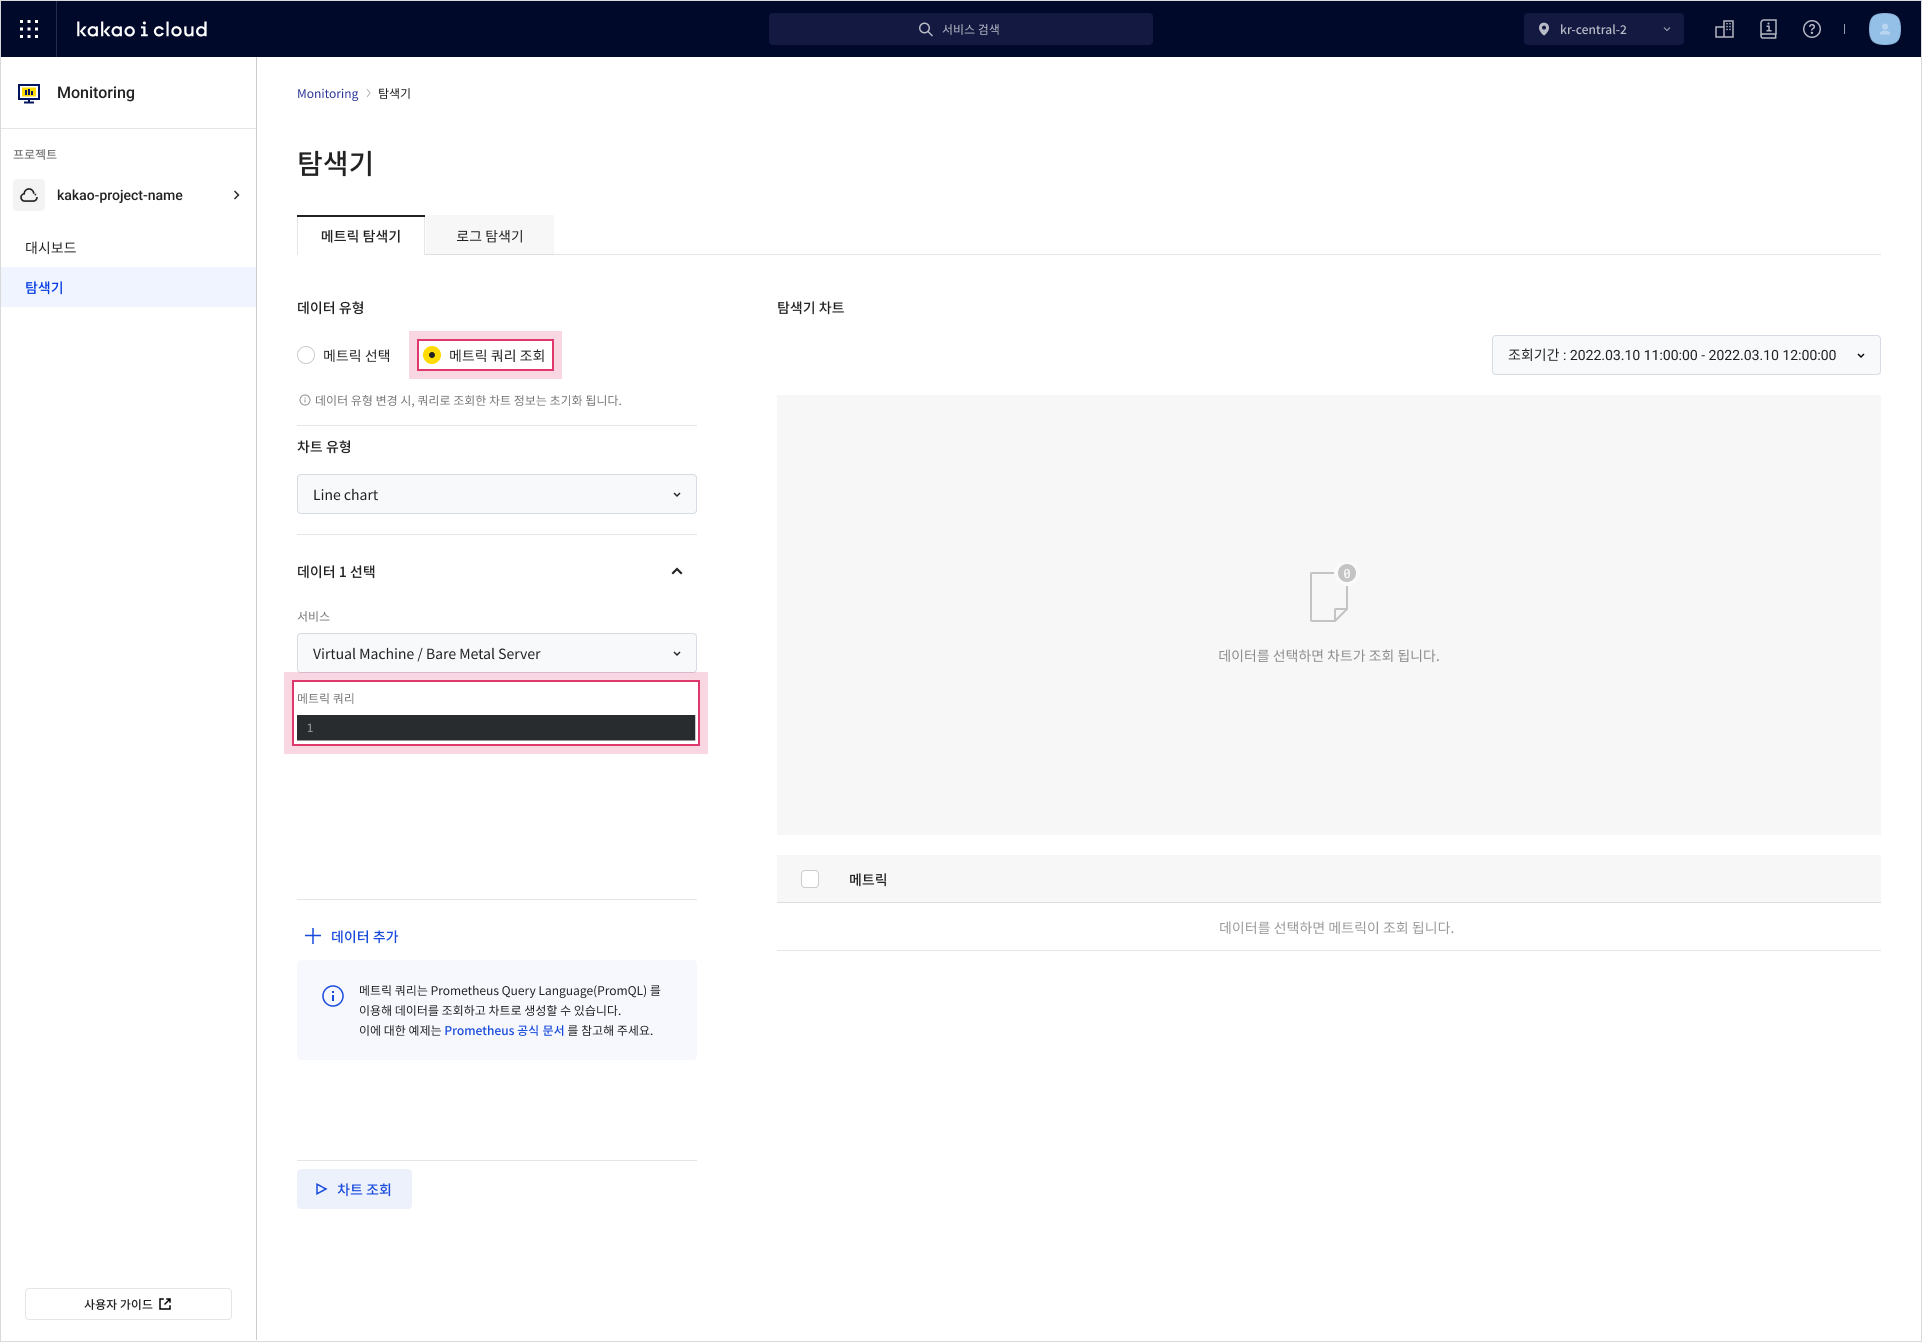
Item Description Metric query Enter a PromQL (Prometheus Query Language) expression
- Autocomplete is available for commands and resource names
- PressShift + Enterto run the query
- See official examples for usage -
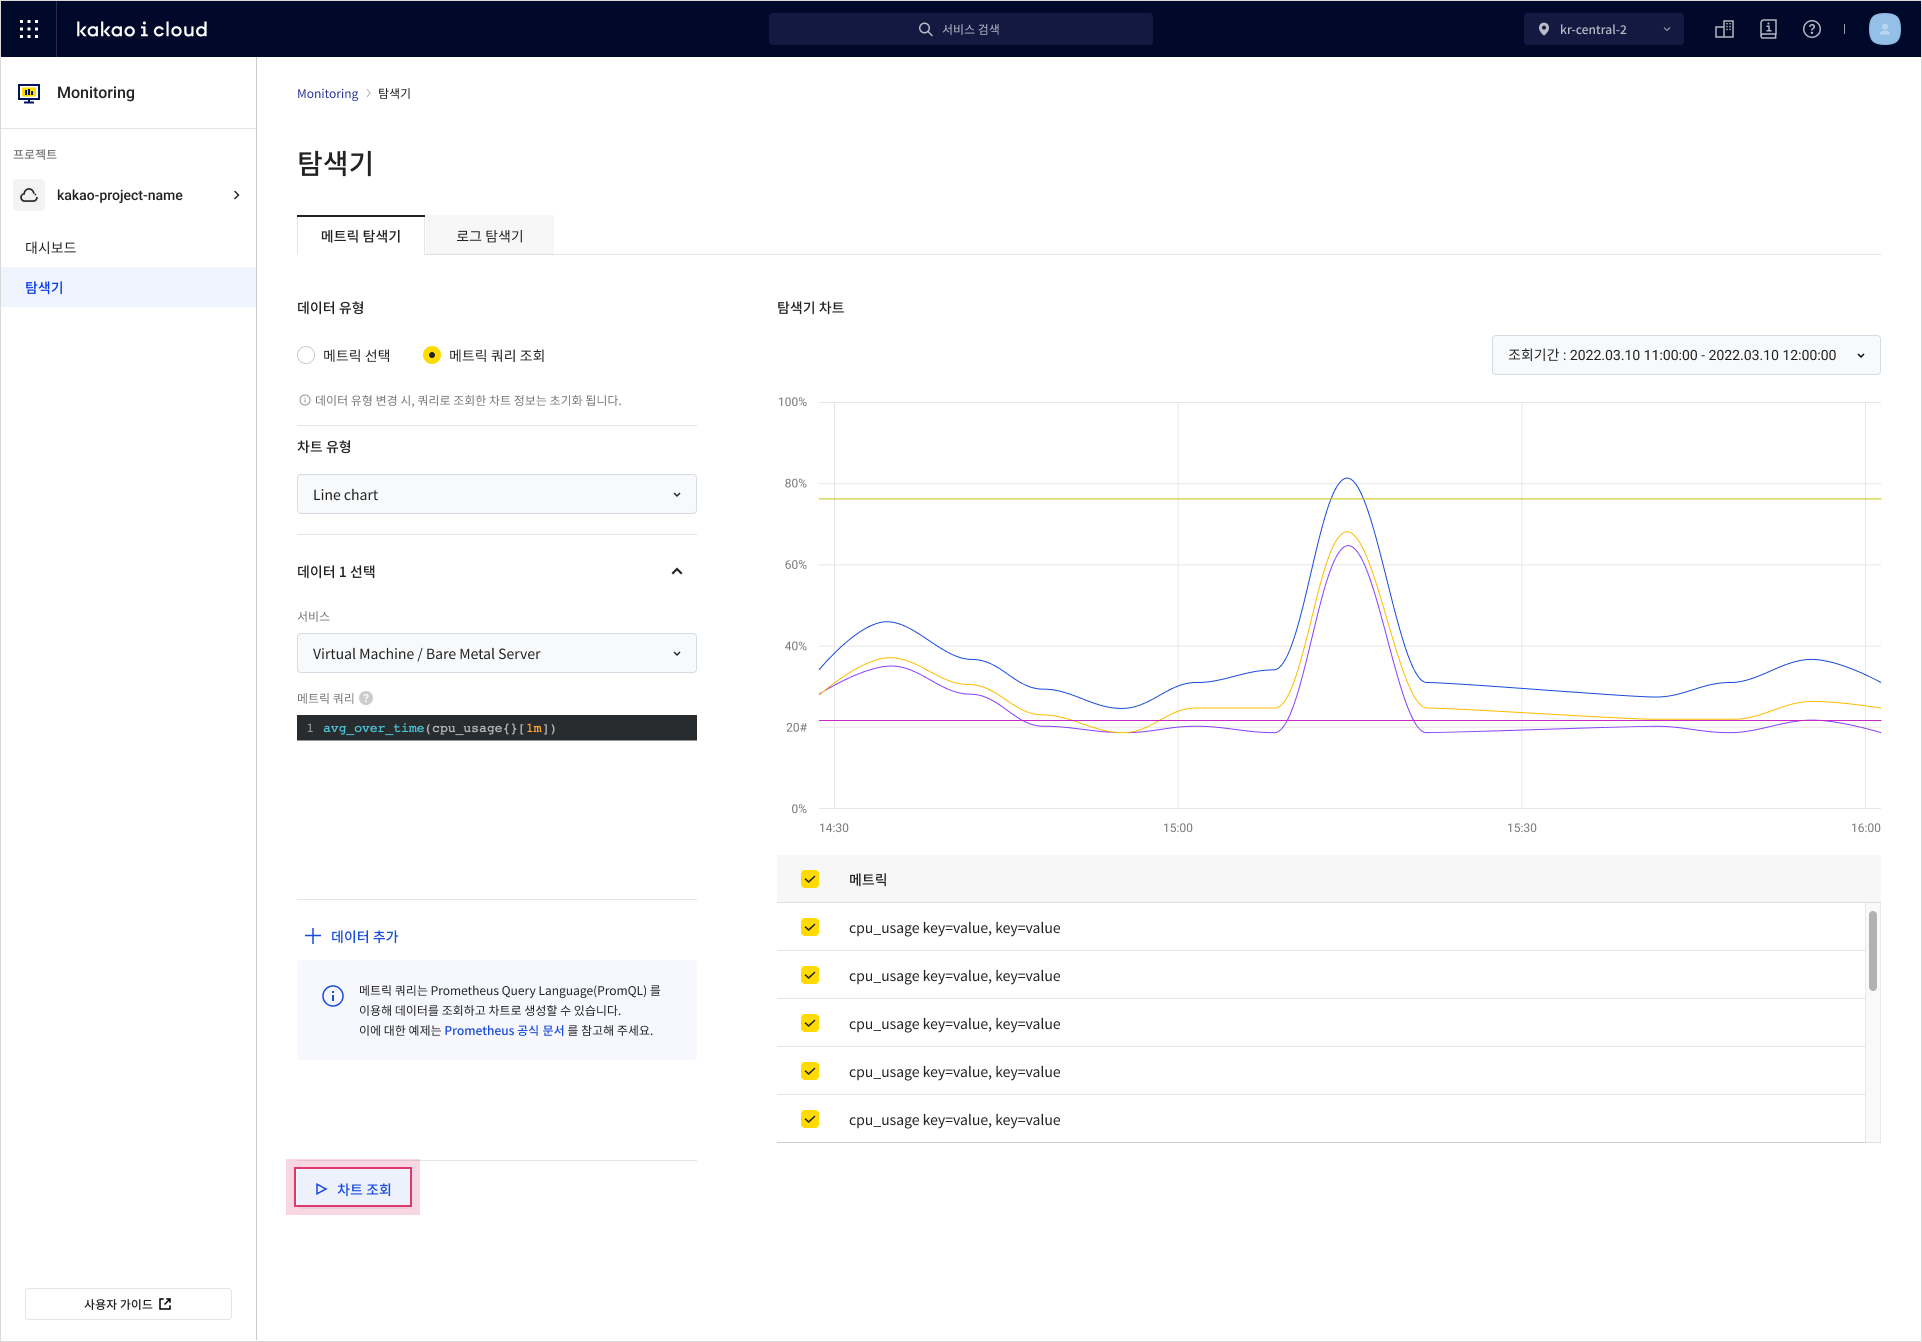
Select the service, enter your query, and select View chart.
Log explorer
Use the log explorer to view logs collected from agent-installed instances. You can view logs from the past 5 days.
View logs
-
Go to KakaoCloud console > Management > Monitoring.
-
Select the Log explorer tab to view logs and their details.
Item Description Collection date Date the log was collected Monitoring log ID Automatically assigned UUID when a log is generated Instance ID / Name - Instance ID: shown when using Beyond Compute Service
- Instance Name: shown when using MySQL, MemStore, or PostgreSQLWorkspace ID / Name - Applies to Advanced Managed Prometheus Log content Shows a snippet of the log content
- Select View details to see the full log
Search logs
You can filter logs using attributes or simply search with keywords. If you use only keywords, all log fields are searched.
If the keyword contains special characters such as -, _, or /, wrap it in quotes (“ ”).
Examples: “host-name”, “/folder/sub”, “instance-id”
-
Go to KakaoCloud console > Management > Monitoring.
-
In the Log explorer, use the search field or filter attributes to search logs.
- Filters vary depending on the service.
- When using attributes, a search chip is added. You can add multiple chips.
Attribute-based filters use AND, while general keyword searches use OR.
Filter field Description Instance ID Search logs by instance ID Instance name Search logs by instance name Log content Search log content by keyword Host name Search by host name assigned to instance Workspace name Filter by workspace name Workspace ID Filter by workspace ID File path Filter by log file path keyword -
After setting the conditions, search results are displayed in both chart and log list formats.