Monitor Hadoop cluster
This guide explains the step-by-step process of monitoring using Monitoring Flow and Hadoop Eco.
Prerequisites
Prepare Monitoring Flow environment
Before using Monitoring Flow, you must create a VPC and subnet. Refer to the Create VPC and Create subnet documentation to set up the environment for accessing internal resources.
- Go to KakaoCloud Console > Beyond Networking Service > VPC > VPC.
- Refer to the Create VPC documentation to create a VPC.
- Refer to the Create subnet documentation to create a subnet.
Monitoring Flow scenario example
You can monitor Hadoop cluster nodes using Monitoring Flow.
Scenario overview
This scenario uses API, Set Variables, For, and If steps to cover the following:
- Create a Hadoop cluster using KakaoCloud Hadoop Eco.
- Create a flow connection to link the API server subnet channel.
- Create a Monitoring Flow scenario for continuous monitoring of Hadoop cluster nodes.
- Use Alert Center integration to check the scenario results.
- Estimated time: 30 minutes
- Region: kr-central-2
- Prerequisites:
- Reference document:
1. Create Hadoop Eco cluster
This exercise uses Hadoop Eco. Verify that the cluster is in an active state.
If no Hadoop Eco clusters are available, refer to the Create cluster documentation to create one.
-
Go to KakaoCloud Console > Analytics > Hadoop Eco > Cluster.
-
Refer to the Create cluster documentation to create a cluster.
- In the VPC Settings section, select the VPC and subnet to connect to the flow connection.
- Select Create new security group in the Security Group section.
-
Confirm the Hadoop cluster ID.
- This information will be needed when configuring the Monitoring Flow steps.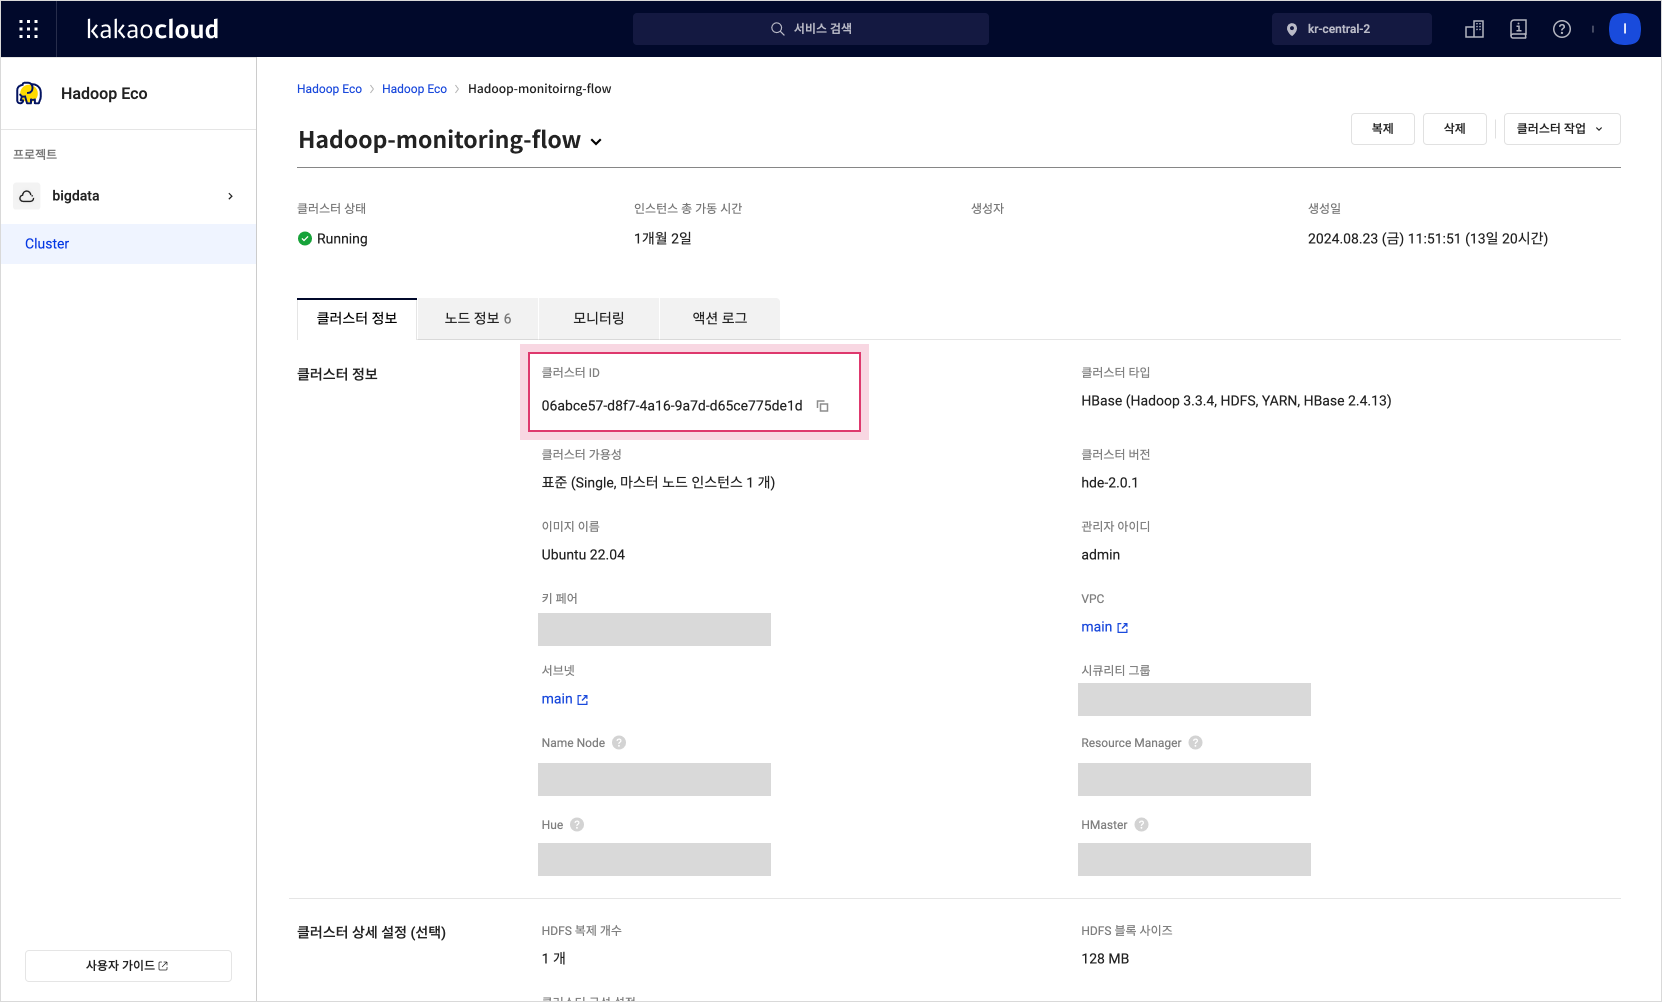 Cluster details
2. Issue access key
An Access Key consists of an Access Key ID and a Secret Access Key, which are required to issue API authentication tokens. The permissions of the Access Key are granted according to the IAM role assigned when creating the project. Refer to the Access Key documentation to issue an Access Key.
-
Go to KakaoCloud Console > User Settings > Access key.
-
Refer to the Create access key documentation to create an access key.
-
After creation, copy the Access Key ID and Secret Access Key.
- These will be used when configuring the Monitoring Flow steps.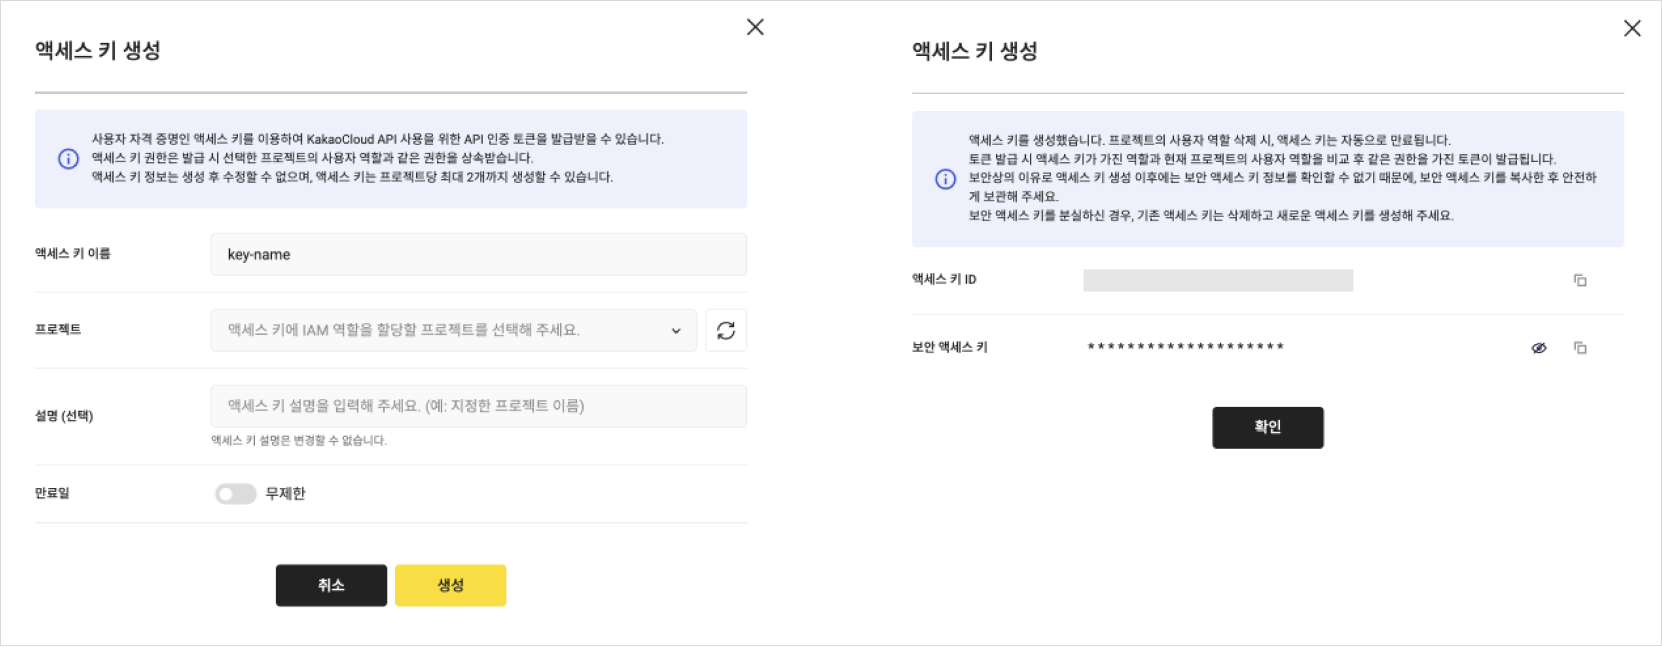 Create access key
3. Create flow connection
Create a flow connection to access internal resources in KakaoCloud and add the channel of the subnet where Hadoop Eco is deployed.
-
Go to KakaoCloud Console > Management > Monitoring Flow > Flow Connection.
-
Click the [Create flow connection] button.
-
Select the VPC where the cluster is deployed.
- Only active VPCs can be selected. -
Select the subnet where the Hadoop cluster is deployed for the flow connection.
- Only active subnets connected to the parent VPC can be selected.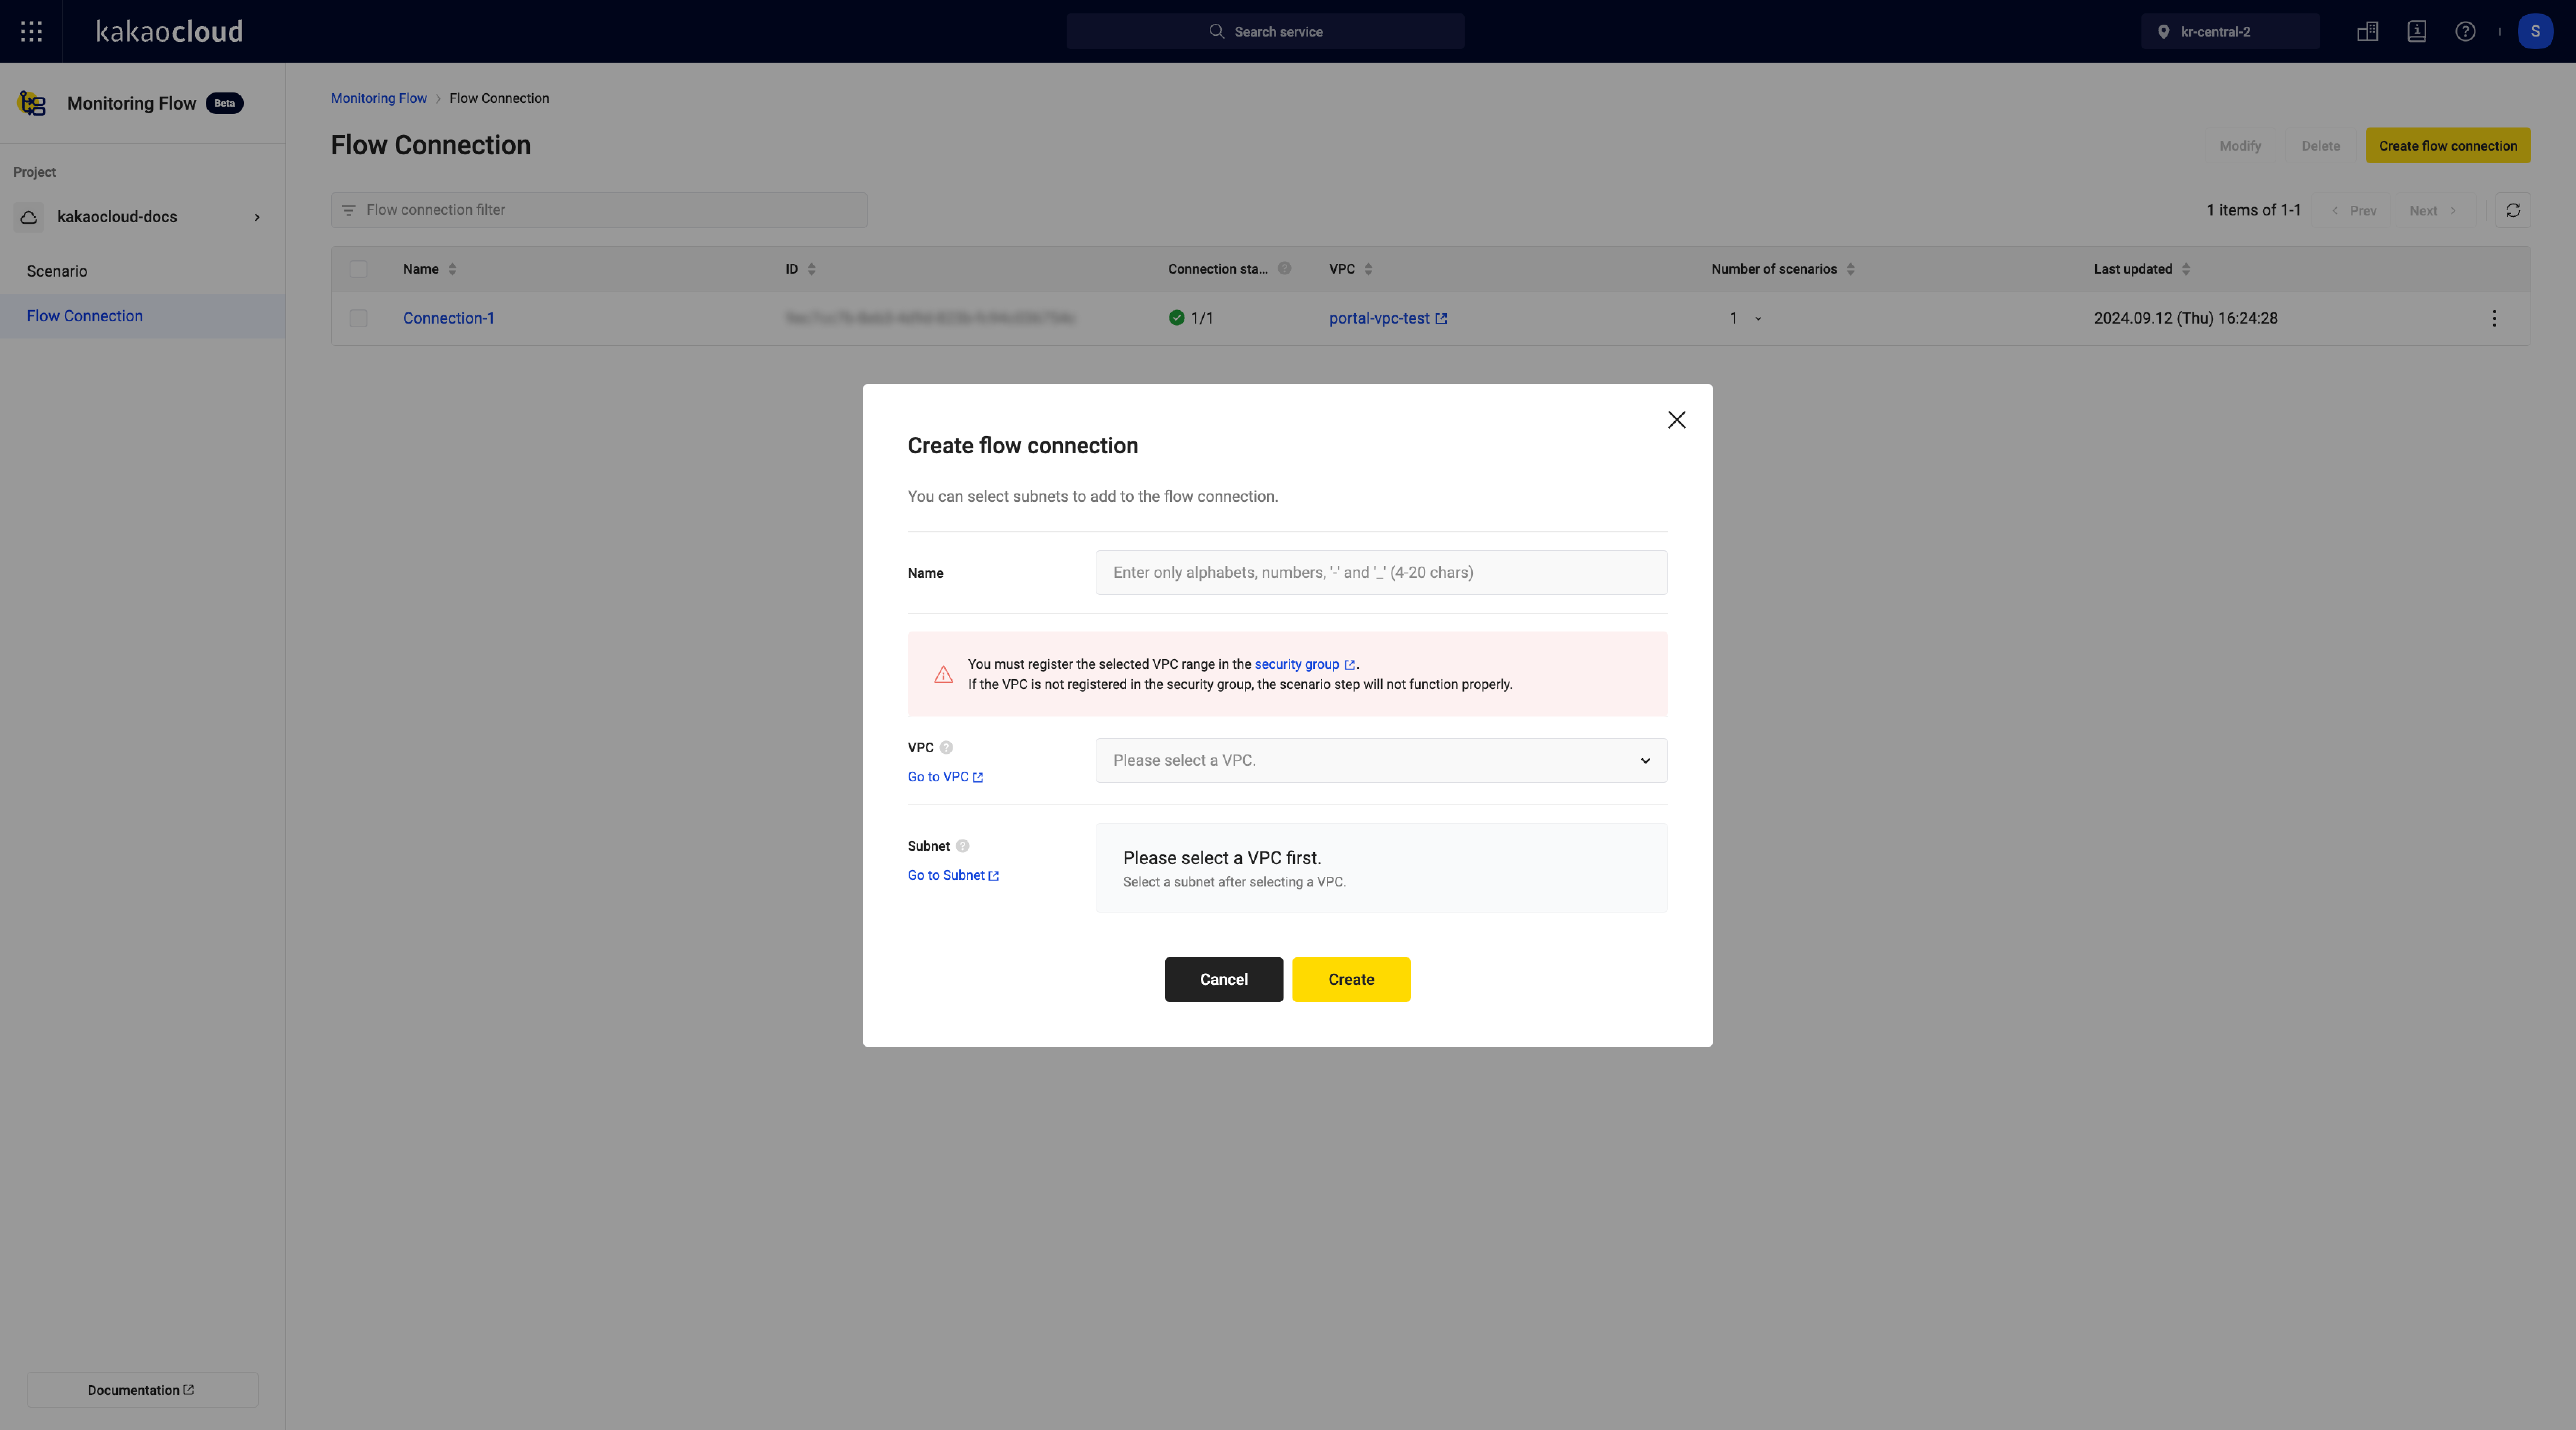 Create fow connection
4. Create scenario
Create a scenario by configuring the schedule and scenario steps.
-
Go to KakaoCloud Console > Management > Monitoring Flow > Scenario.
-
Click the [Create scenario] button to go to the scenario creation screen.
-
Check Use KakaoCloud VPC to access internal KakaoCloud resources.
-
Select one of the registered flow connections.
-
Set the schedule.
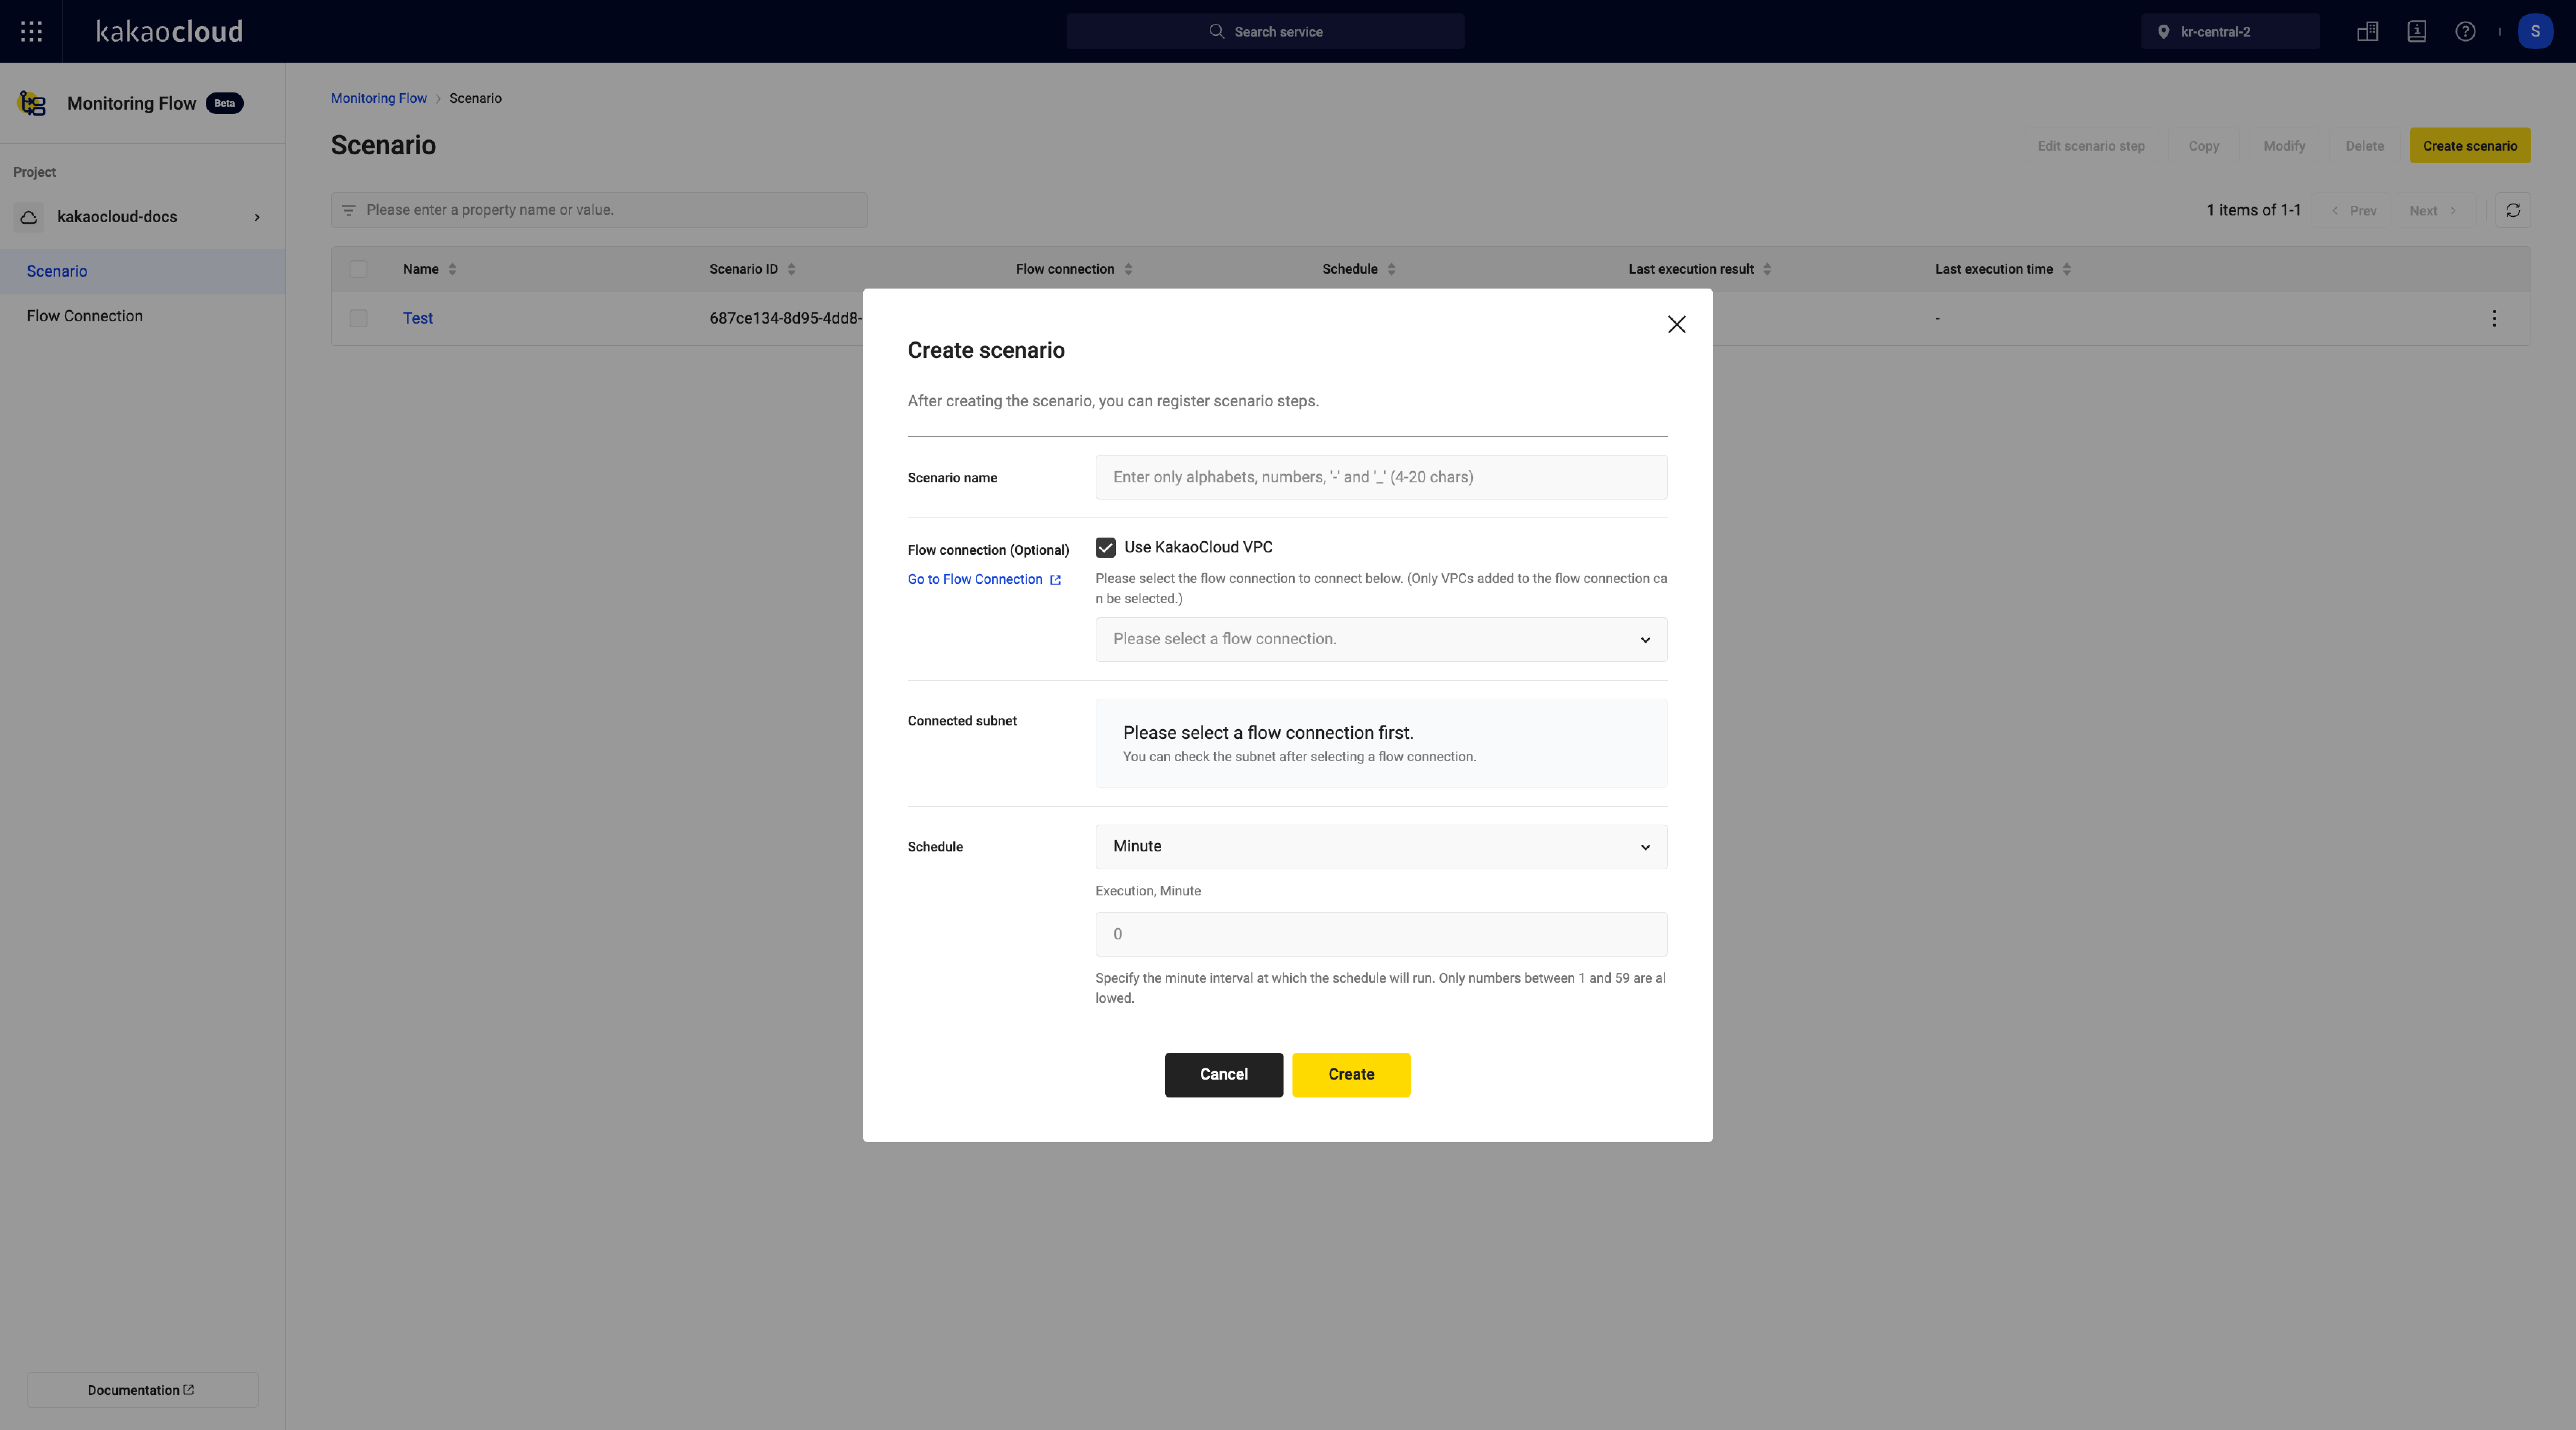 Create scenario
5. Add scenario step: Default Variable
Add steps to complete the scenario. Refer to the following example and enter the values.
-
In Management > Monitoring Flow > Scenario, click the scenario name.
-
In the Details tab, click [Add scenario step] at the top right.
-
Click [Manage default variable] at the top right to register default variables.
- Default variables must be registered before creating steps. -
Configure each item based on the following table. Enter all four examples.
Item Example 1 Example 2 Example 3 Example 4 Description Key vm-ip vm-list vm-status vm-is-master Key of the variable Type String JSON List string string Select the type of the variable Value []false Default value of the variable according to the selected type 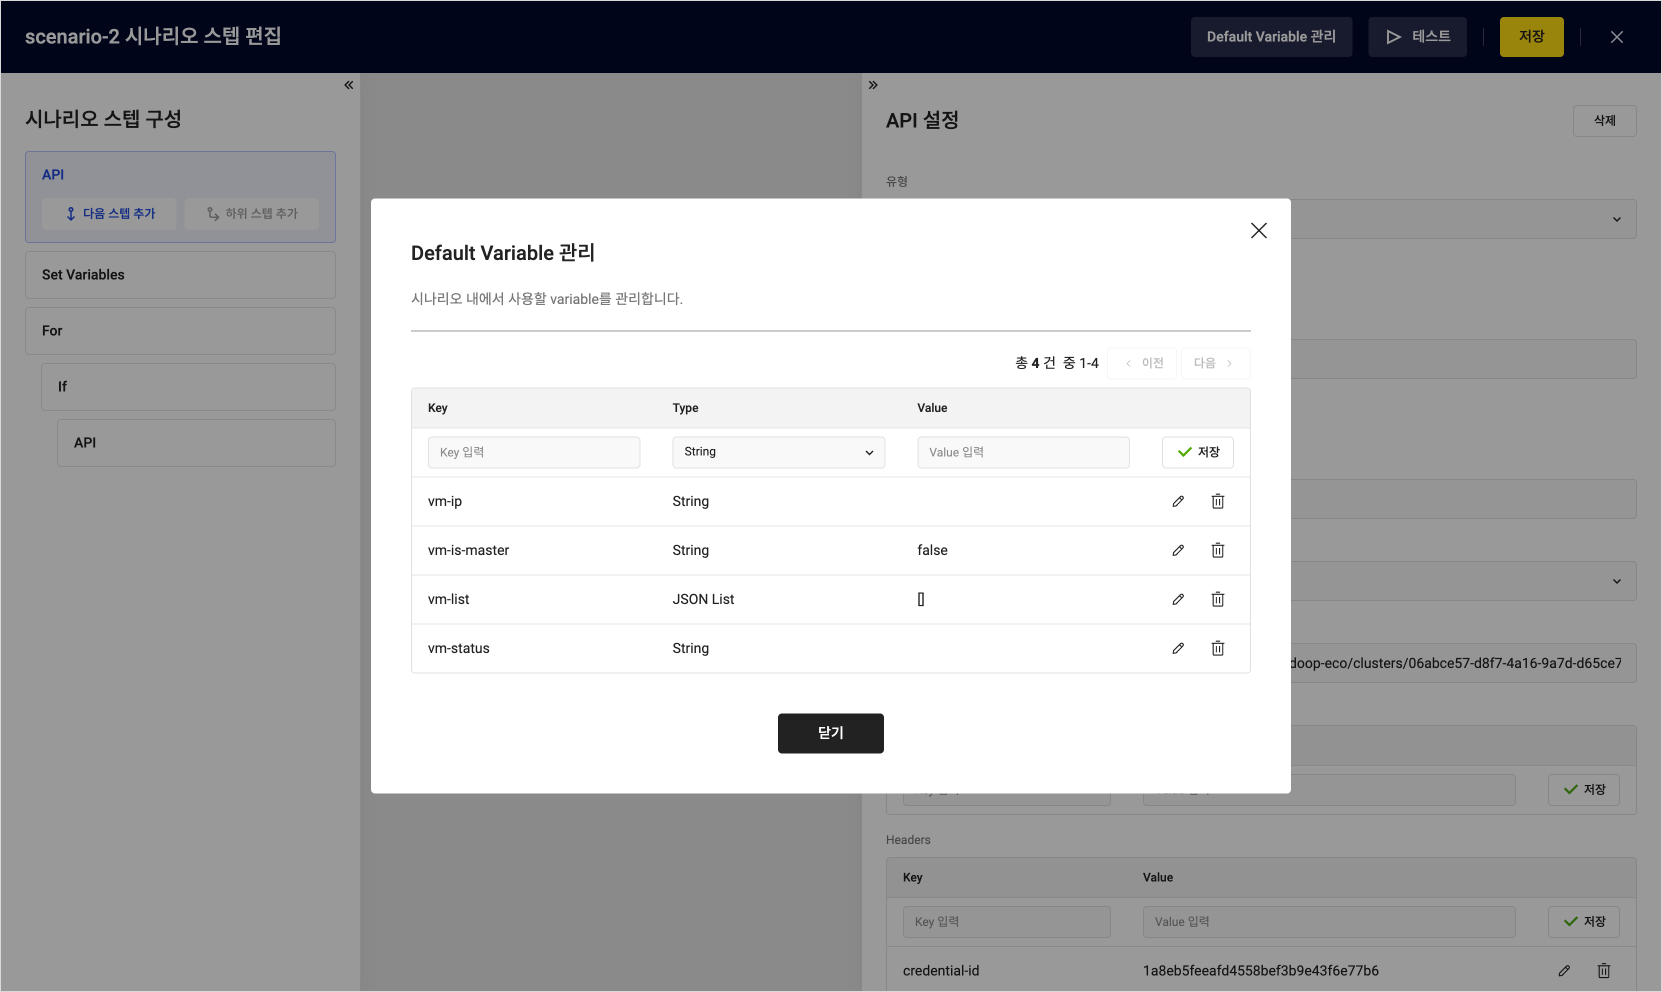 Manage default variables
 -
After saving, click [Close].
6. Add scenario step: API-1
Refer to the following example and enter the values.
-
In the New step settings panel, select
APIas the step type. -
Configure the required items based on the table. Enter all the examples.
Item Example 1 Example 2 Example 3 Description Type API Select APIStep name API-1 Enter the step name Expected Code 200 Enter the expected status code for the URL
- Defaults to200if not enteredMethod GET Select the API request method URL See the example above Enter the URL of the API
- Example:https://hadoop-eco.kr-central-2.kakaocloud.com/v2/hadoop-eco/clusters/{Cluster-ID}/vms
- You can check the cluster ID in the Analytics > Hadoop Eco > Cluster listHeader Key Content-type credential-id credential-secret Enter the header key
- Refer to Create clusterHeader Value application/json Access Key ID Secret Access Key Enter the header value
- Refer to Create cluster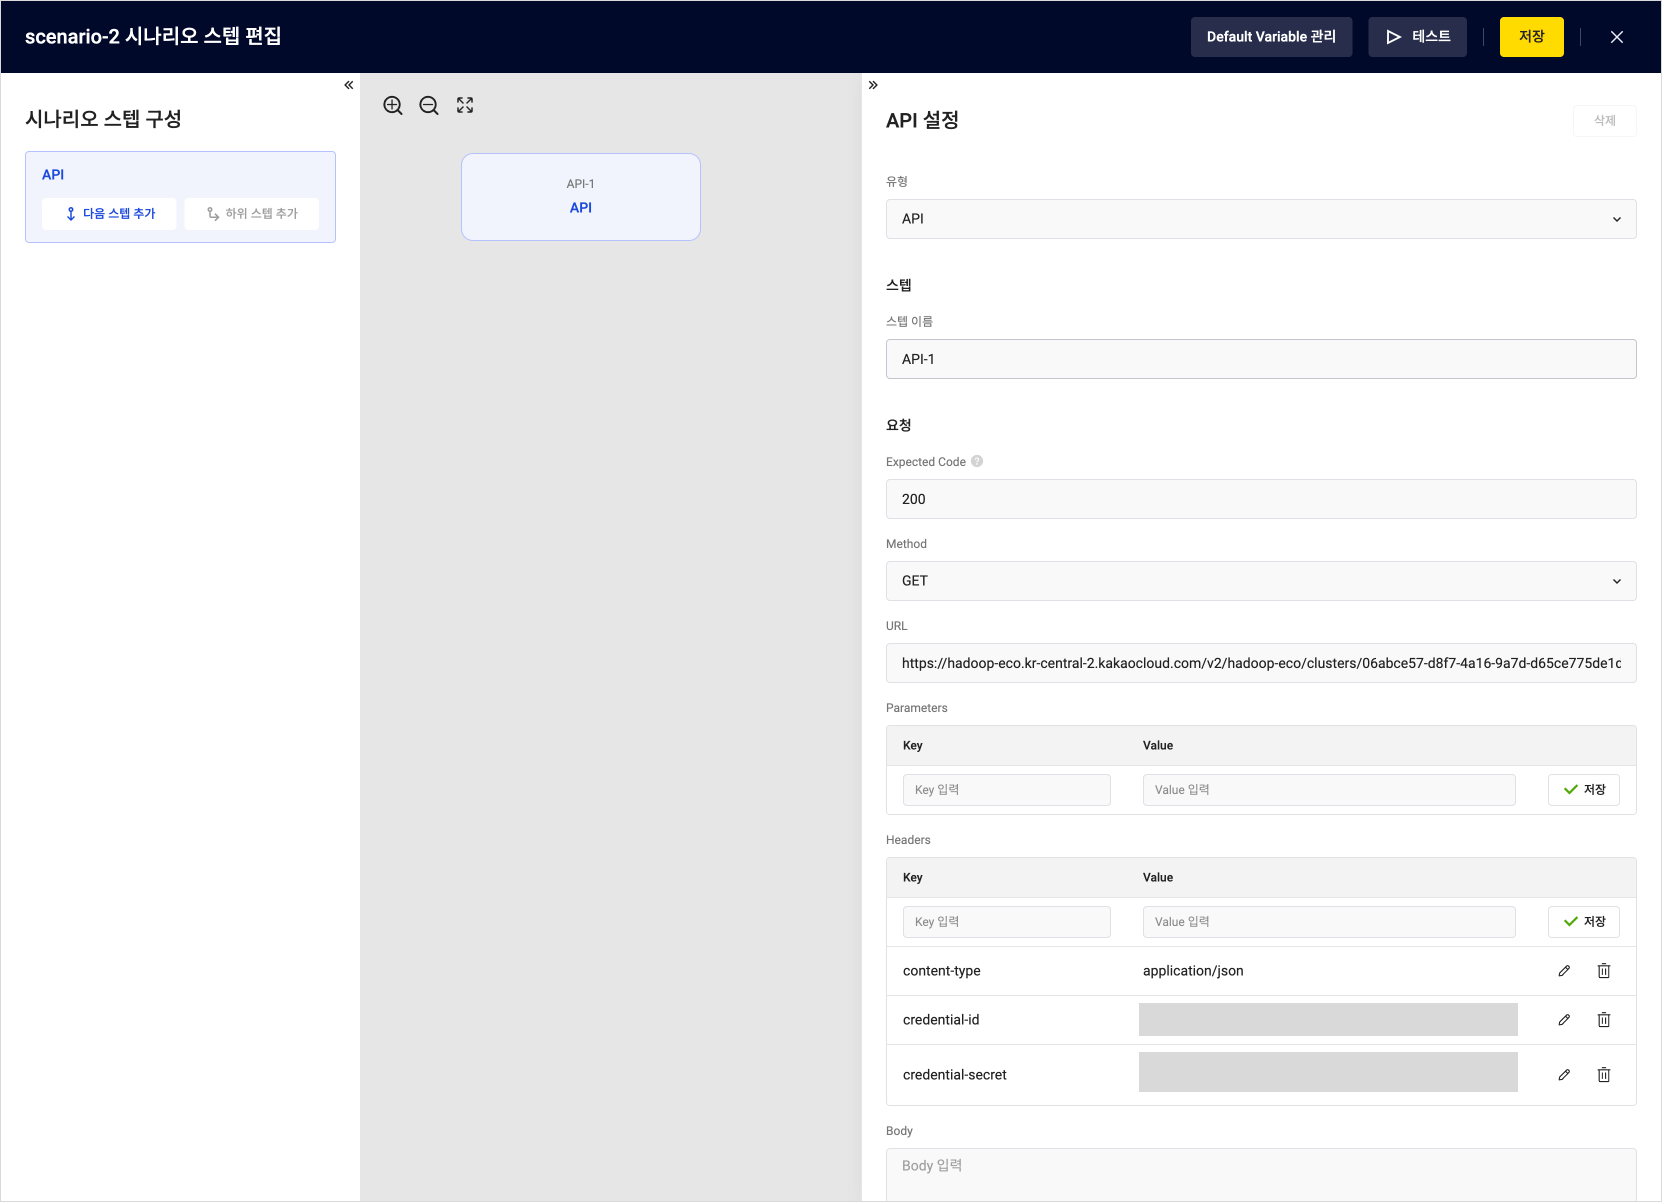 Add API Step-1
 -
After entering the required fields, click [Add next step] button on the left panel.
7. Add scenario step: Set Variables
Refer to the following example and enter the values.
-
In the New step settings panel, select
Set Variablesas the step type. -
Configure the required items based on the following table.
Item Example Description Type Set Variables Select Set VariablesStep name Variables-1 Enter the step name Variable ${vm-list}Select one variable from the Default Variables Step API selection API-1 Select the API step saved earlier Step request/response request Choose either requestorresponseStep component body Select parameters, headers, or body based on the chosen request or response Key content Enter or select the value of the chosen request/response 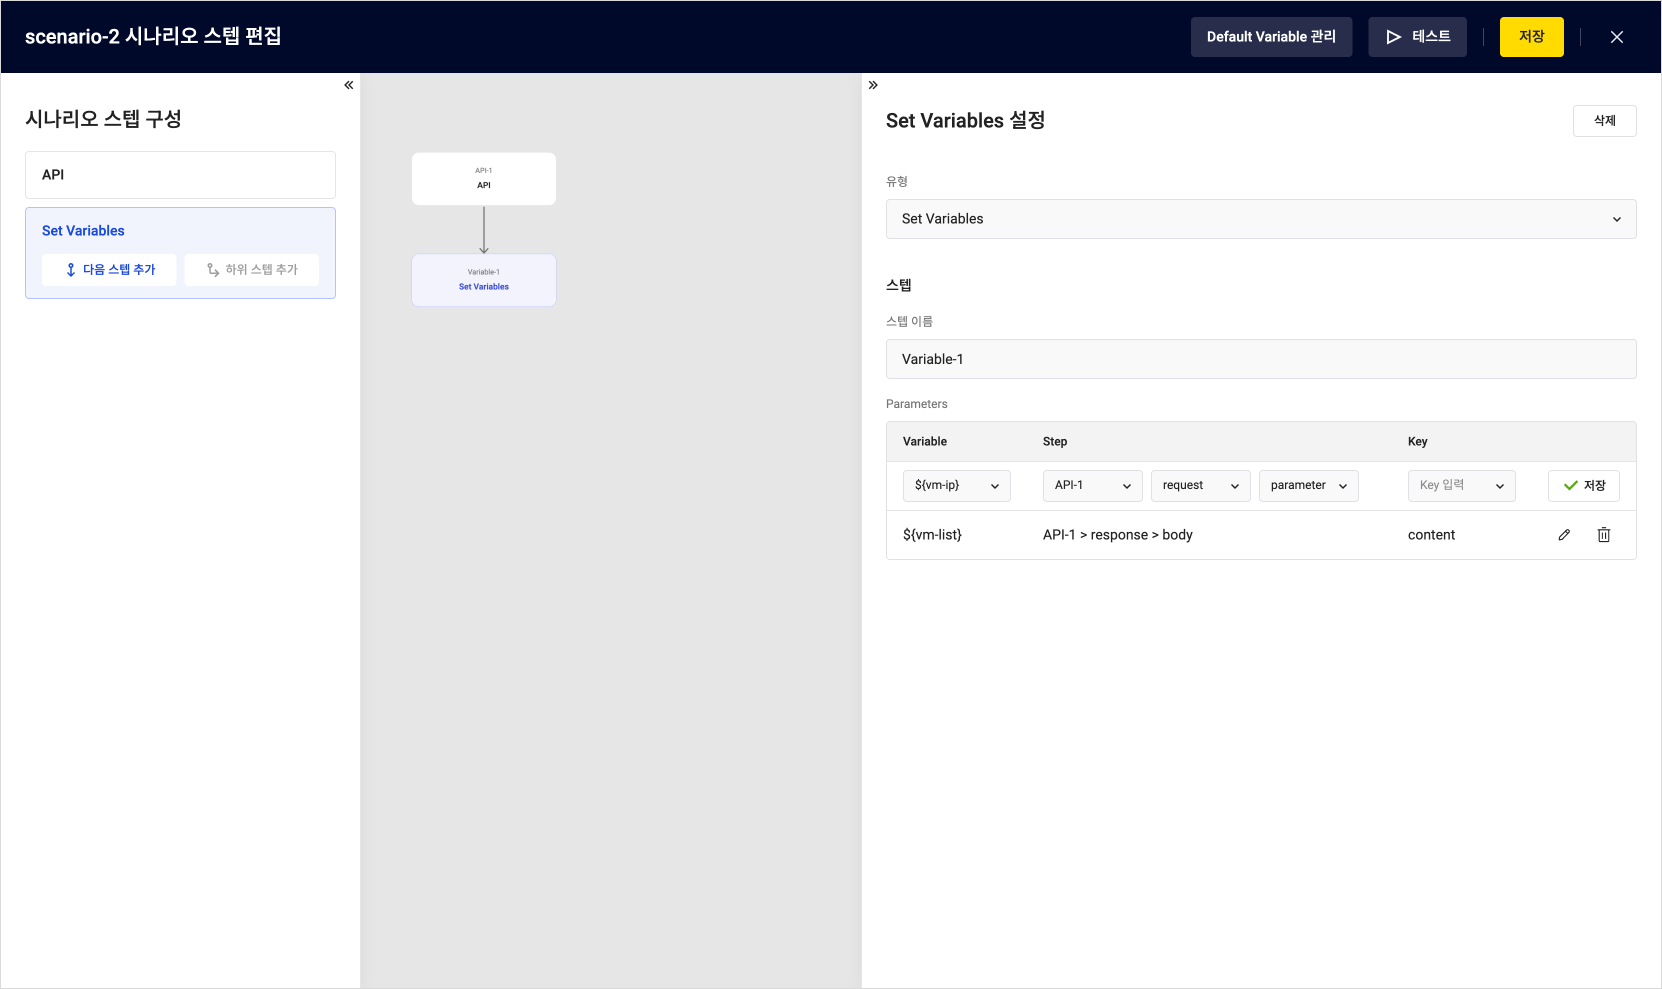 Add Set Variables Step
8. Add scenario step: For
Refer to the following example and enter the values.
-
In the New step settings panel, select
Foras the step type. -
Configure the required items based on the following table.
Item Example 1 Example 2 Example 3 Description Type For Select ForStep name For-1 Enter the step name Type foreach Select either countorforeachBase Variable ${vm-list}Select a JSON List from the Default Variables
- Used to iterate through multiple data entriesMarker Variable ${vm-ip}${vm-status}${vm-is-master}Select one variable from the Default Variables Marker Value marker.ip marker.status marker.ismaster Enter the marker value for data reading
- Must start withmarker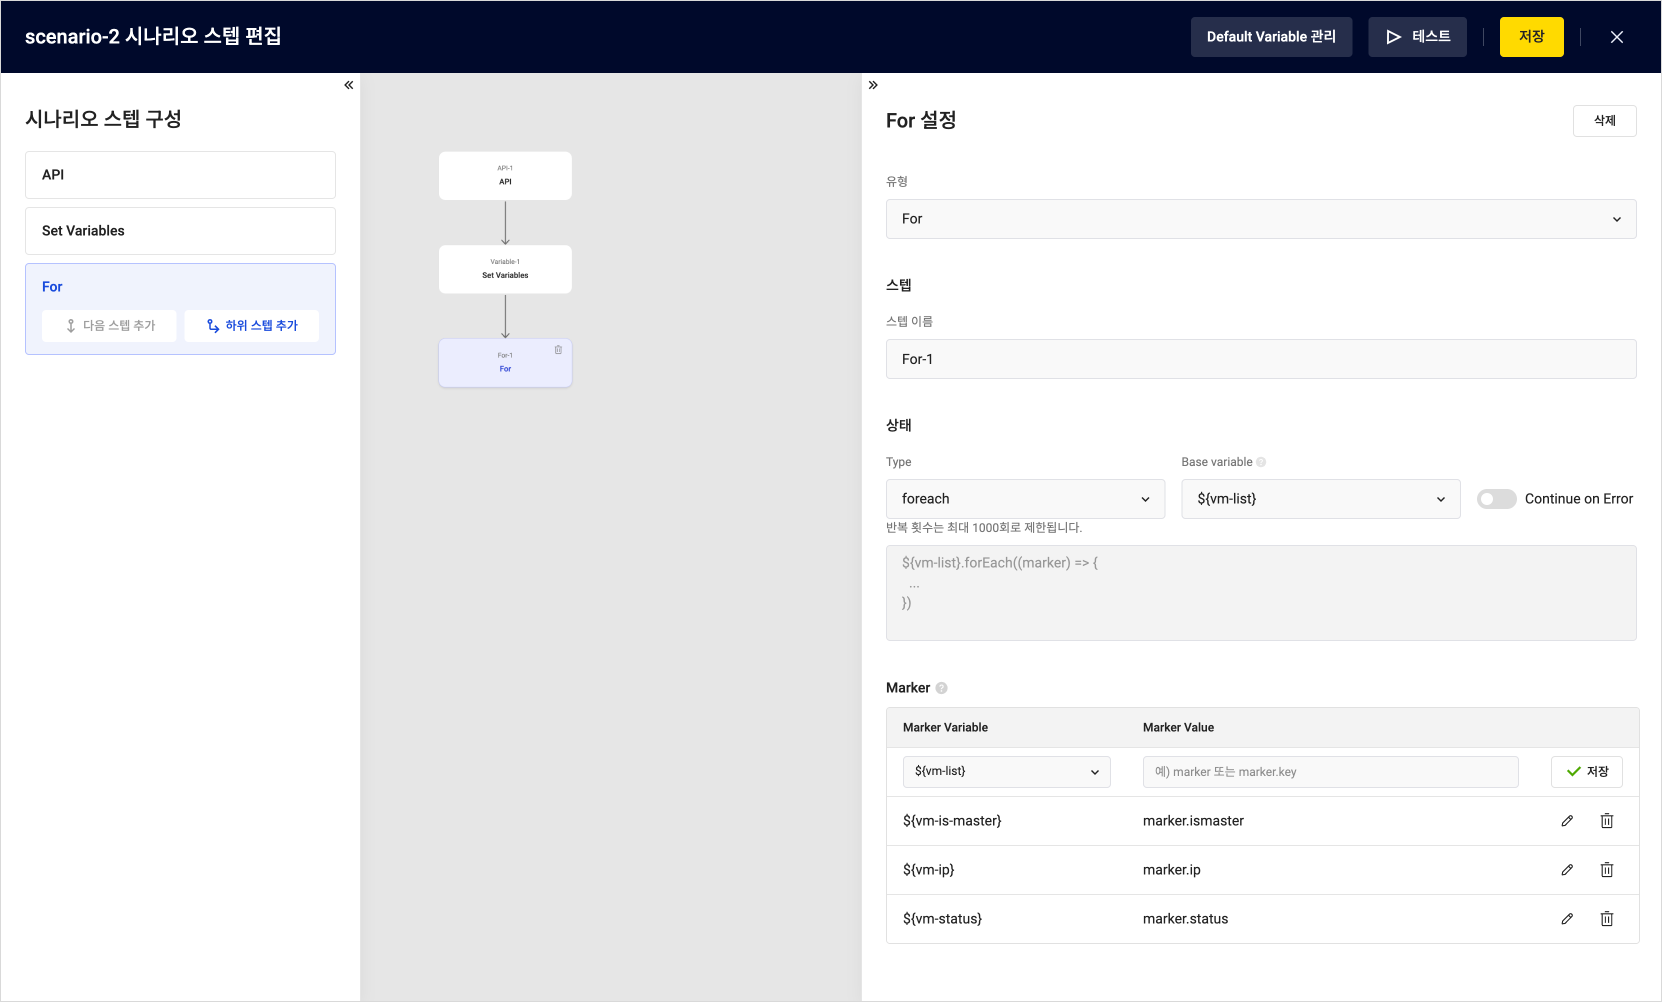 Add For Step
Both For and If steps must have a child step.
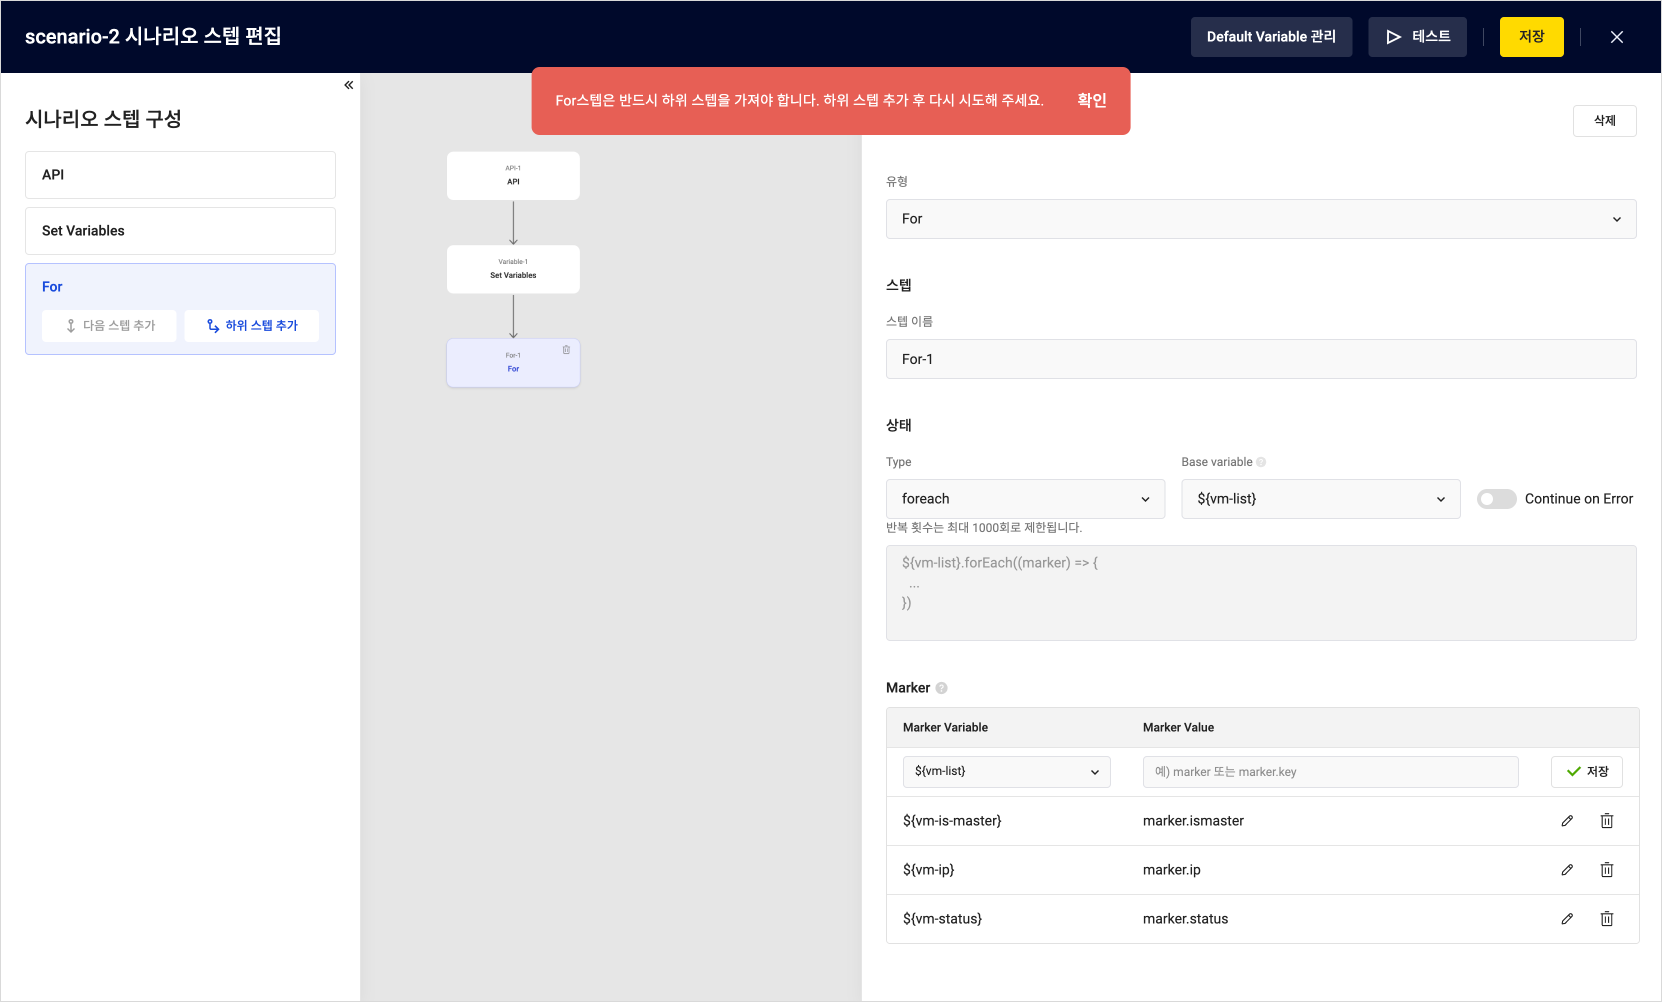 Child step required for For step
9. Add scenario step: If
Refer to the following example and enter the values.
- In the New step settings panel, select
Ifas the step type. - Configure the required items based on the table. Enter all examples.
| Item | Example 1 | Example 2 | Description |
|---|---|---|---|
| Type | If | ||
| Logical | and | Select either and or or | |
| Left Operand | ${vm-status} | ${vm-is-master} | Enter the condition for the left operand |
| Comparison | == | == | Select a comparison operator |
| Right Operand | Running | false | Enter the reference value |
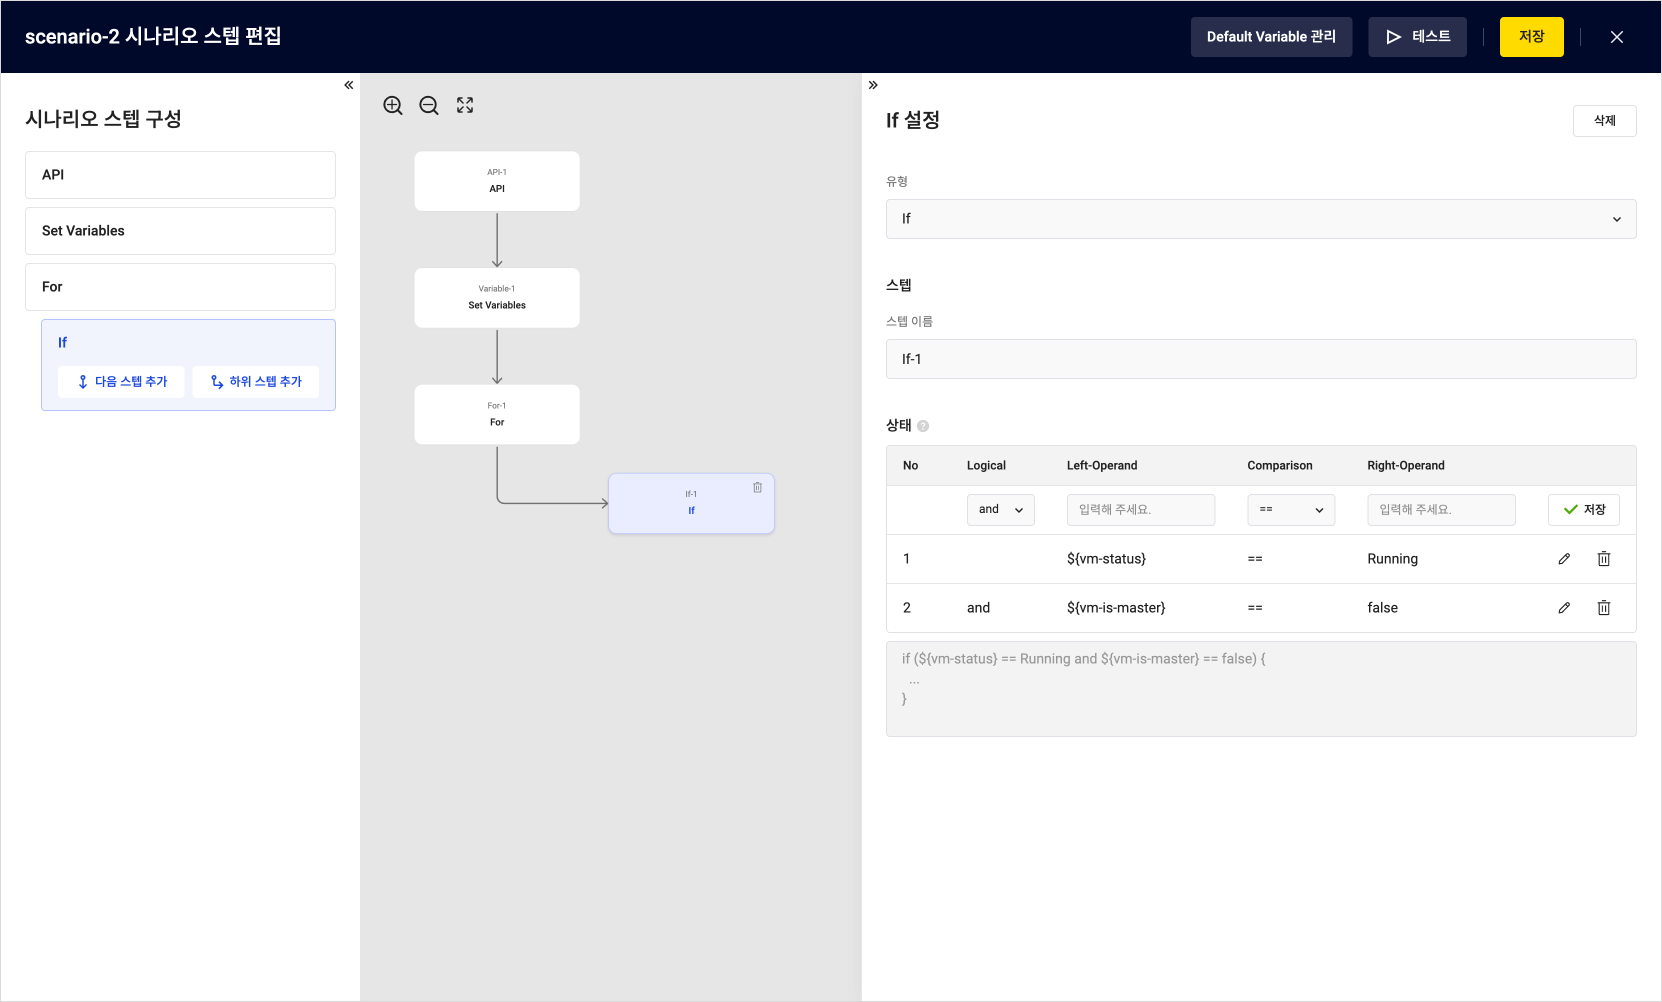 Add If Step
- After entering the required fields, click Add child step on the left panel.
10. Add scenario step: API-2
Refer to the following example and enter the values.
-
In the New step settings panel, select
APIas the step type. -
Configure the required items based on the following table.
Item Example Description Type API Select APIStep name API-2 Enter the step name Expected code 200 Enter the expected status code for the URL
- Defaults to200if not enteredMethod GET Select the API request method URL http:// ${vm-ip}:7001/v1/agent/healthEnter the URL of the API 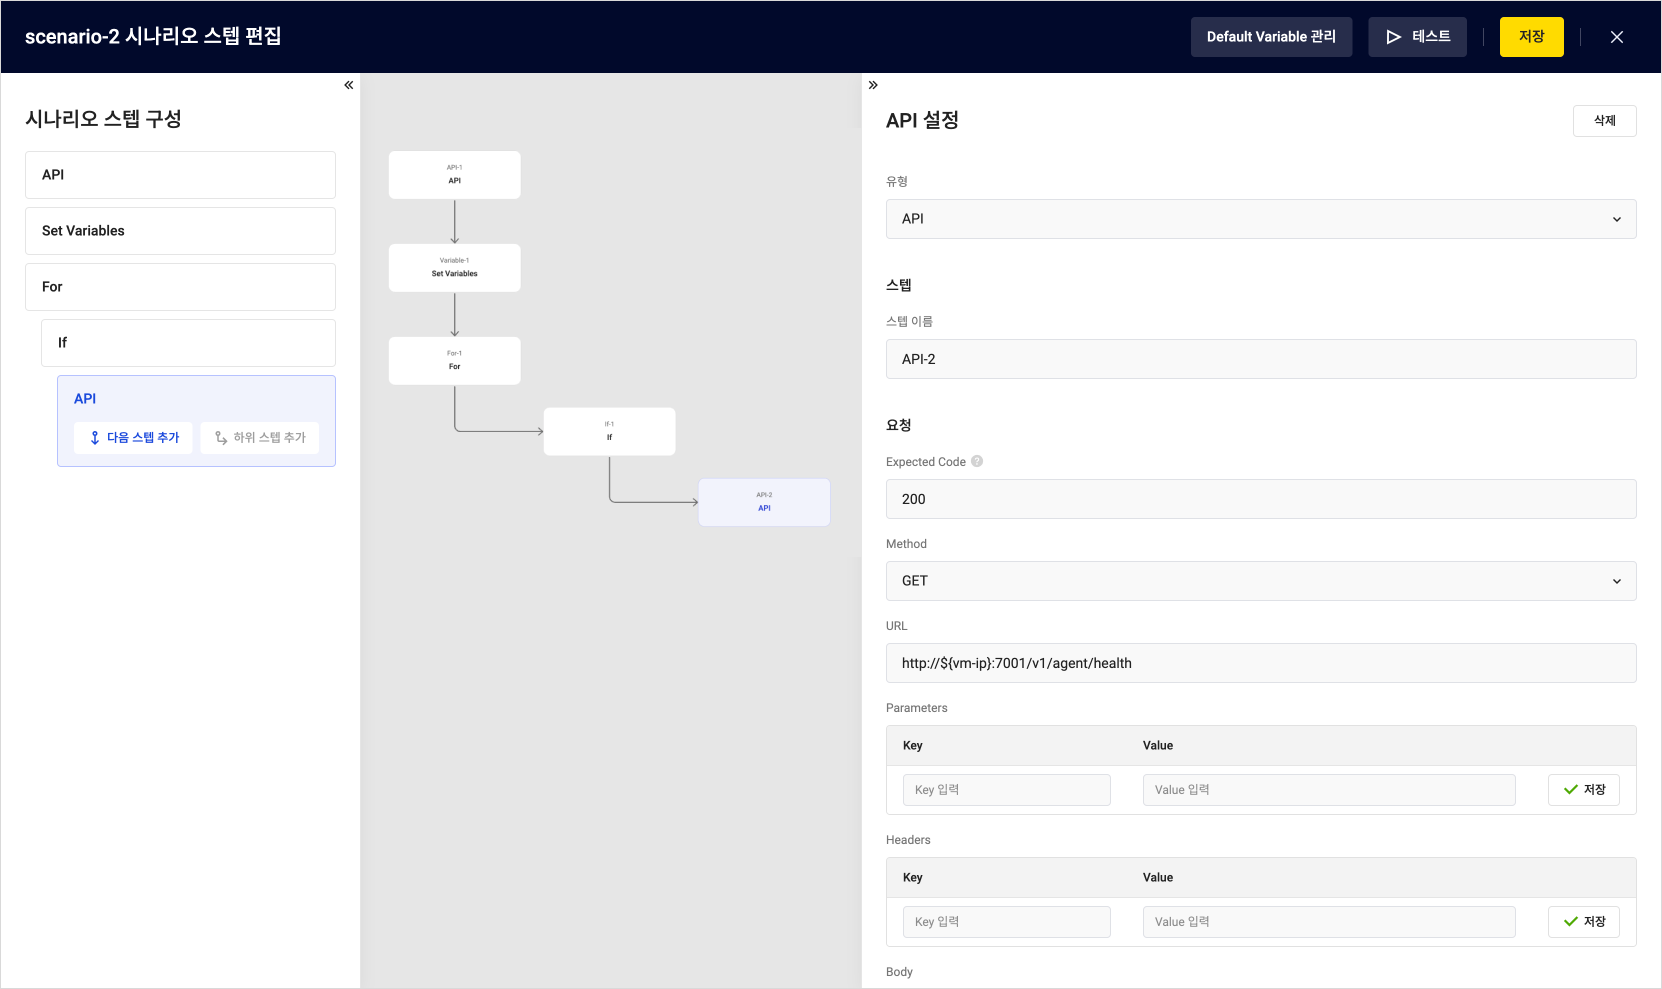 Add Flow Connection
 -
After entering the required fields, click the [Test] button at the top right to run a test.
- Refer to 11. Test scenario.
11. Test scenario
Add scenario steps and test them to ensure they are working properly.
-
After entering the required fields for the scenario steps, click the [Test] button at the top right.
-
Review the test results.
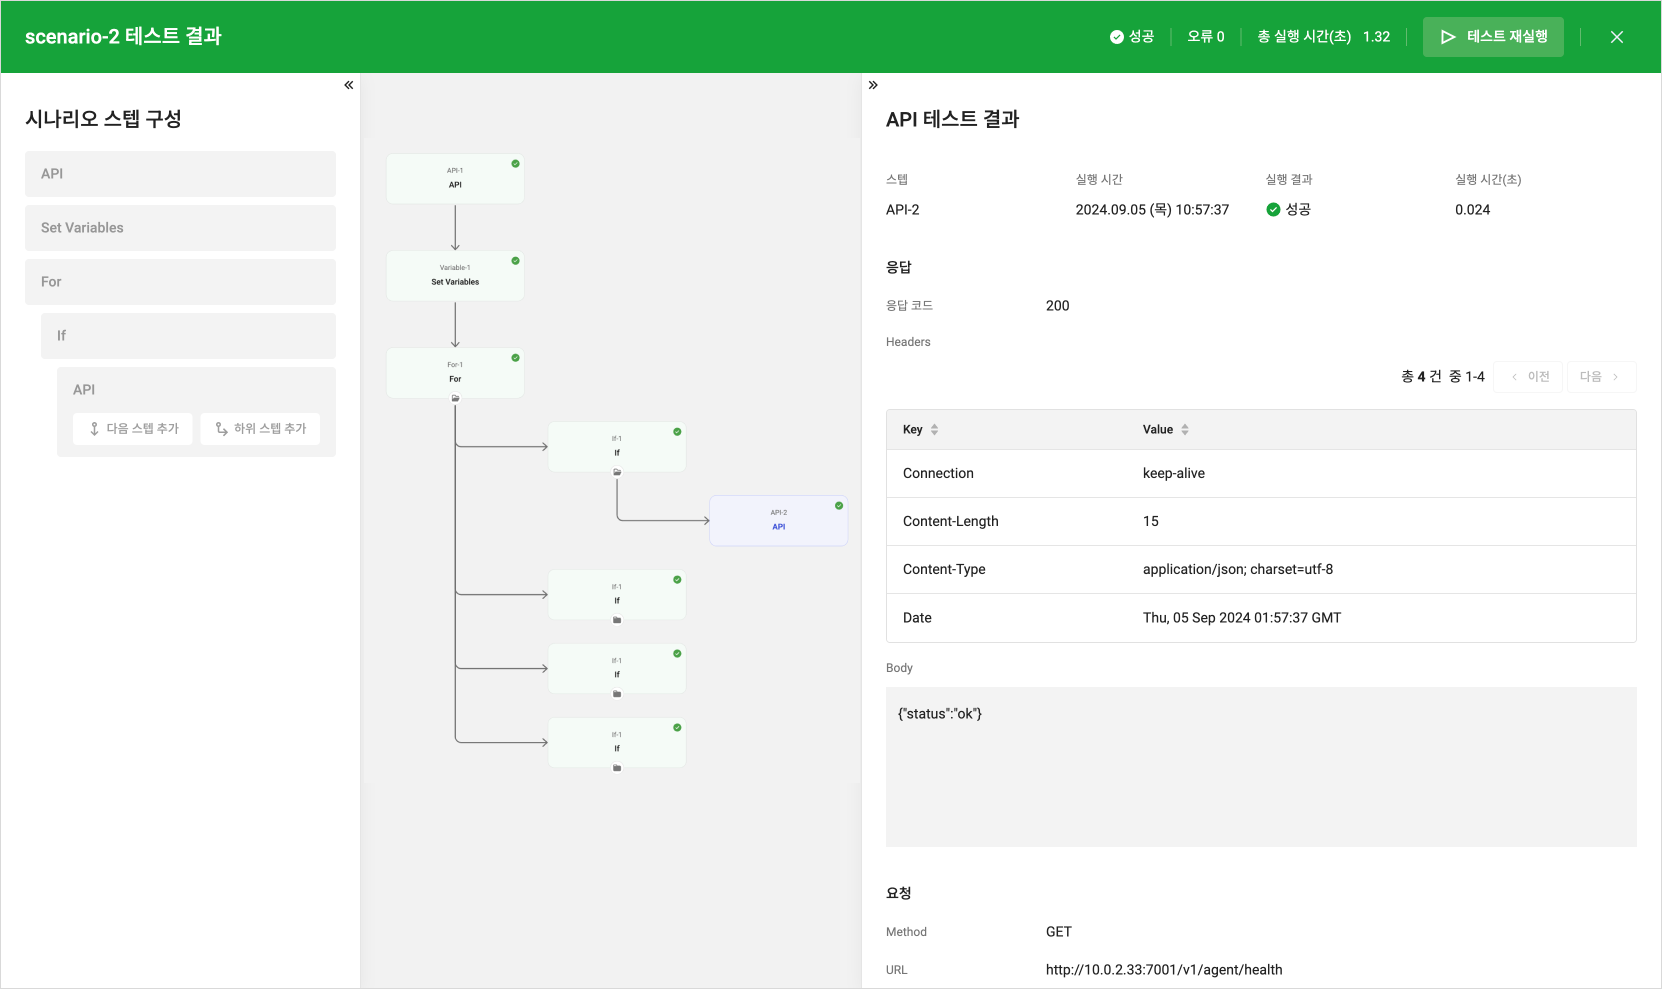 Test Success Result
 -
If there are any errors, check the error details at the bottom of the right panel.
-
After confirming the test results, click [Close] at the top right to return to the scenario step editing screen.
-
In the scenario step editing screen, click [Save] at the top right to save the created scenario. The saved scenario will be executed according to the set schedule.
-
Refer to 12. Check execution results for checking execution results.
An error will occur if you try to access an inactive cluster. Ensure that the correct IP address is entered.
12. Check execution results
Review the execution results and times for completed scenarios.
-
Go to KakaoCloud Console > Management > Monitoring Flow > Scenario.
-
In the Scenario menu, select the scenario to check.
-
In the scenario details screen, click the Execution results tab.
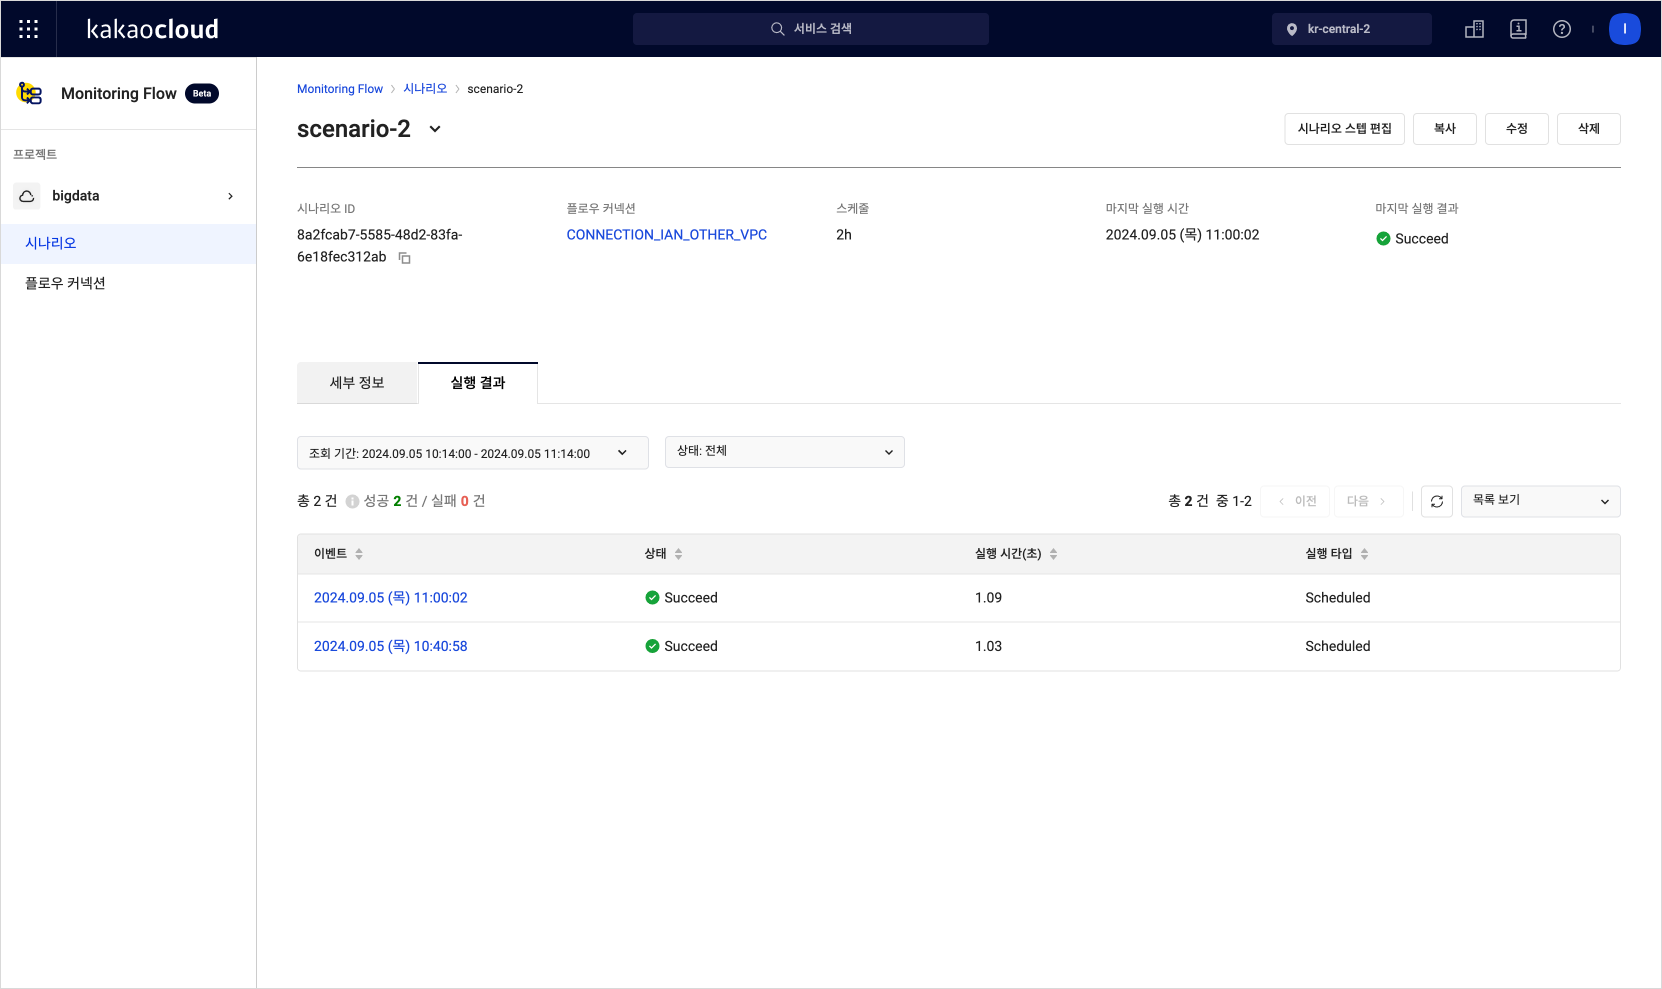 Scenario execution results list
 -
Click the event in the execution results list to view the detailed results.
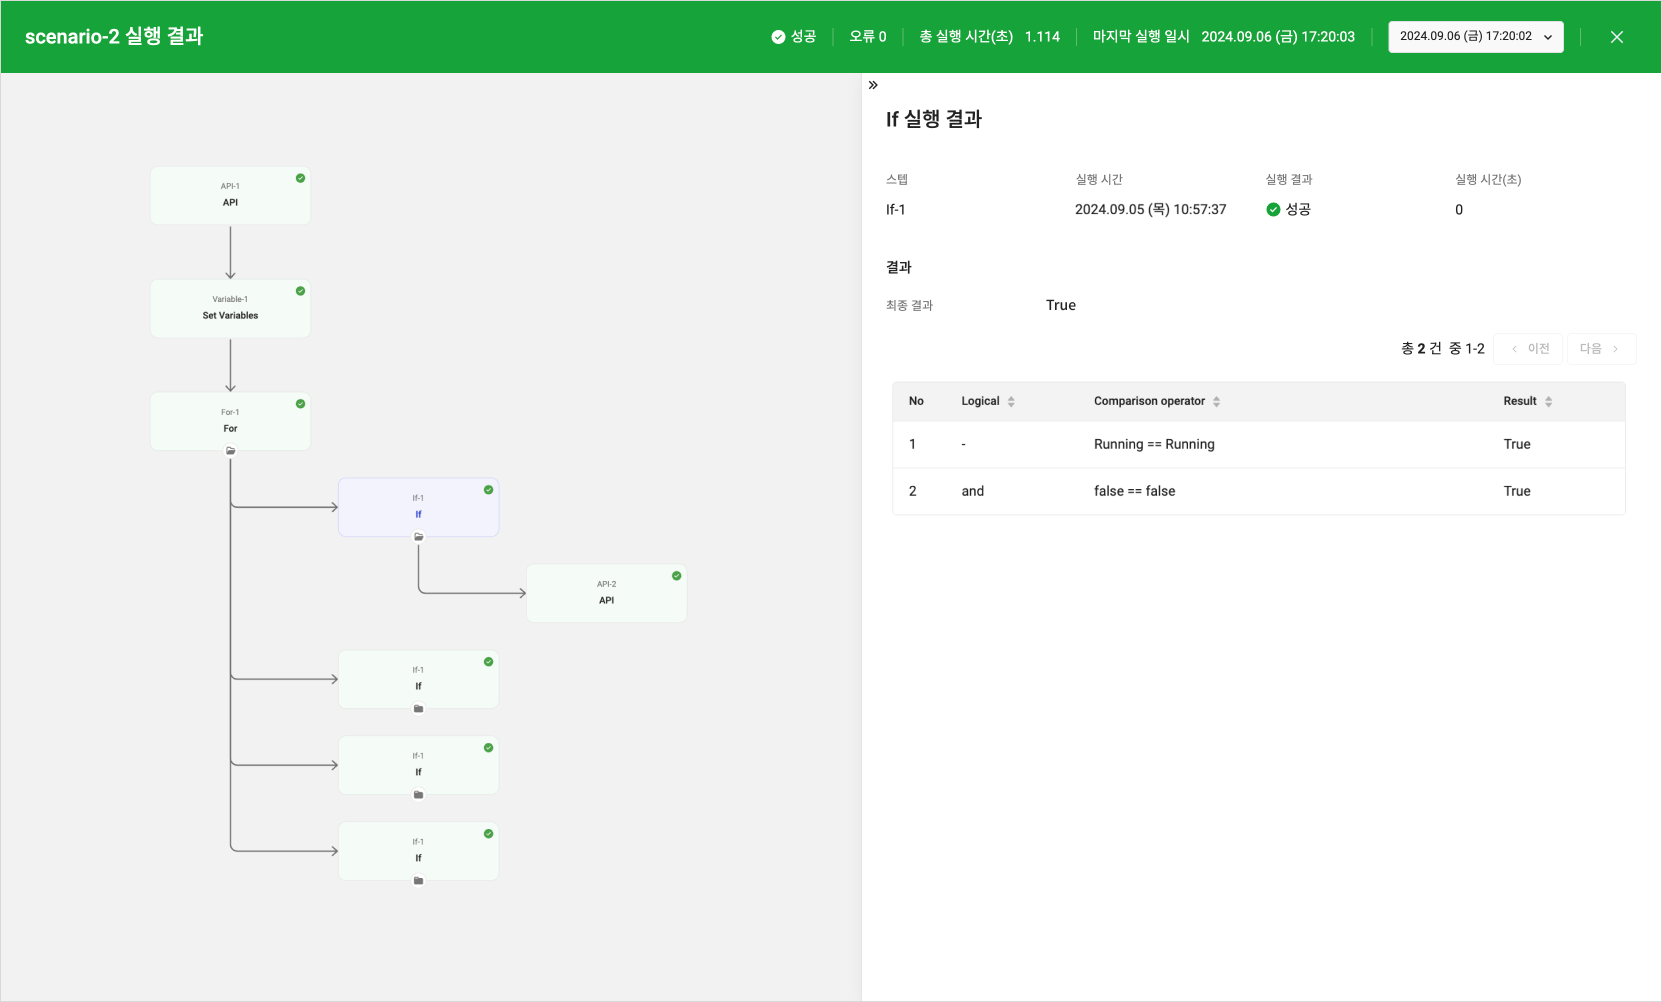 Scenario execution result details
13. Create alarm policy in Alert Center
You can receive alarms about Monitoring Flow scenario results (success/failure) by configuring alarm policies in Alert Center.
-
Go to KakaoCloud Console > Management > Alert Center > alarm Policy.
-
Refer to the Create alarm policy documentation and the following table to create alarm policies.
Item Configuration Condition Type Metric Service Monitoring Flow Condition Set up success/failure alarms for metrics
- By setting Scenario Success Count and Scenario Fail Count for each scenario, you can receive all metric alarms
- To receive only failure alarms, set Scenario Fail Count onlyResource Item Select the scenario to receive alerts for Threshold More than 1 count Duration 1 minute -
Click the [Next] button at the bottom to complete the alarm policy creation.
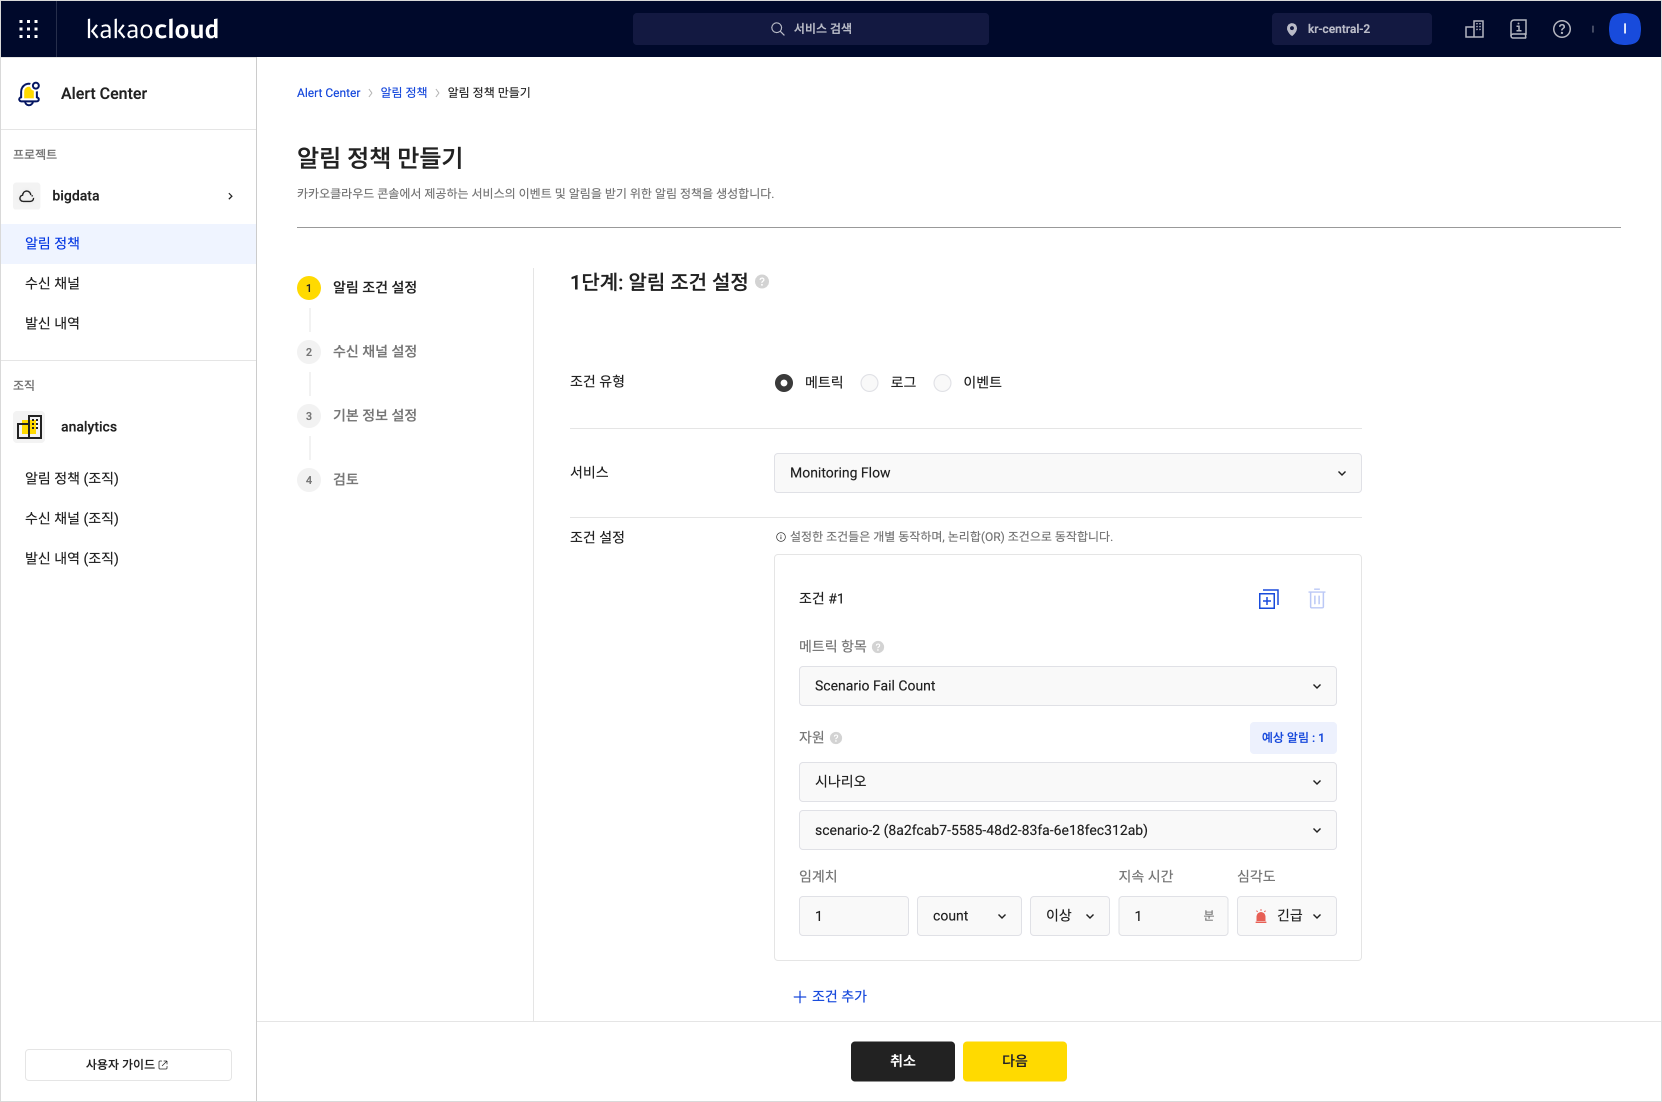 Create alarm Policy
 -
Verify that the alarm policy is working by checking whether alarms for success or failure are received for Monitoring Flow scenario results.