Integrate MySQL with Tableau
This guide explains how to integrate MySQL, KakaoCloud's database service, with Tableau.
- Estimated time: 30 minutes
- Recommended OS: MacOS, Ubuntu
- Prerequisites:
About this scenario
In this scenario, you will create a MySQL service on KakaoCloud and connect it to Tableau for data visualization. The key steps include:
- Setting up the KakaoCloud MySQL database service
- Configuring Tableau and integrating it with KakaoCloud MySQL
Tableau is a powerful data visualization and analytics tool that allows users to create dashboards and explore various data intuitively. It is available as an on-premises or cloud-based solution, offering flexibility based on organizational needs.
For more details, visit the official Tableau website.
Before you start
Before using Tableau, you need to configure the network and MySQL settings in KakaoCloud.
1. Set up network environment
To access the KakaoCloud MySQL database, you must configure the network environment. Refer to the table below to create a VPC with public and private subnets.
VPC and Subnet: tutorial
-
Go to KakaoCloud console > Networking > VPC.
-
Select the [+ Create VPC] button and configure the VPC and subnets as follows:
Category Item Configuration/Value VPC Information VPC Name tutorial VPC IP CIDR Block 10.0.0.0/16 Availability Zone Number of AZs 1 First AZ kr-central-2-a Subnet Configuration Public Subnets per AZ 2 kr-central-2-a Public Subnet IPv4 CIDR Block: 10.0.0.0/20
Private Subnet IPv4 CIDR Block: 10.0.16.0/20 -
Review the topology at the bottom and select [Create] if everything looks correct.
- The subnet status will change from
Pending Create>Pending Update>Active. Proceed to the next step only after it reachesActive.
- The subnet status will change from
2. Configure security groups
Security groups help restrict unauthorized access while allowing necessary traffic for secure communication between MySQL and Tableau through a Bastion host.
Security Group: tutorial-bastion-sg
-
Go to KakaoCloud console > VPC > Security Groups and create a security group with the following settings:
Name Description (Optional) tutorial-bastion-sg Security policy for Bastion host -
Select [+ Add Rule] and configure the inbound rules as follows:
Rule Item Configuration bastion inbound policy 1 Protocol TCPSource {Your Public IP}/32Port Number 22 Description (Optional) Allow SSH access bastion inbound policy 2 Protocol TCPSource Depending on the Tableau environment, set {IP of Tableau Service Region}/32or{Your Public IP}/32.
If using a SaaS-based Tableau service, check Tableau's official site for the service IP.Port Number 3306 Description (Optional) Allow MySQL access
3. Create MySQL database instance
Create a MySQL instance to set up the database environment.
MySQL Database Instance: tutorial-tableau
-
Go to KakaoCloud console > Data Store > MySQL.
-
Under Instance Group, select [Create Instance Group] and configure the following settings:
Category Item Configuration/Value Notes Basic Settings Instance Group Name tutorial-tableau Instance Availability Single (Primary Instance) MySQL Settings Engine Version Use the designated version Primary Port 3306 MySQL Username admin MySQL Password root1234 Parameter Group Use the designated value Select a parameter group matching the engine version Instance Type m2a.large Primary Storage 100 GB Log Storage Type/Size 100 GB Network Settings VPC tutorial Subnet private-subnet (10.0.16.0/20)
4. Create bastion host
Set up a Bastion host to act as a proxy for securely accessing the MySQL database.
Bastion Host: tutorial-bastion
-
Go to the Beyond Compute Service > Virtual Machine menu in the KakaoCloud console.
-
Create a VM instance that will act as the Bastion host by referring to the following table for configurations:
Category Item Configuration/Input Value Notes Basic Information Name tutorial-bastion Quantity 1 Image Ubuntu 20.04 Instance Type m2a.large Volume Root Volume 20 Key Pair {USER_KEYPAIR}⚠️ The key pair must be securely stored upon first creation.
Lost keys cannot be recovered and must be reissued.Network VPC tutorial Security Group tutorial-bastion-sgNetwork Interface 1 New Interface Subnet main (10.0.0.0/20) IP Allocation Type Automatic -
Associate a public IP with the created Bastion instance.
5. Create database
Connect to the MySQL database instance via the Bastion host and create a database and table.
MySQL Database: tableau
-
If MySQL client is not installed on the Bastion host, install it using the following command:
sudo apt-get install mysql-client
``a -
Connect to the MySQL instance using the MySQL client. Replace
{MYSQL_ENDPOINT}with the endpoint of the MySQL instance andadminwith the username.mysql -h ${MYSQL_ENDPOINT} -u admin -p
``a
After entering the command, a password prompt will appear. Enter `root1234`. -
Create a database named
tableau:CREATE DATABASE tableau DEFAULT CHARACTER SET utf8;
USE tableau;
``a -
Create a table named
tableau_connection:CREATE TABLE tableau_connection (
id INT AUTO_INCREMENT PRIMARY KEY,
name VARCHAR(100)
);
ALTER TABLE tableau_connection ADD COLUMN example_column VARCHAR(100);
``a -
Verify that the table was created successfully by listing the tables in the database. If
tableau_connectionappears in the list, the creation was successful.SHOW TABLES;
``a
6. Configure proxy
Configure the Bastion host as a proxy. This ensures that MySQL is not exposed to the public network and can only be accessed internally. External clients must connect through the Bastion host, enhancing security and access control.
Proxy Configuration
-
Retrieve the Private Endpoint IP of the MySQL instance:
nslookup ${MYSQL_ENDPOINT}
``a -
Install Nginx on the Bastion instance and configure it as a proxy:
sudo apt update # Install Nginx
sudo apt install nginx-full

sudo vi /etc/nginx/nginx.conf
...

# Add the following configuration
stream {
   upstream mysql_backend {
      server ${MYSQL_ENDPOINT_IP}:3306;
   }
   server {
      listen 3306;
      proxy_pass mysql_backend;
   }
}

sudo systemctl reload nginx  # Apply Nginx configuration
``a -
Verify that the proxy configuration was applied successfully:
sudo systemctl status nginx # Check if the Nginx service is running
sudo ss -nlpt | grep 3306 # Check if port 3306 is listening
``a
Get started
Now, integrate the configured KakaoCloud database environment with Tableau and begin visualizing data.
Step 1. Connect to Tableau and data source
- Open Tableau and select External Assets from the main screen.
- Select Create > Workbook in the top left corner.
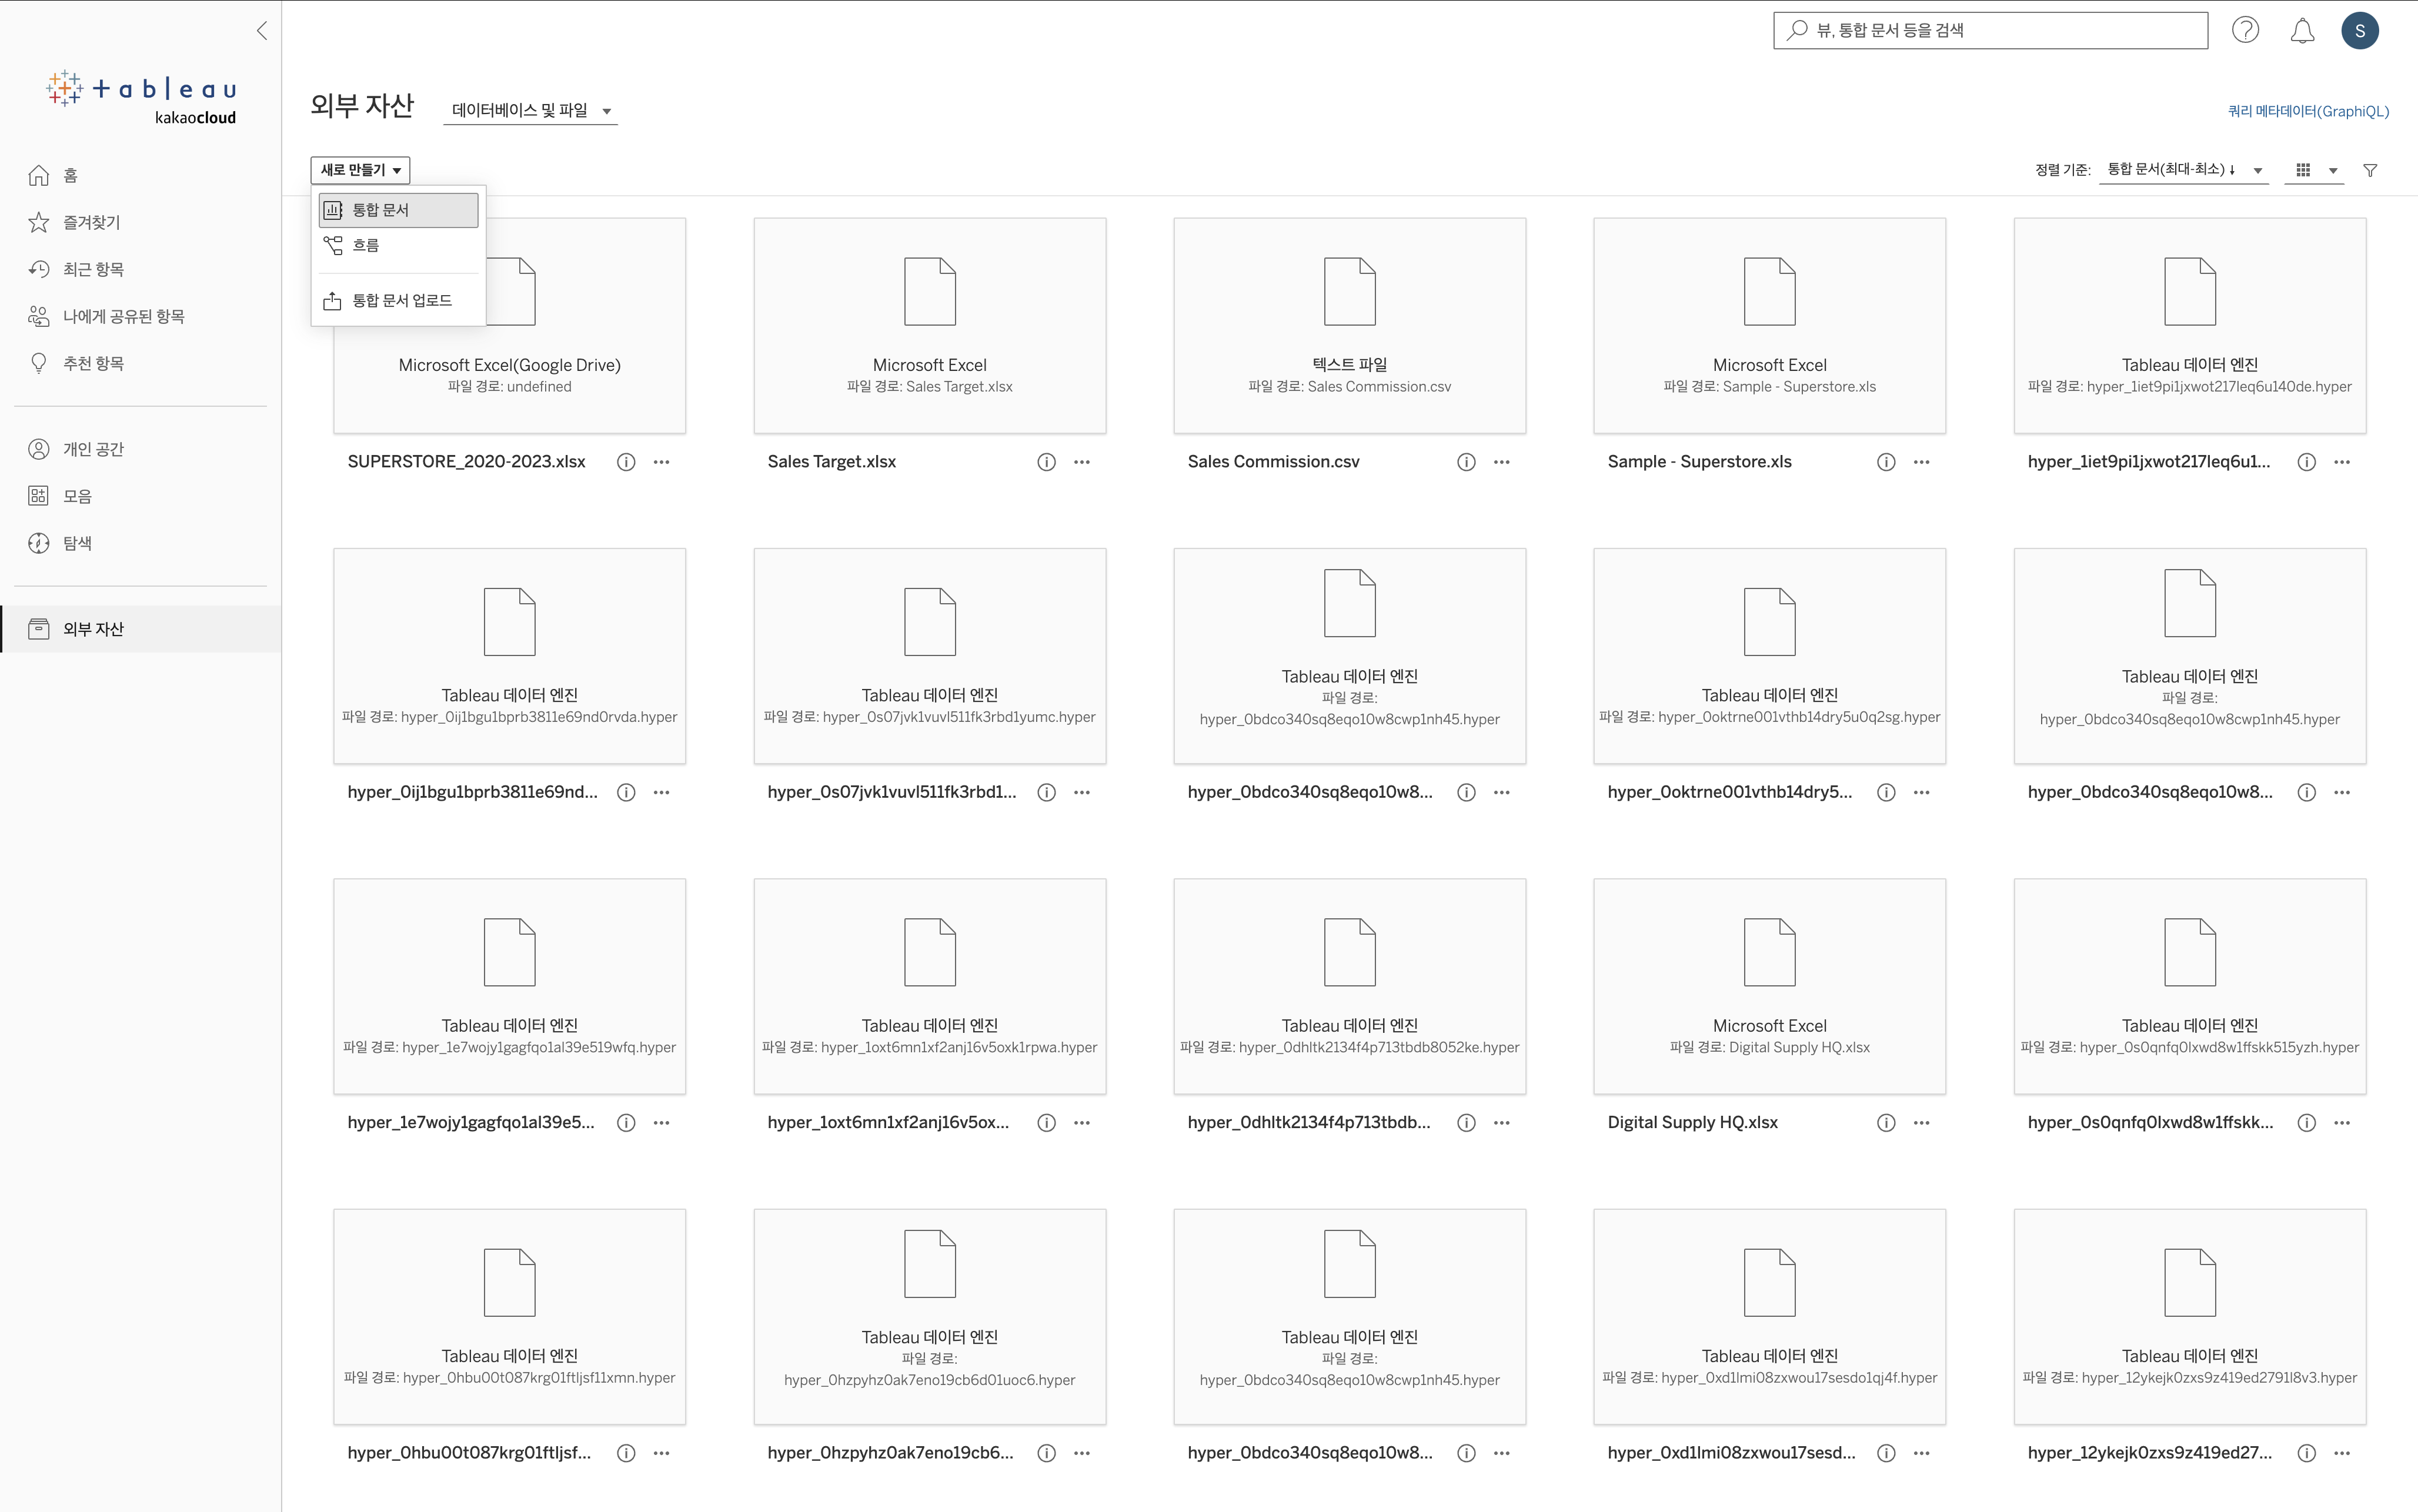
- If the data connection popup does not appear, refresh or retry the previous steps.
- Select the Connector tab.
- Select the adapter corresponding to the MySQL database you want to use.
Step 2. Connect to Database
-
Enter the KakaoCloud database settings according to the selected database engine:
Item Configuration/Input Value Server {Public IP of Bastion Host}Port 3306 Database tutorial-tableau Username admin Password root1234 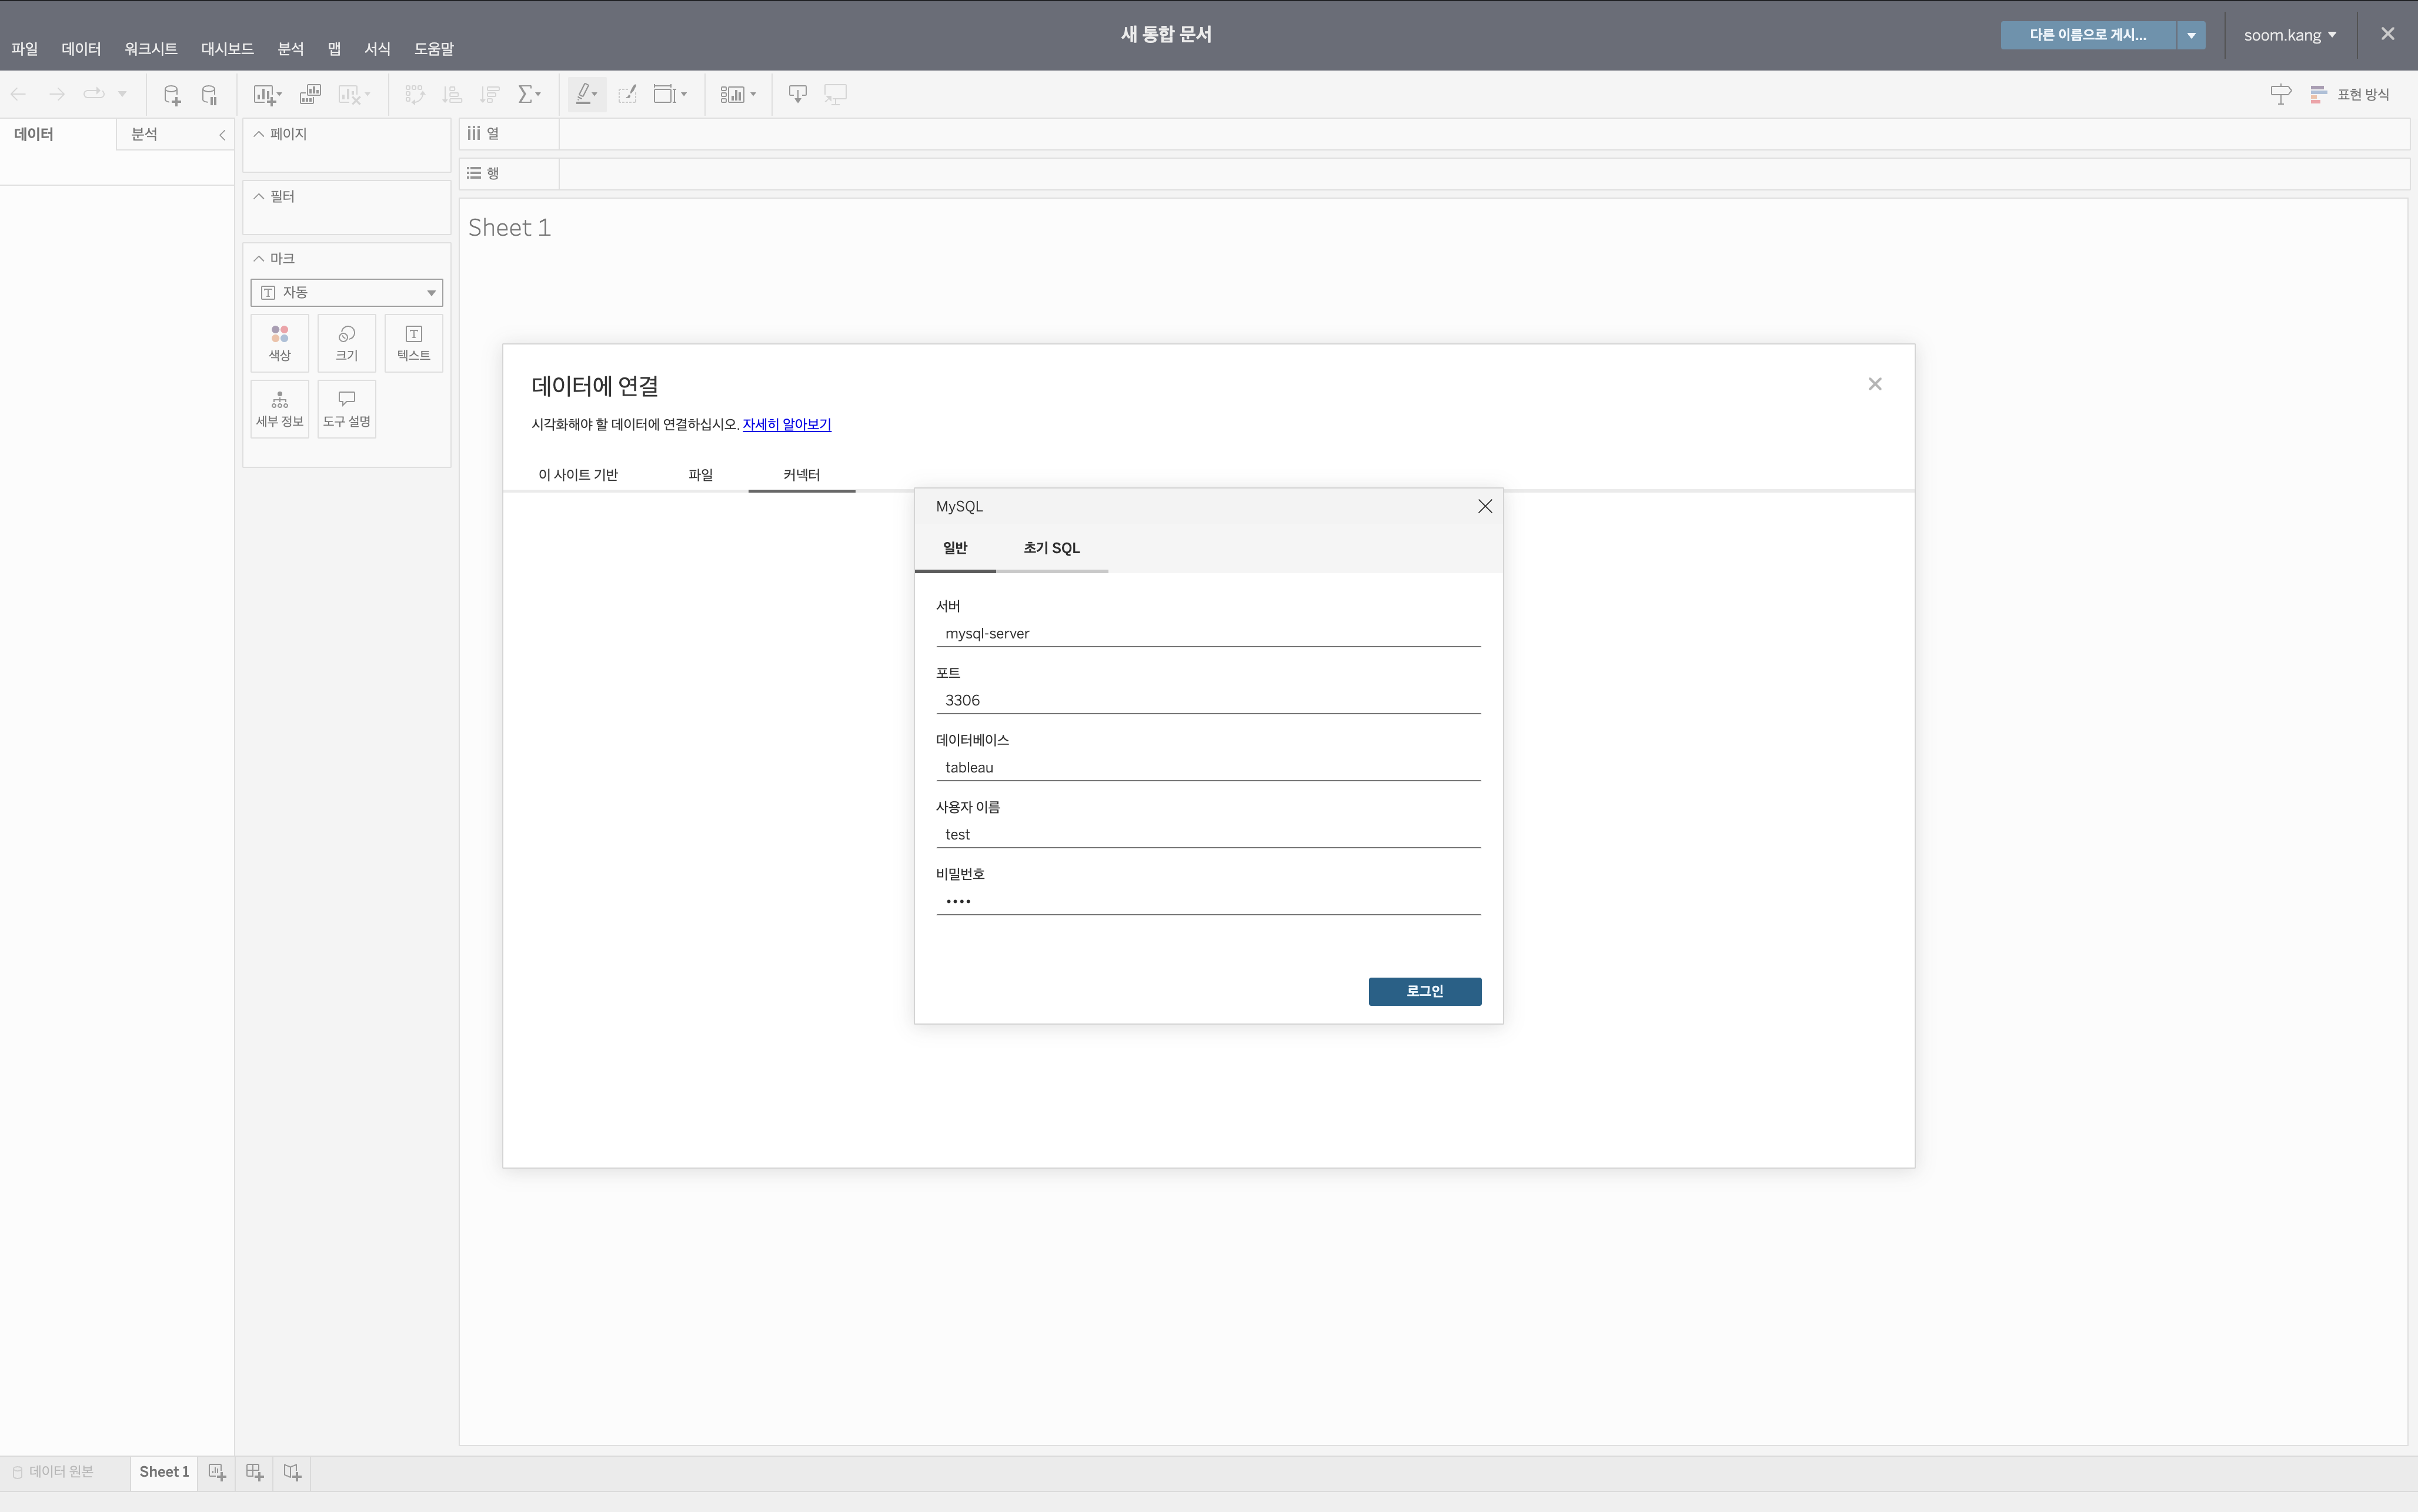
-
Select Login.
Step 3. Verify Tableau connection
- Check the connected database endpoint in the left panel.
- Ensure that the
tableaudatabase andtableau_connectiontable are displayed correctly.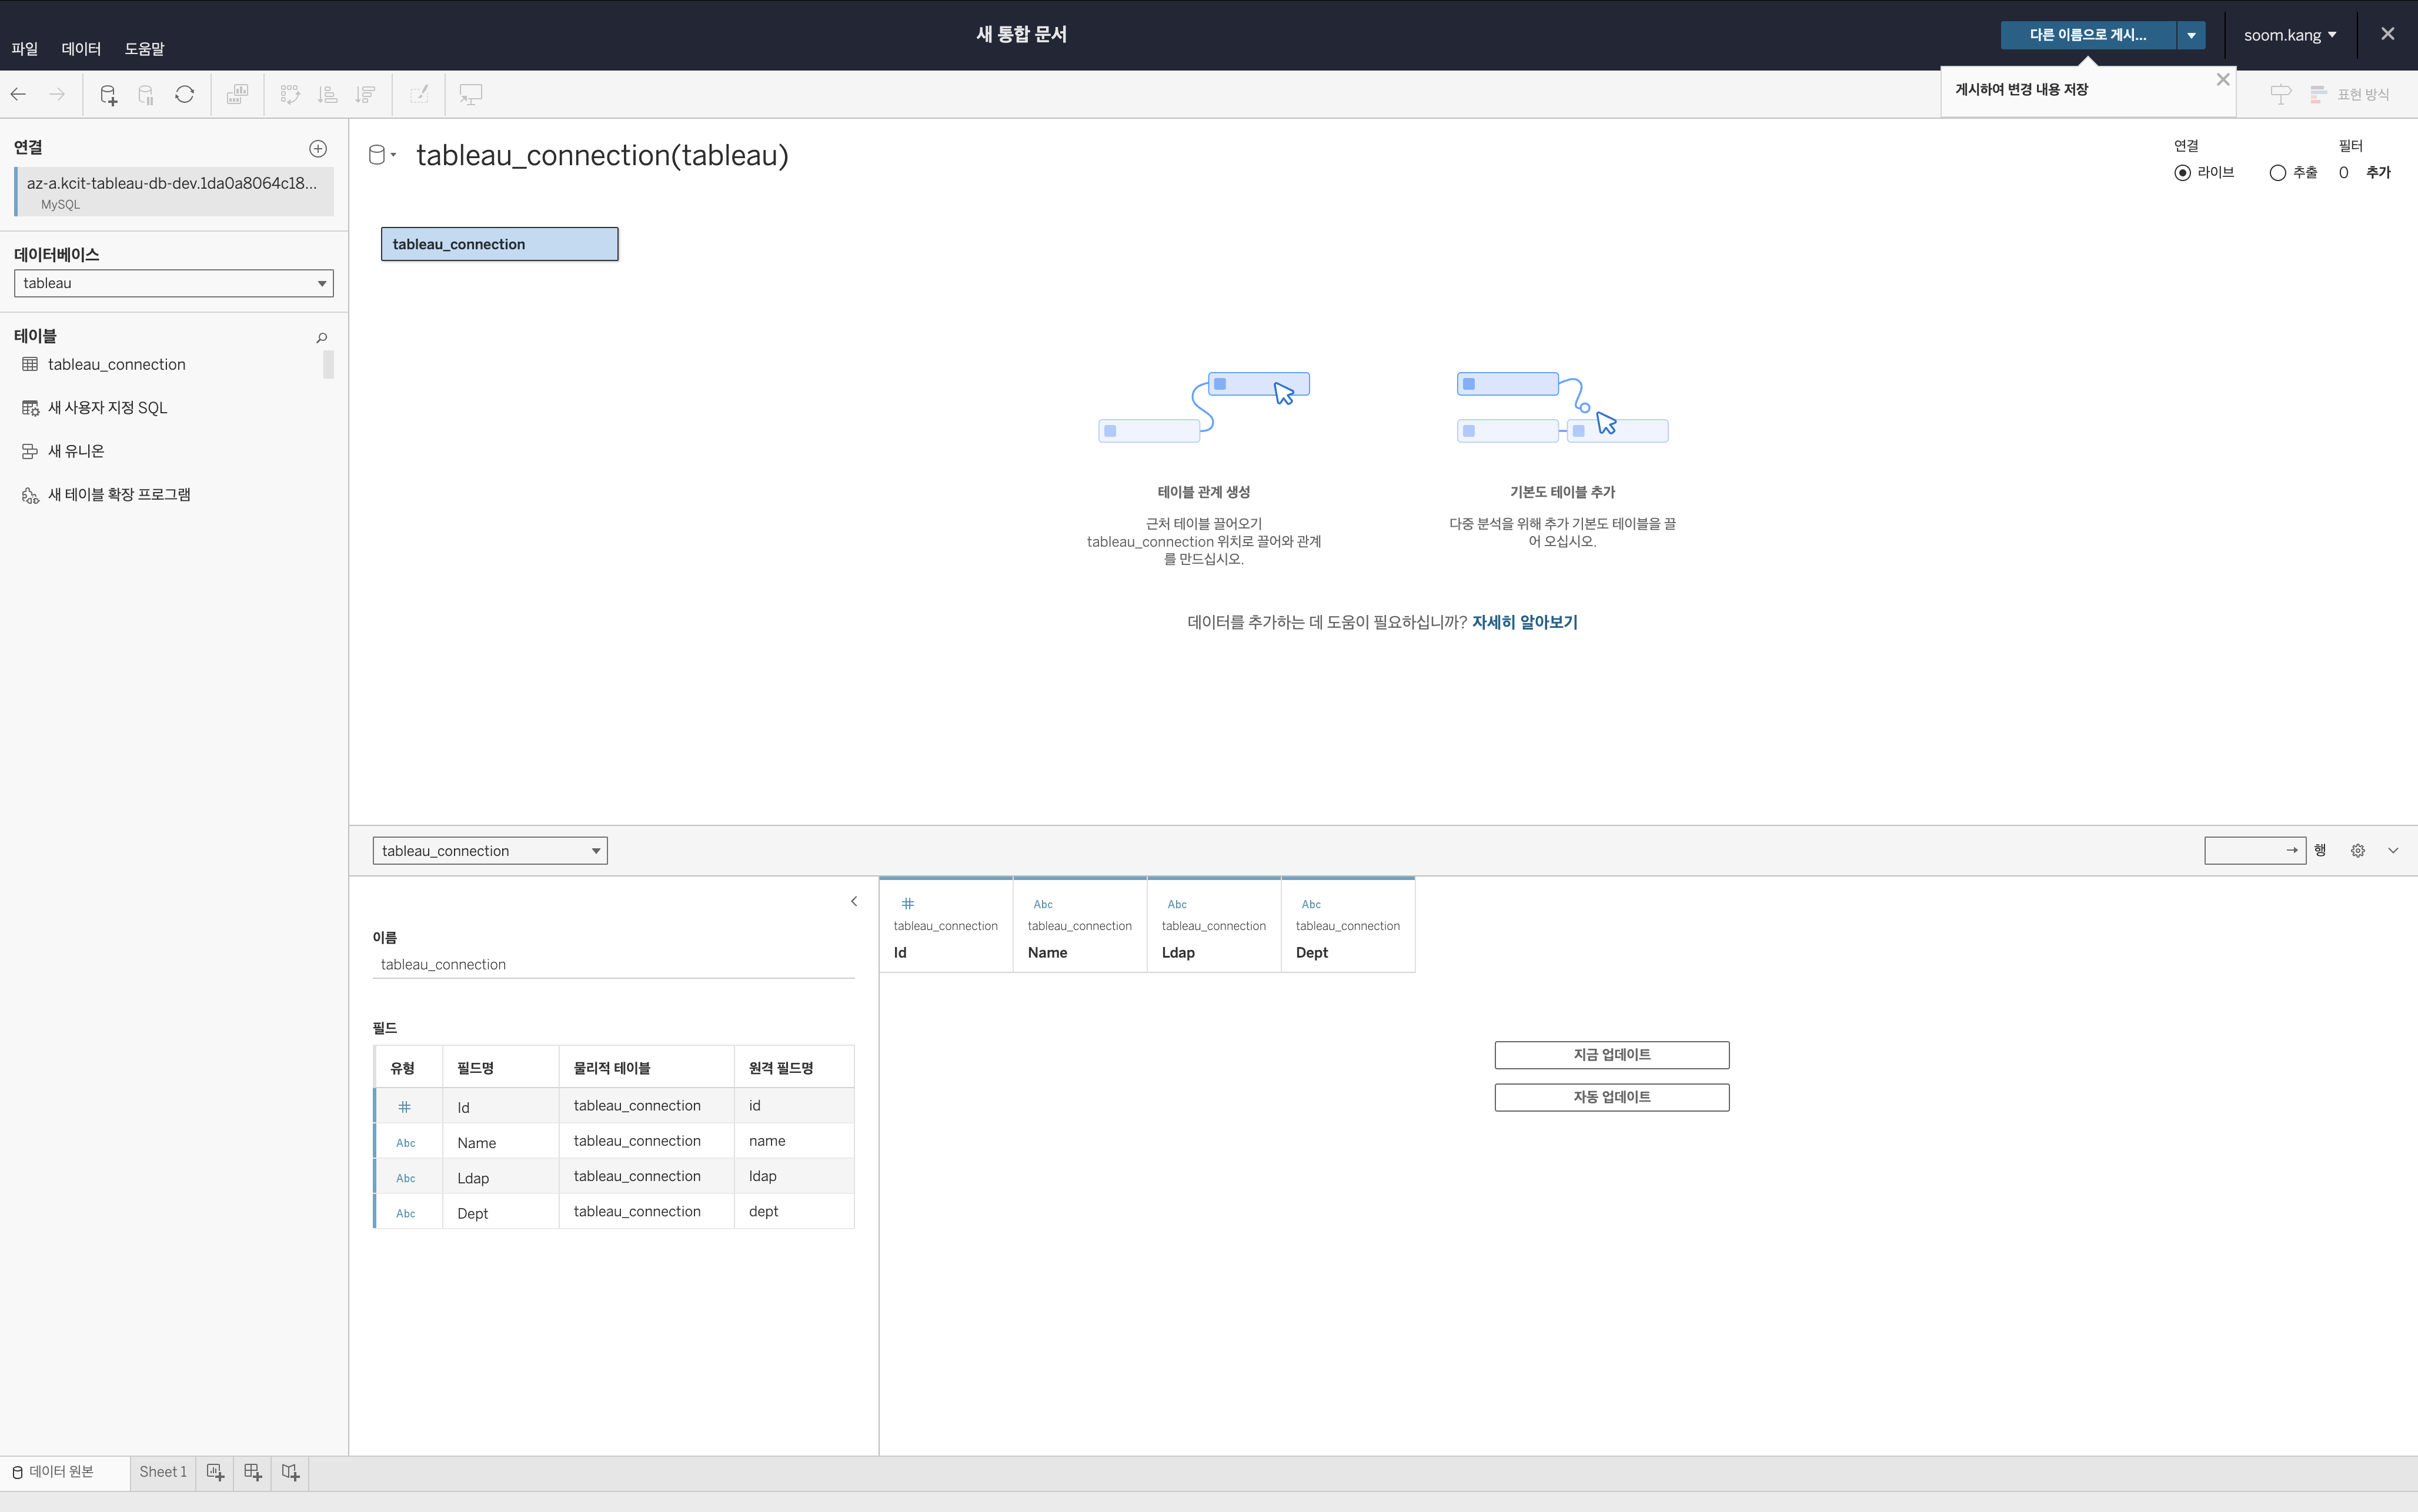
- Select the necessary tables and start data visualization.
Step 4. Prepare sample data
-
Download the sample data CSV file for Tableau.
-
Use a database management tool (e.g., DBeaver Community) to connect to the MySQL database based on the settings from Step 2.
Item Configuration/Input Value Server {Public IP of Bastion Host}Port 3306 Database tutorial-tableau Username admin Password root1234 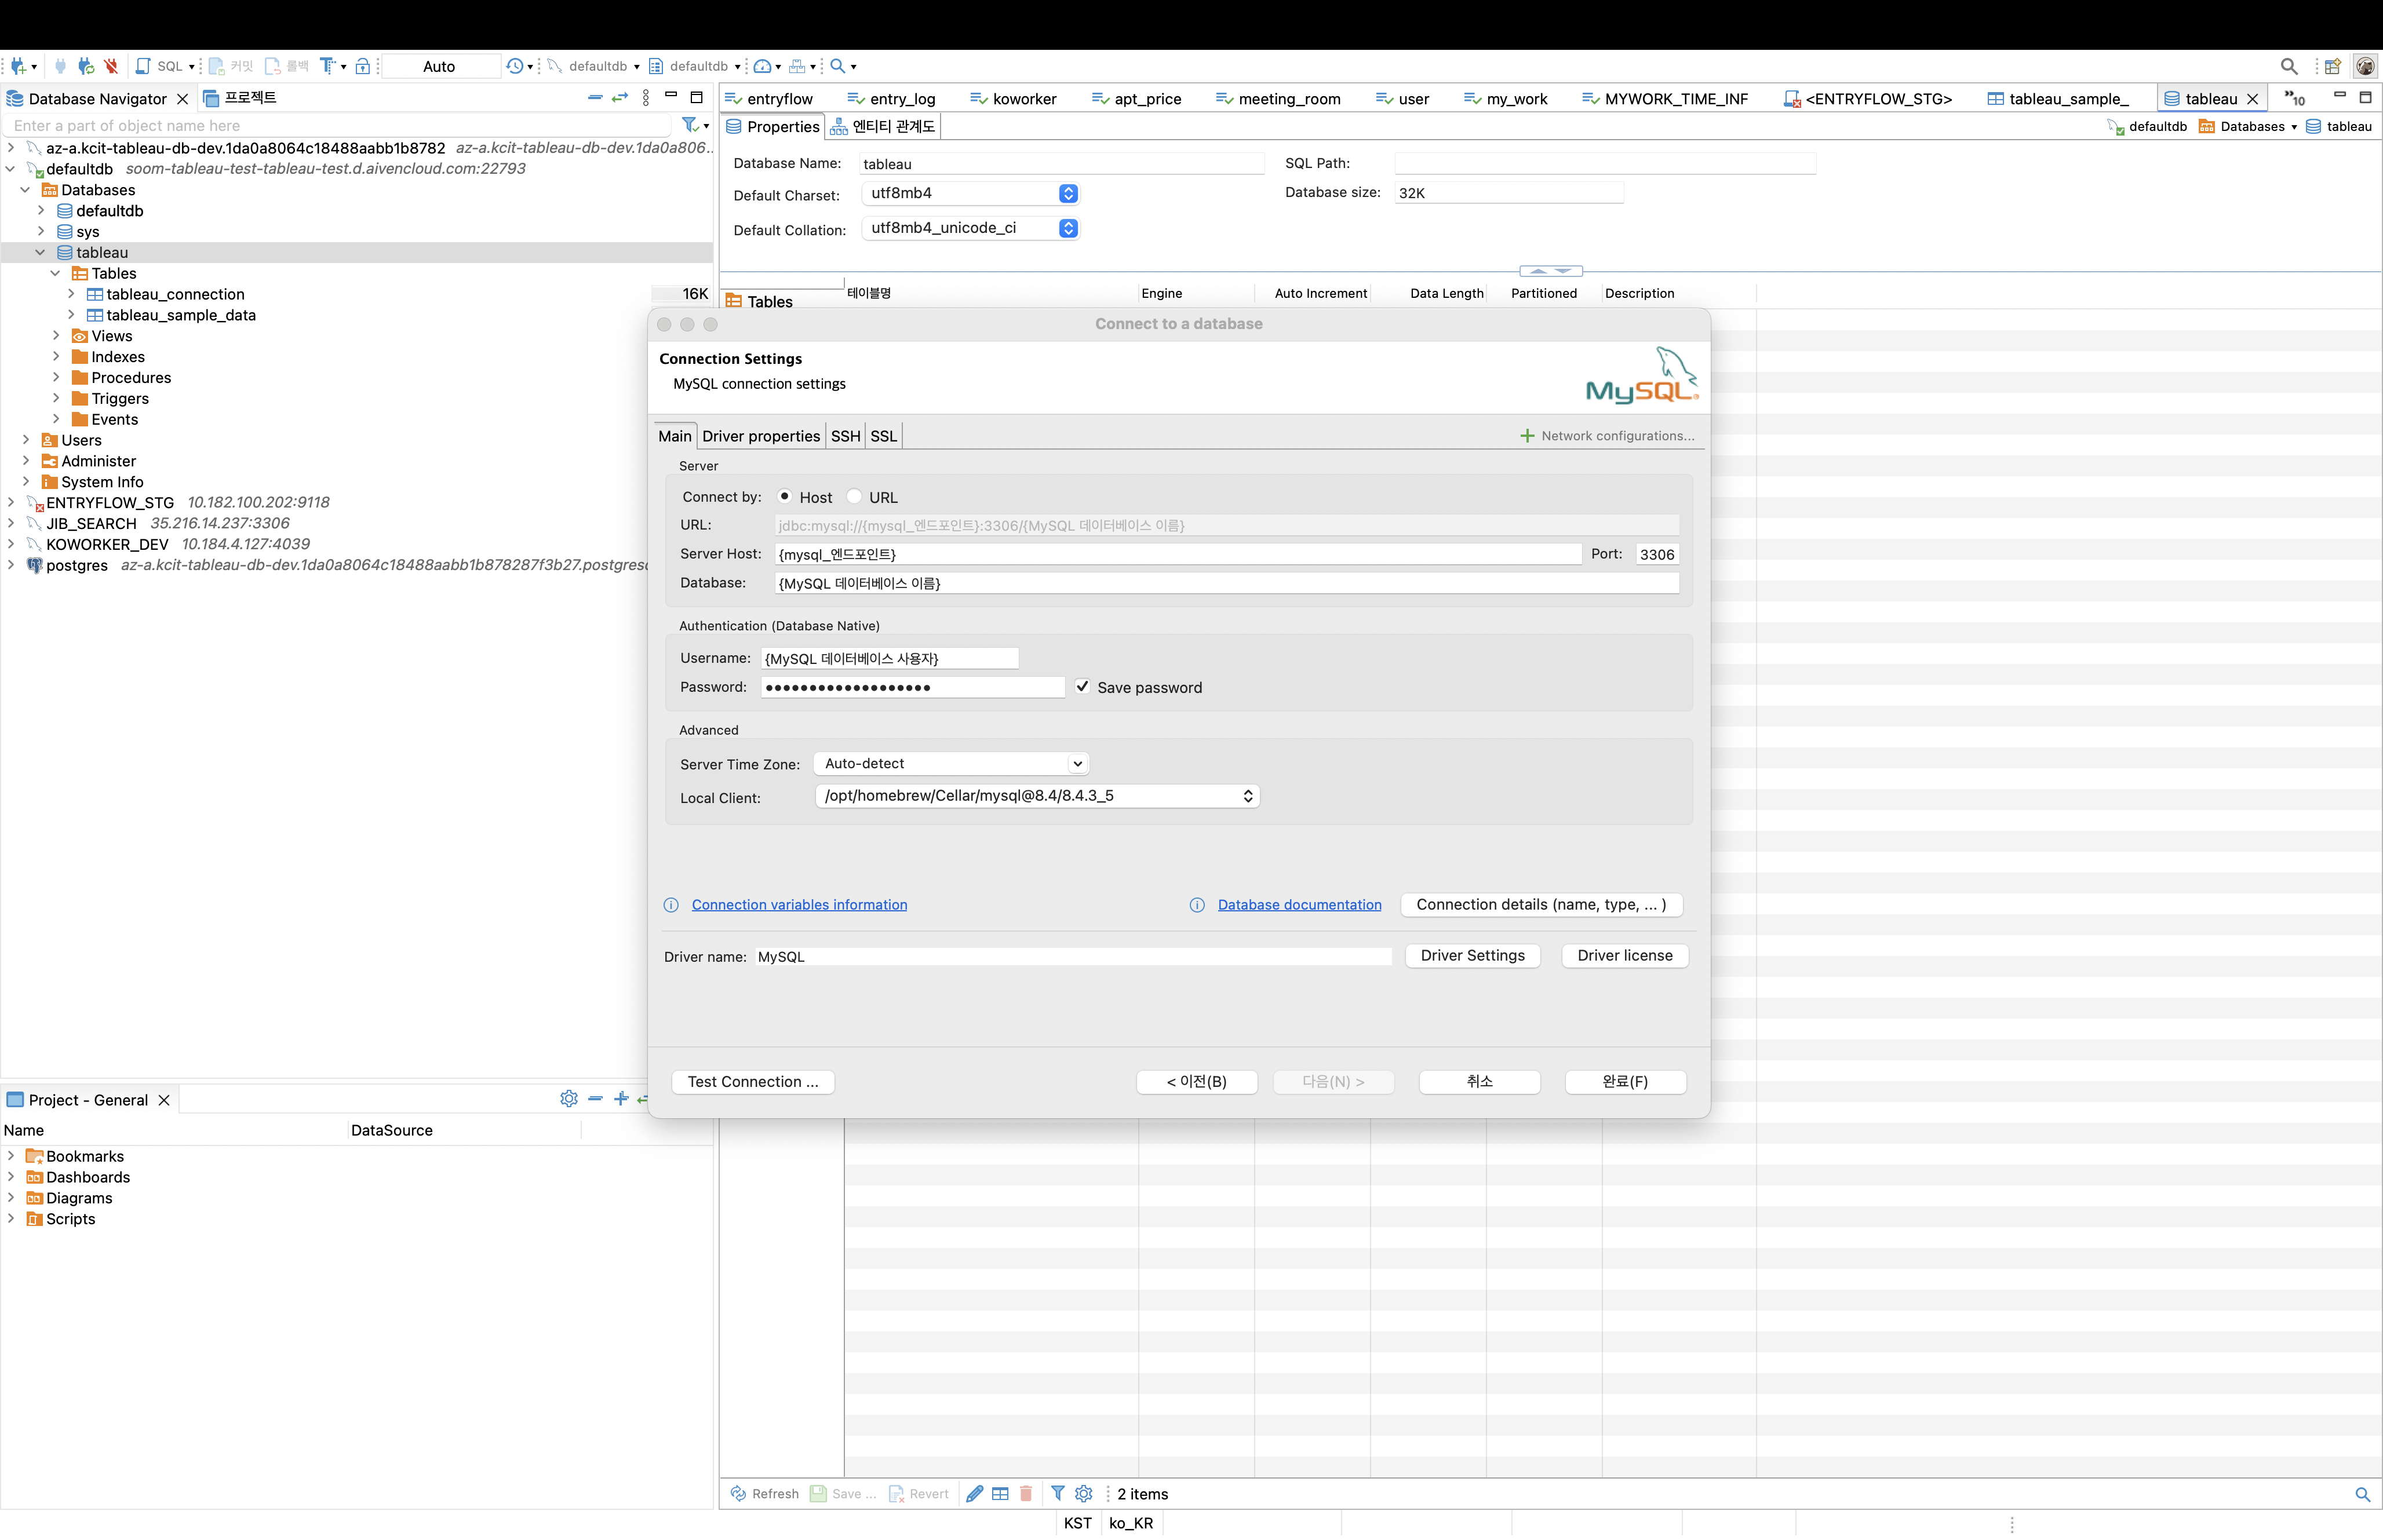
-
Verify the MySQL connection in the left panel and check if the
tableaudatabase exists. -
Open the SQL editor and create the
tableau_sample_datatable using the following query:CREATE TABLE tableau.tableau_sample_data (
`ID` INTEGER NOT NULL,
`Order ID` VARCHAR(50) NULL,
`Order Date` VARCHAR(50) NULL,
`Shipping Date` VARCHAR(50) NULL,
`Shipping Duration` INTEGER NULL,
`Shipping Method` VARCHAR(50) NULL,
CustomerID VARCHAR(50) NULL,
CustomerName VARCHAR(50) NULL,
`Customer Segment` VARCHAR(50) NULL,
Country VARCHAR(50) NULL,
Region VARCHAR(50) NULL,
State VARCHAR(50) NULL,
City VARCHAR(50) NULL,
`Product Code` VARCHAR(50) NULL,
`Product Category` VARCHAR(50) NULL,
`Product Subcategory` VARCHAR(50) NULL,
ProductName VARCHAR(64) NULL,
Sales REAL NULL,
Quantity INTEGER NULL,
Profit REAL NULL,
Discount REAL NULL,
PRIMARY KEY (`ID`)
)
ENGINE=InnoDB
DEFAULT CHARSET=utf8mb4
COLLATE=utf8mb4_unicode_ci; -
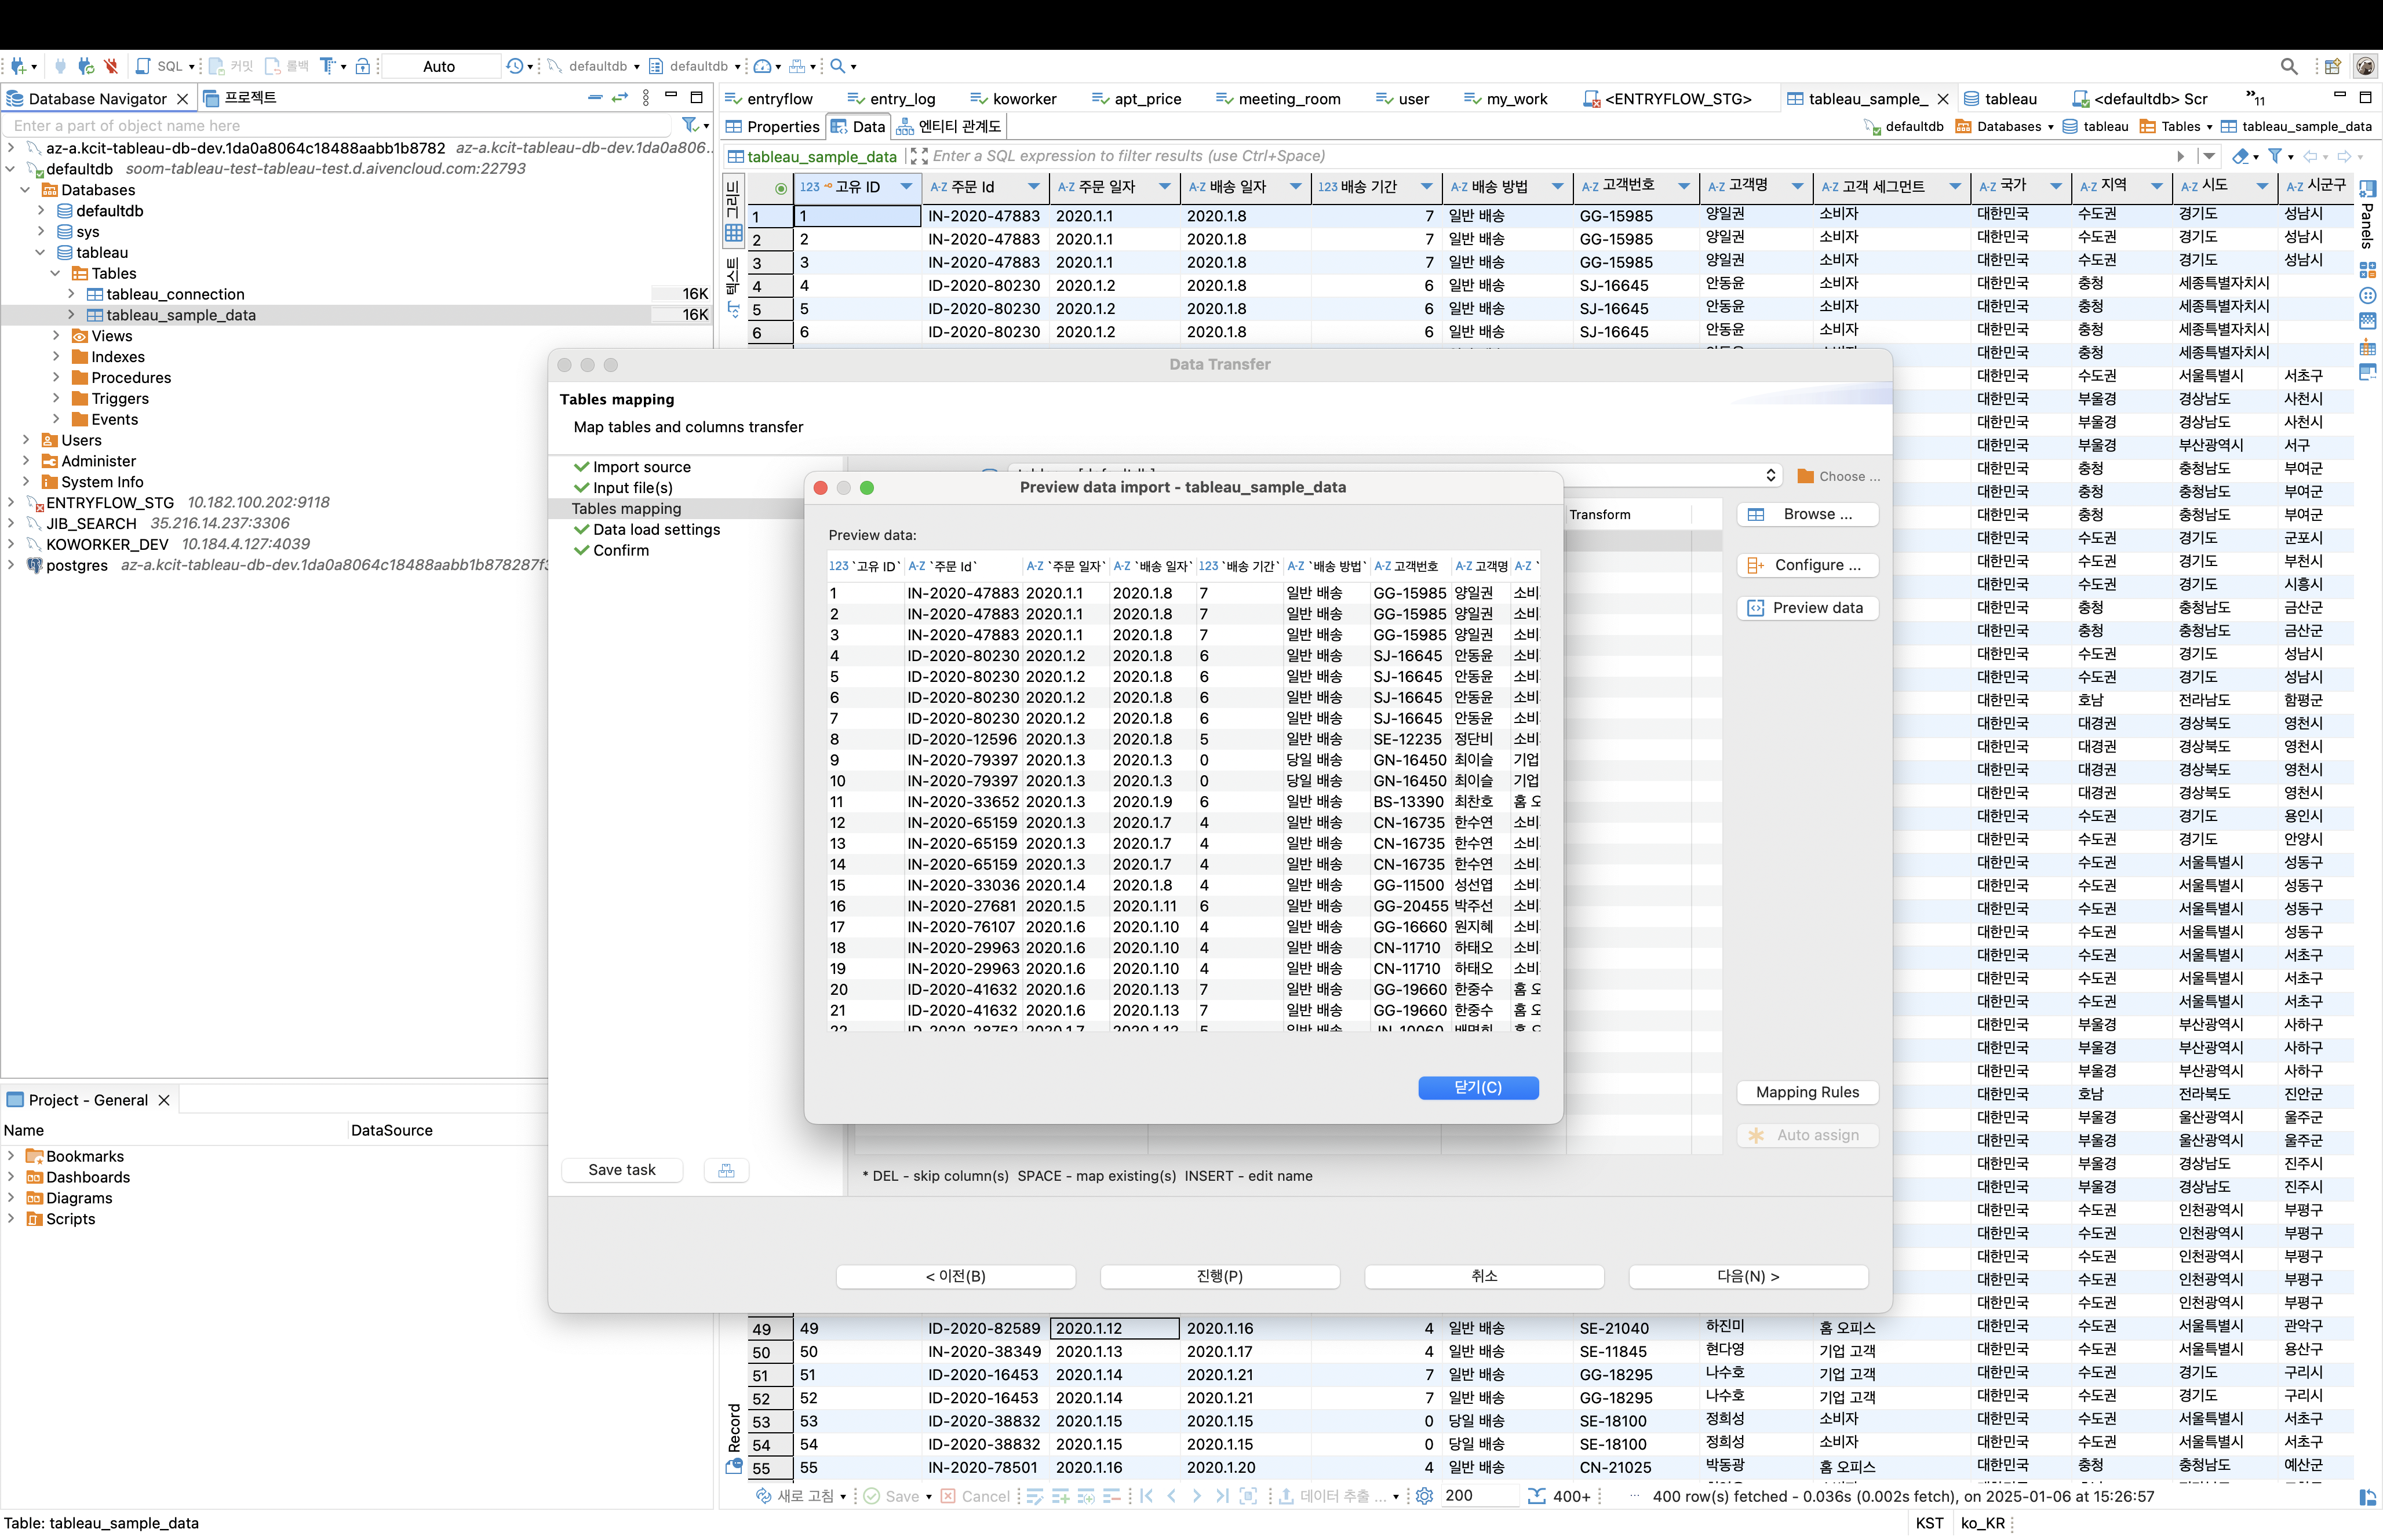
Right-select on
tableau_sample_dataand select Import Data. Follow the configuration steps in the table below. Leave any unspecified fields at their default values.Category Field Setting/Input Value Import Source CSV Import from CSV Input file(s) Source {CSV file saved in Step 1}Target tableau.tableau_sample_data Table mapping Source tableau_sample_data.csv Target tableau_sample_data -
In the [Table mapping] step, use the [Preview Data] menu to check if the data has been imported correctly. Select Proceed to execute the data import. Verify that the data has been imported successfully.
-
Return to the Tableau screen, select Update at the top left, and select the
tableau_sample_datatable to check if the data has been updated correctly. Dragtableau_sample_datafrom the left table window to the main window in the center. If successful, the screen should appear as follows. Select Update Now in the table window to verify the data.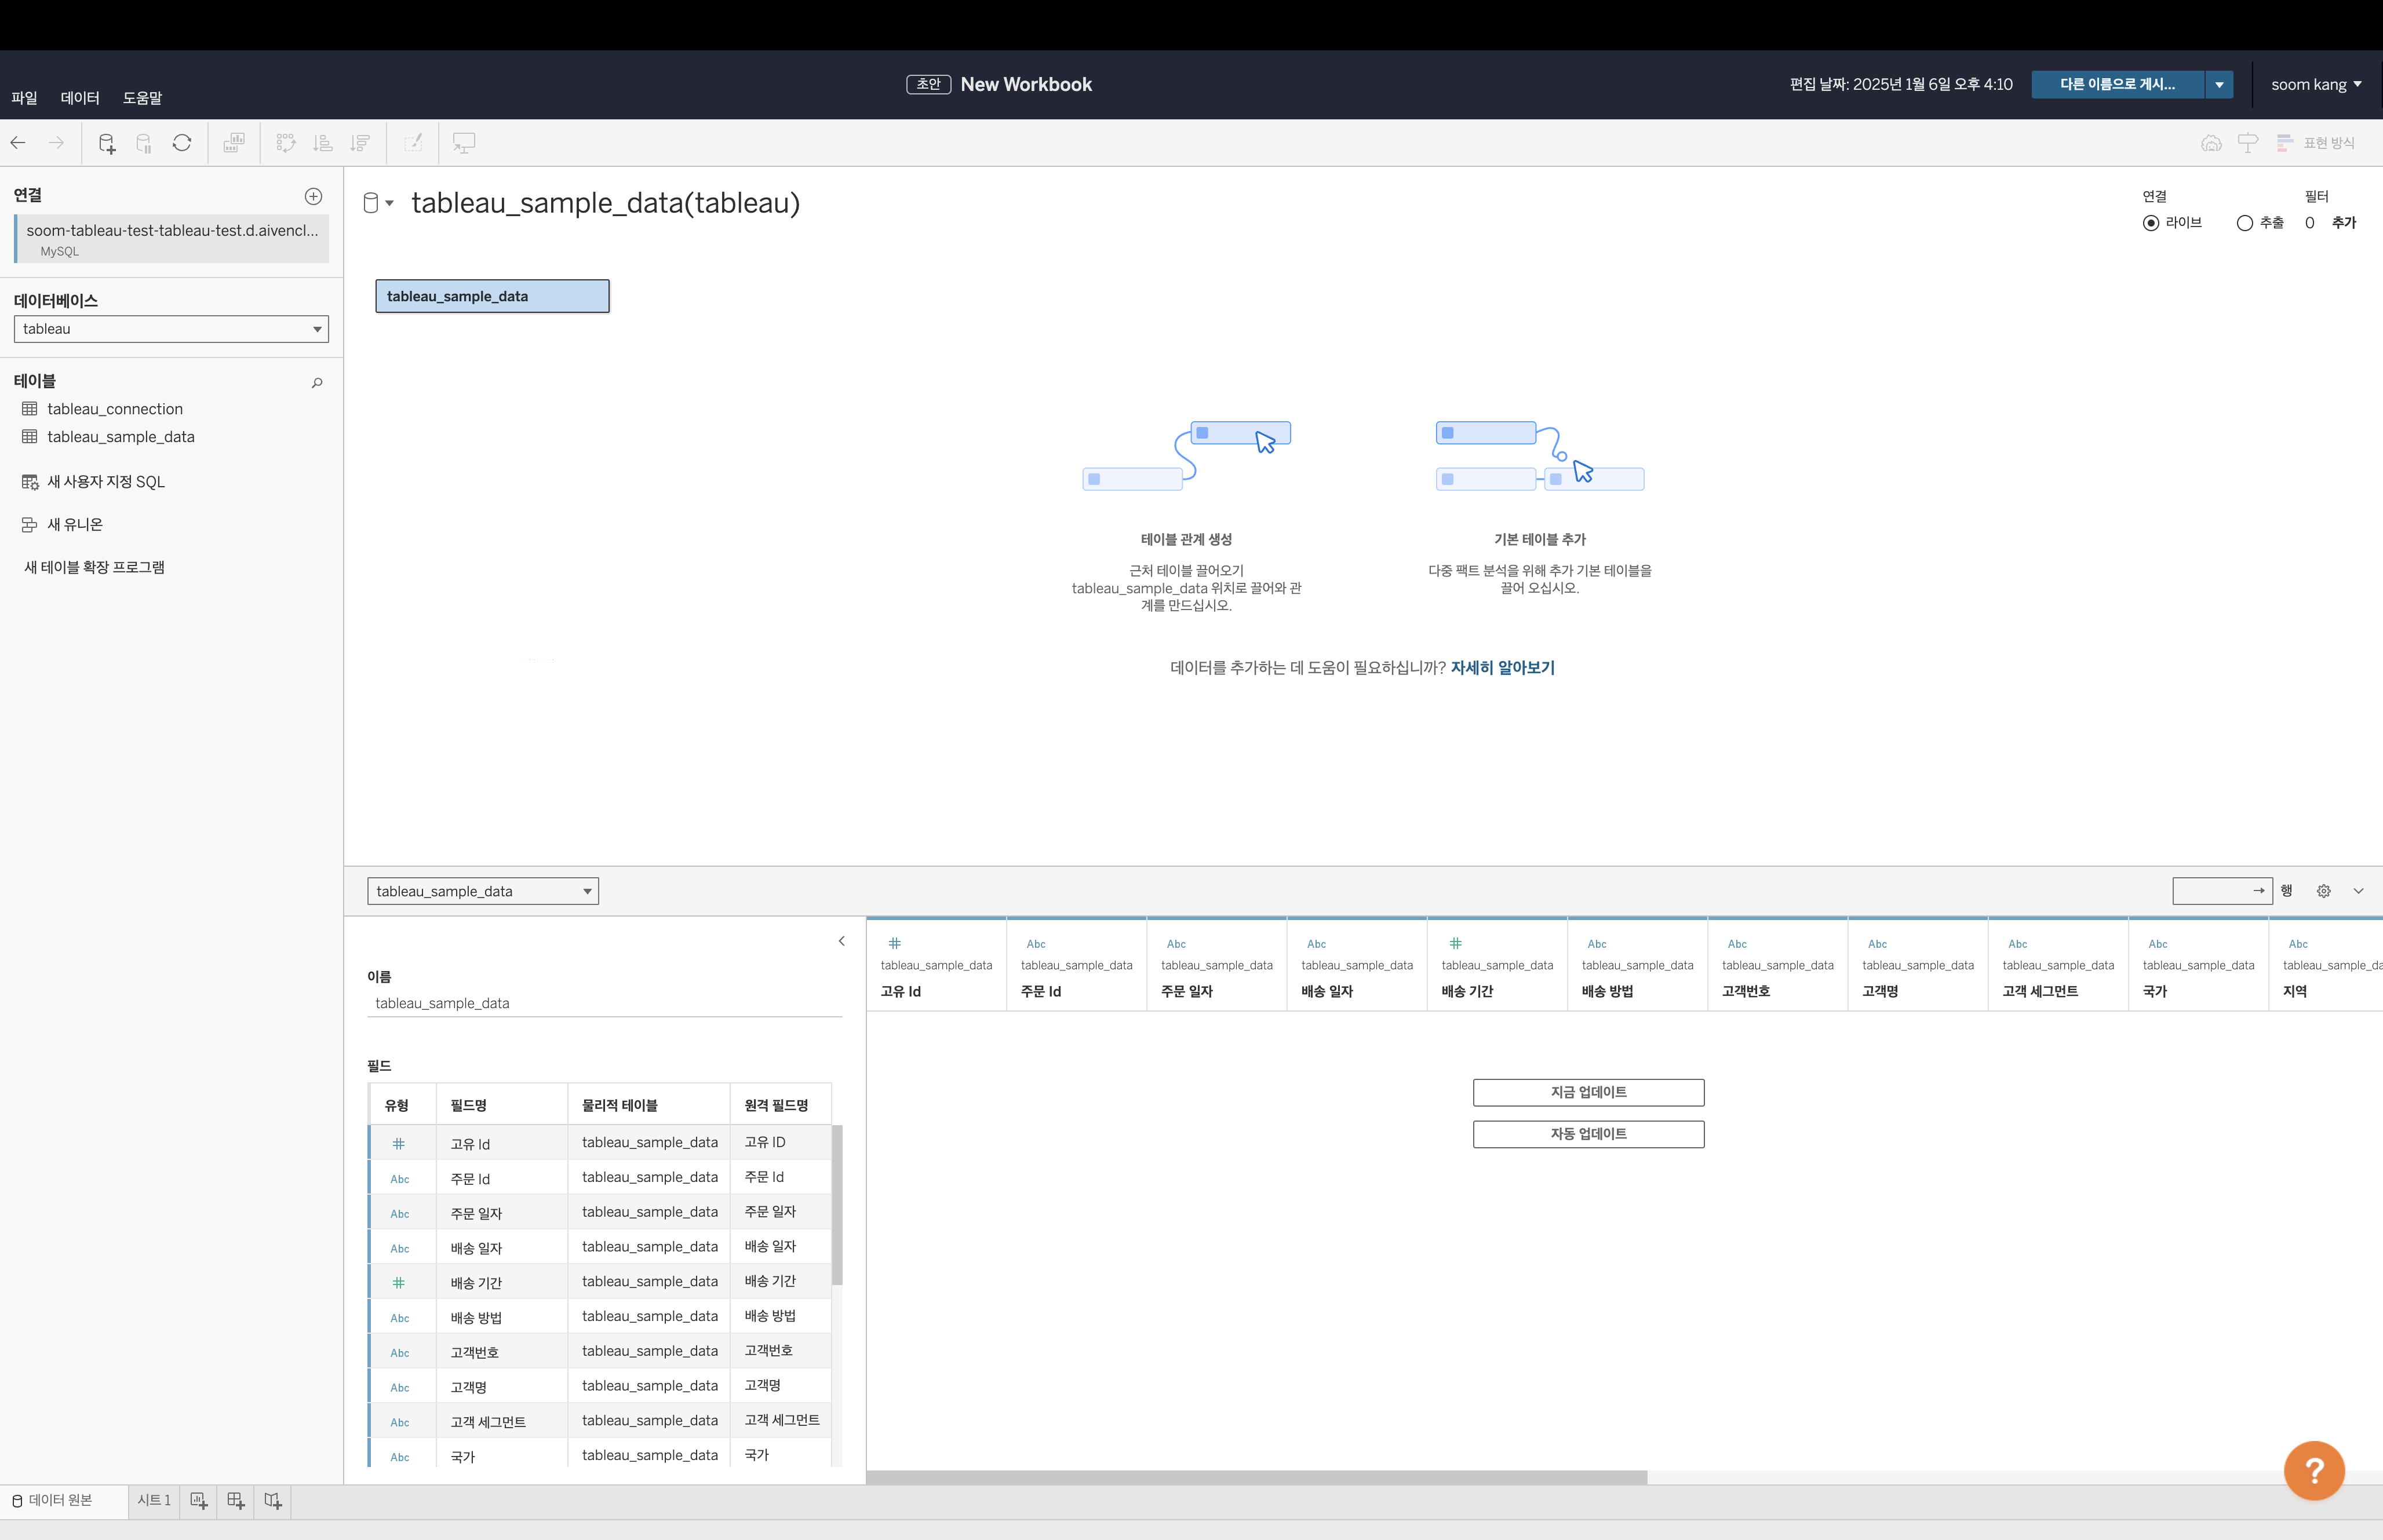
Step 5. Data visualization using Tableau
-
Select Sheet 1 from the tabs below to switch to the chart creation worksheet. You can view the data columns and entries in the left window.
-
Now, let's create a chart. Drag
Customer Namefrom the left panel to the Columns input field in the center. Similarly, dragSUM(Sales)to the Rows field. A bar chart representing sales per customer is automatically generated. If it does not generate automatically, select Bar from the dropdown in the Marks section.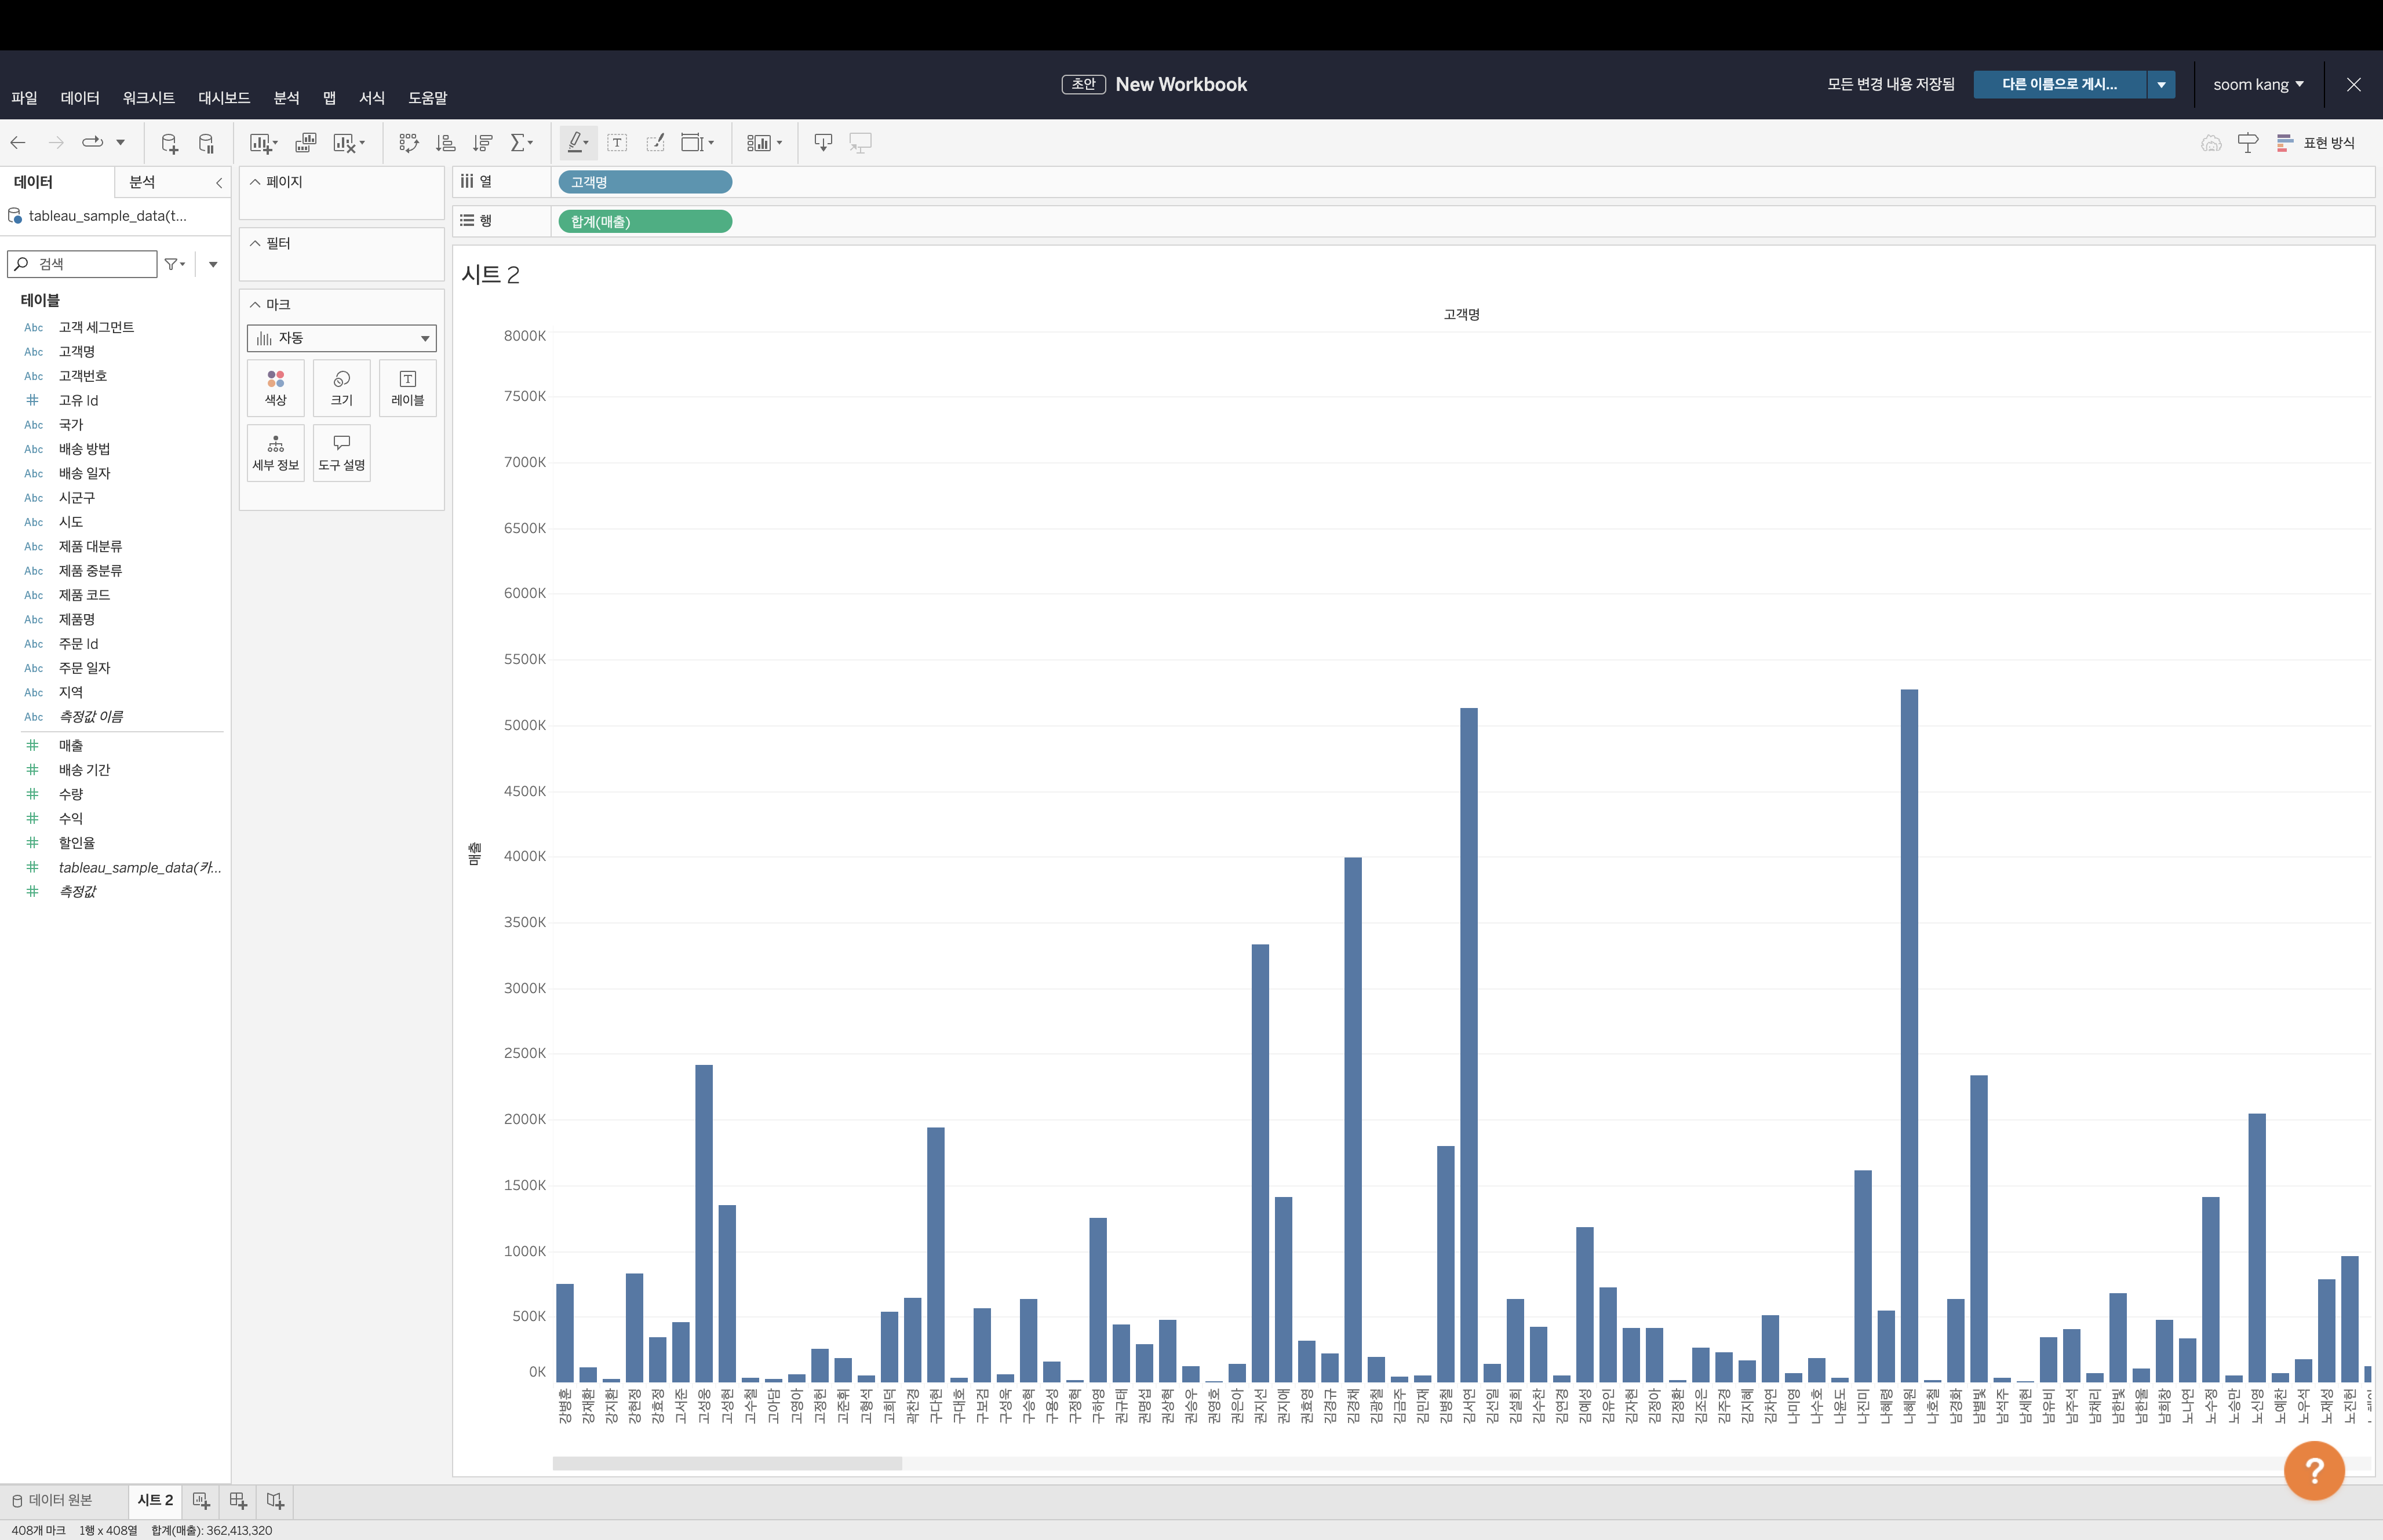
-
Next, let's add relevant data. Drag
SUM(Quantity)from the left panel to Label in the Marks menu. The quantity will now be displayed at the top of each bar. -
Now, drag
SUM(Discount)to the Color field. Select Edit Colors in the Marks menu and select Temperature Diverging from the dropdown. A legend will appear at the top right, and colors will change according to discount values.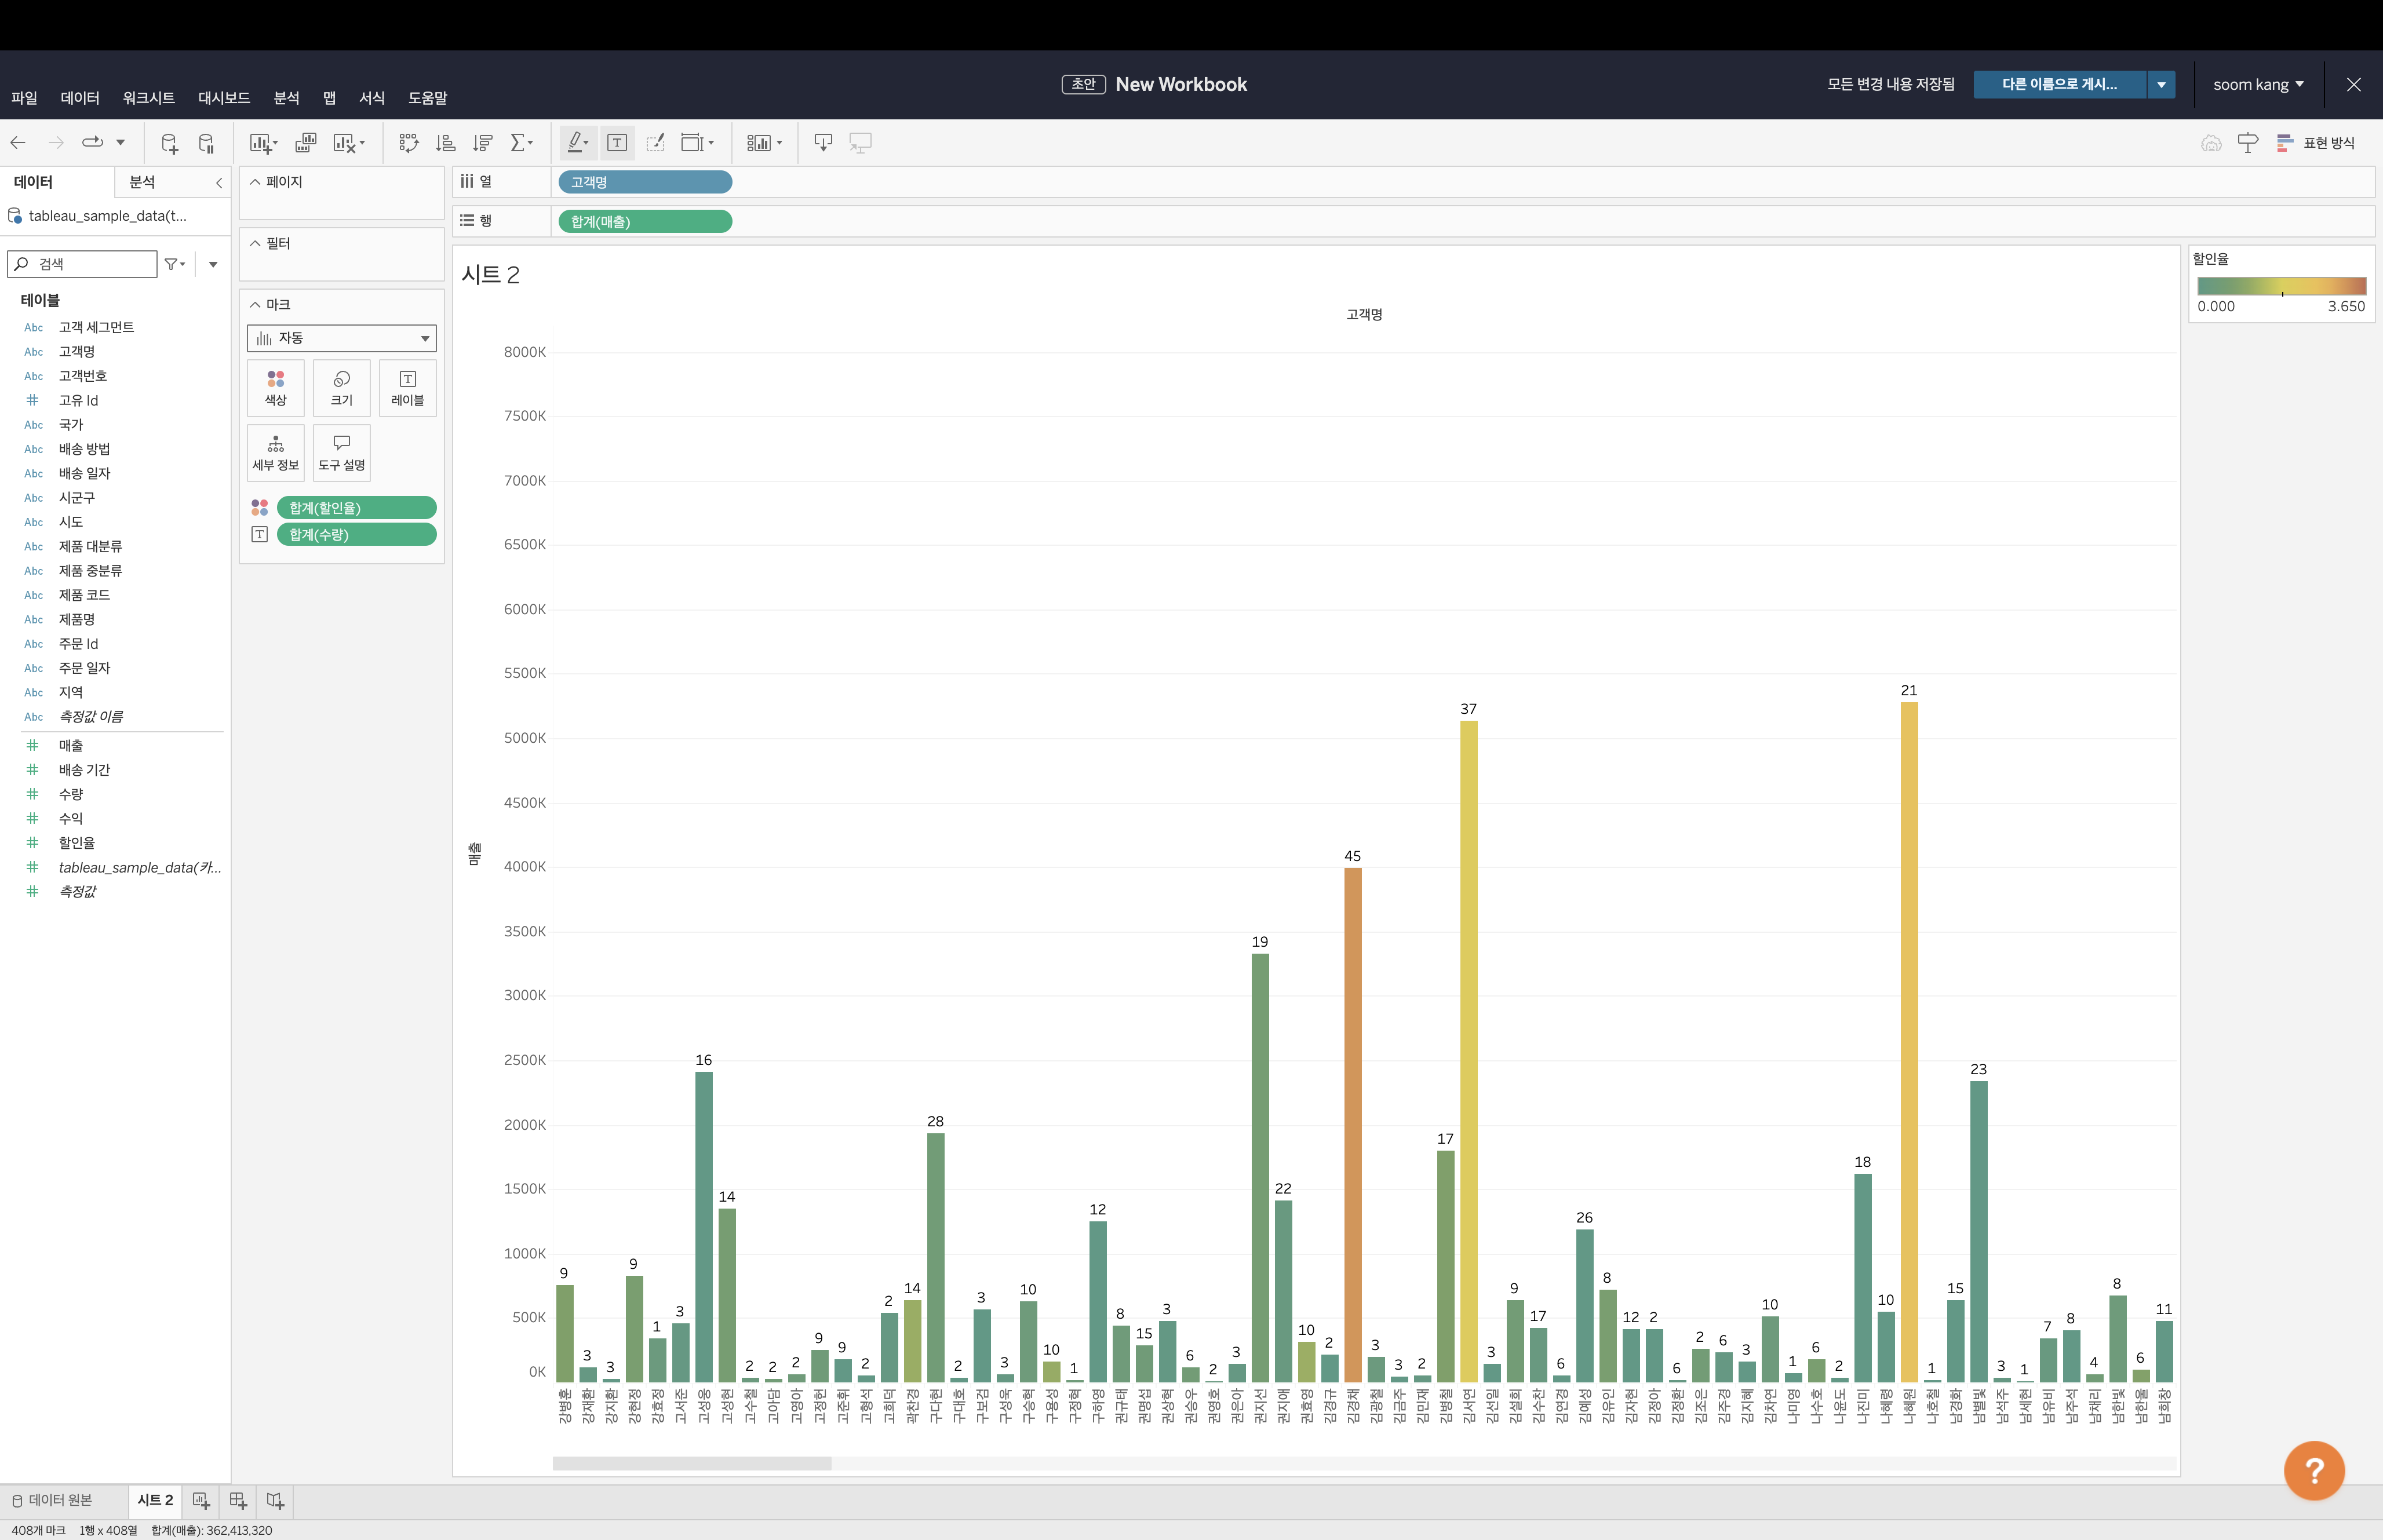
-
Finally, change the chart type by selecting Line instead of Bar in the Marks dropdown. The graph will now be displayed as a line chart.
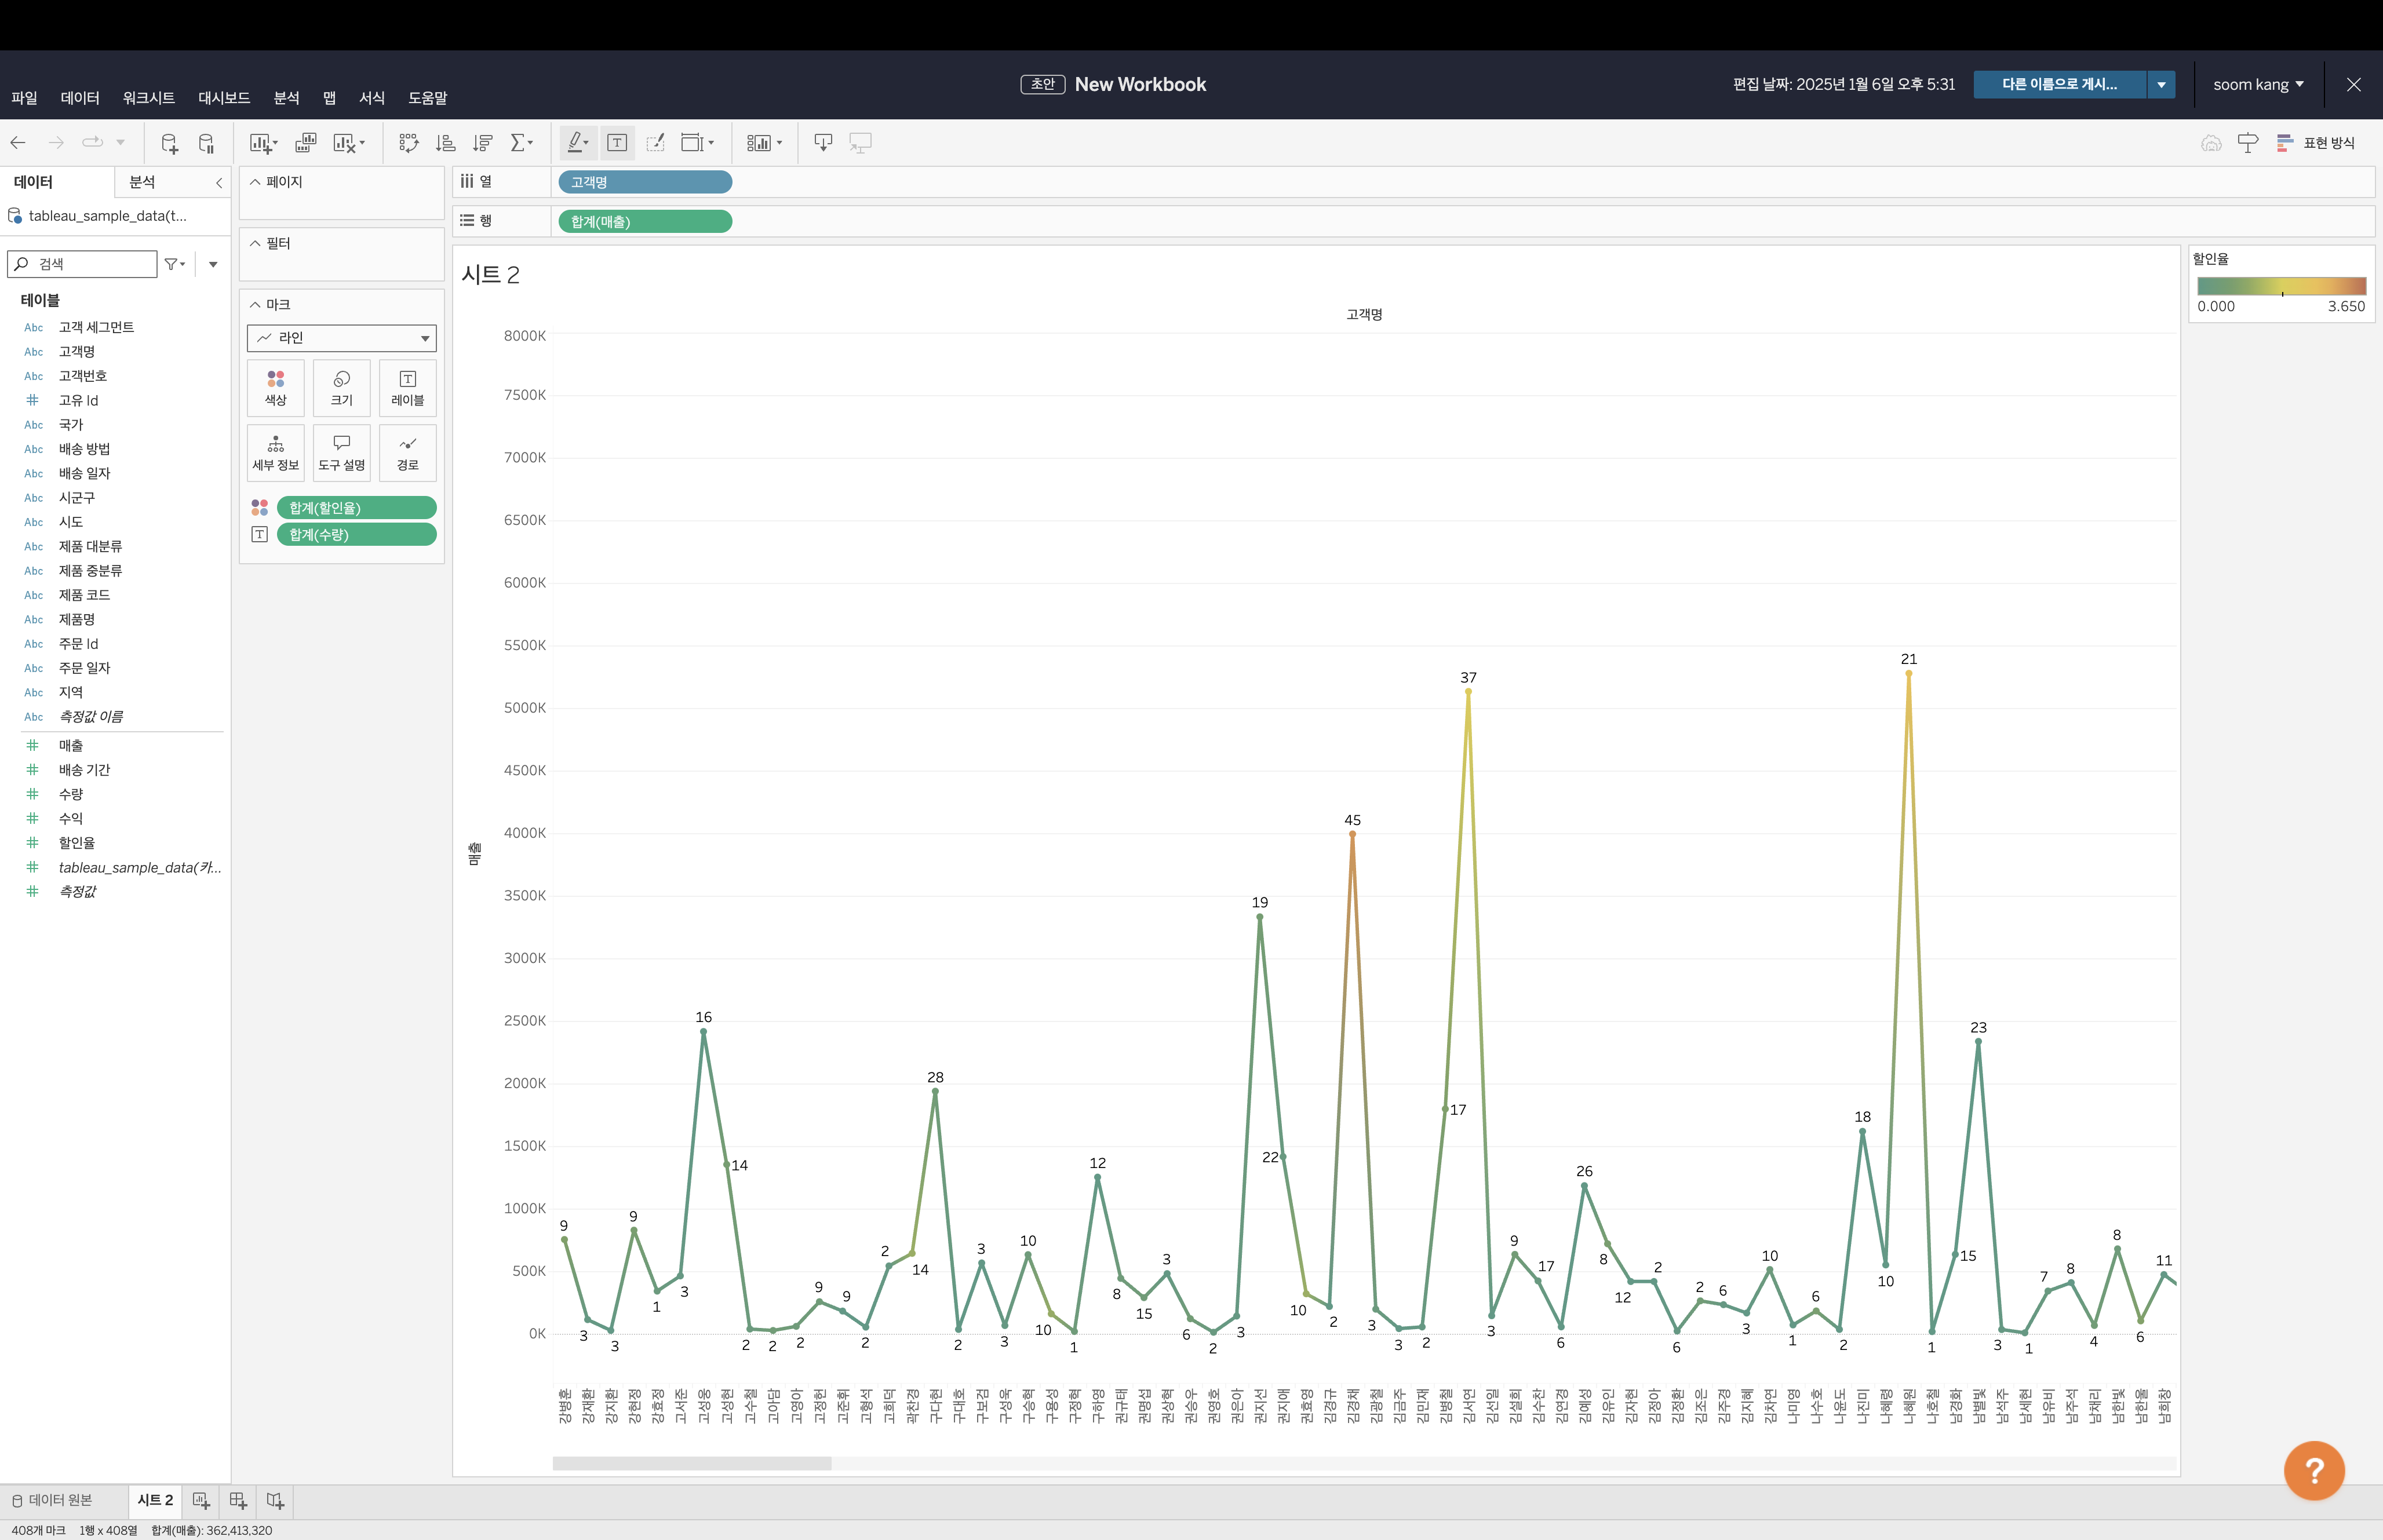
Utilize this tutorial to integrate KakaoCloud with Tableau for various data visualizations.