Grafana dashboard templates in KakaoCloud
This guide explains how to easily configure monitoring dashboards using Grafana dashboard templates provided by KakaoCloud. KakaoCloud offers four Grafana templates for Beyond Compute Service, Load Balancing, MySQL, and MemStore services.
- Estimated time: 20 minutes
- Prerequisites
Before you start
Grafana installation is required to proceed with this tutorial. You can either build it manually or use a Docker image. For detailed installation instructions, refer to the official Grafana guide.
This scenario is based on Grafana v10.4.2.
Use the following initial login credentials to access Grafana:
| Key | Value |
|---|---|
| Email or username | admin |
| Password | admin |
When logging into Grafana for the first time, you must change the default password for security reasons.
Getting started
Step 1. Create Prometheus data source
To use KakaoCloud's Grafana dashboard templates, create the necessary data sources. Four data sources must be configured to collect metrics for each service type.
-
In Grafana, navigate to Connections > Data sources from the left menu.
-
Select [Add data source] to create a new data source.
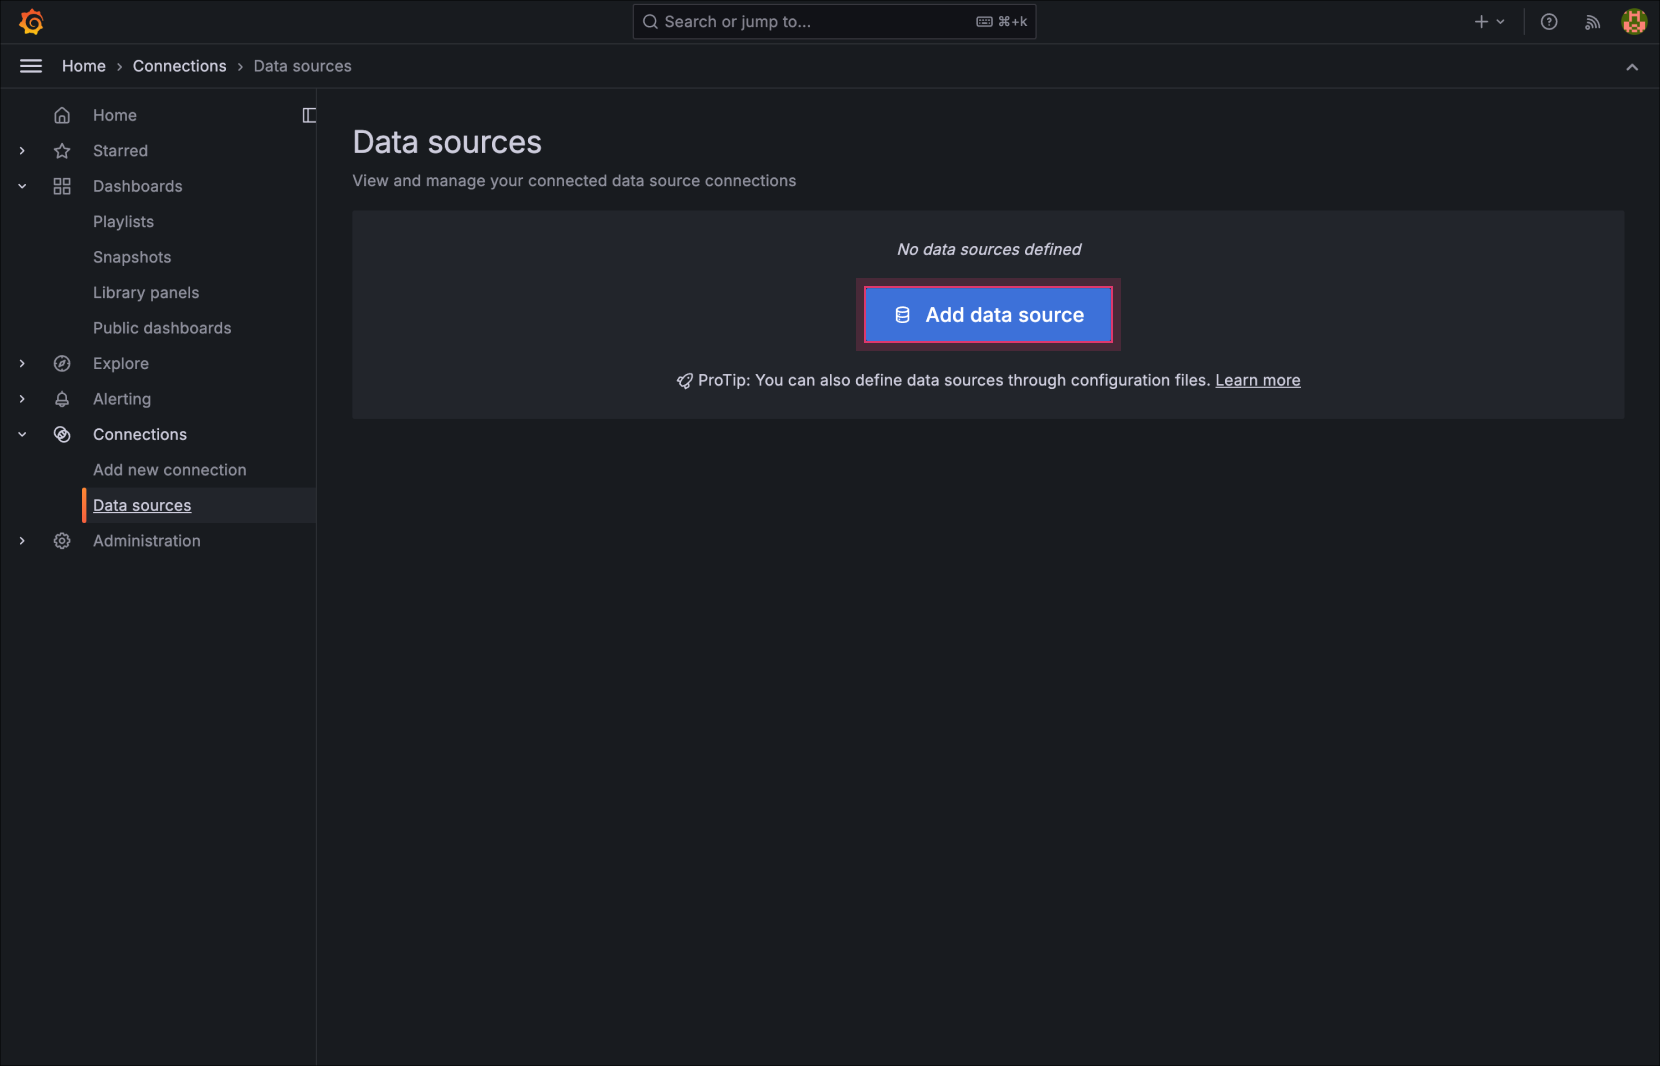
Add data source -
Select Prometheus as the data source type.
-
Enter a name for the data source.
Example: Name the data source for BCS metrics asBCS. -
In the Prometheus server URL field, enter the Metric Export endpoint.
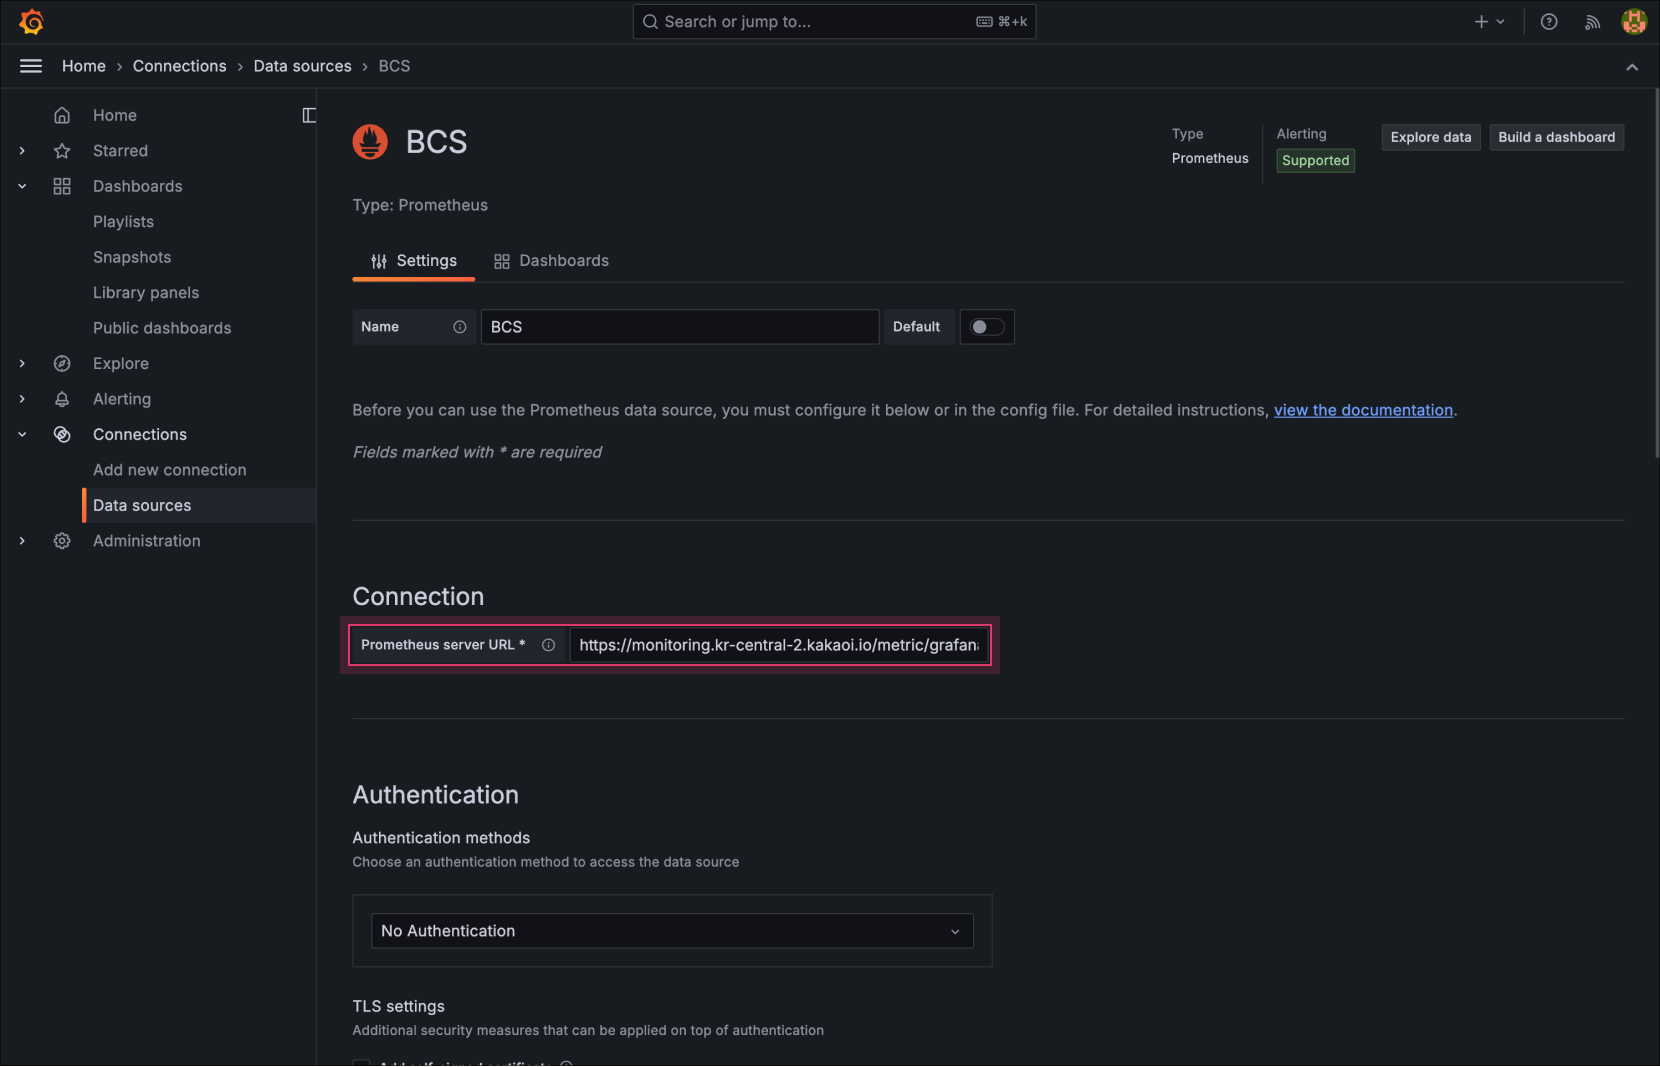
Enter Metric Export endpointKey Value Prometheus server URL https://monitoring.kr-central-2.kakaocloud.com/metric-export/grafana/{project_id}/prometheus- Replace
{project_id}with your project ID. Refer to the Check project ID guide for details.
- Replace
-
Under Authentication > HTTP headers, select [Add header] and enter the following details:
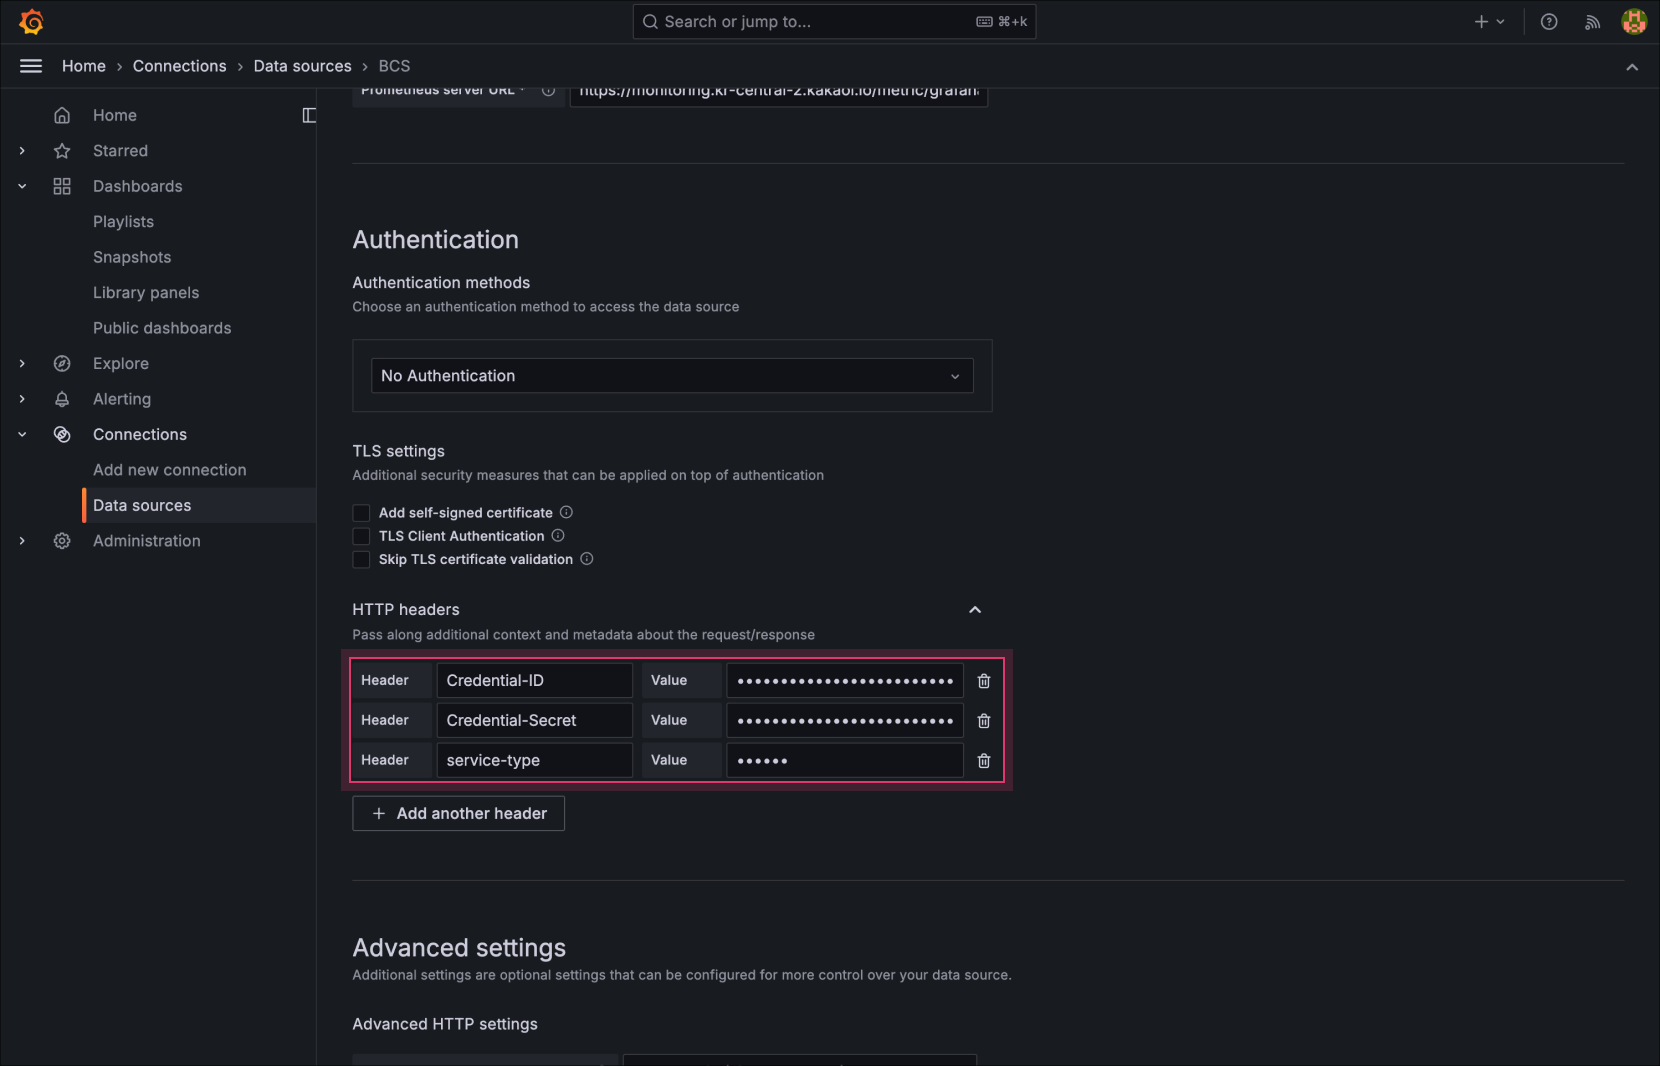
Enter HTTP headersKey Value Credential-ID Access key ID Credential-Secret Secret access key service-type Specify the service type: server(VM, GPU, Bare Metal),lb(Load Balancing),mysql(MySQL),redis(Redis) -
Select [Save & test]. If you see the message "Successfully queried the Prometheus API", the configuration is complete.
-
Repeat the steps above to create data sources for Load Balancing, MySQL, and Redis services.
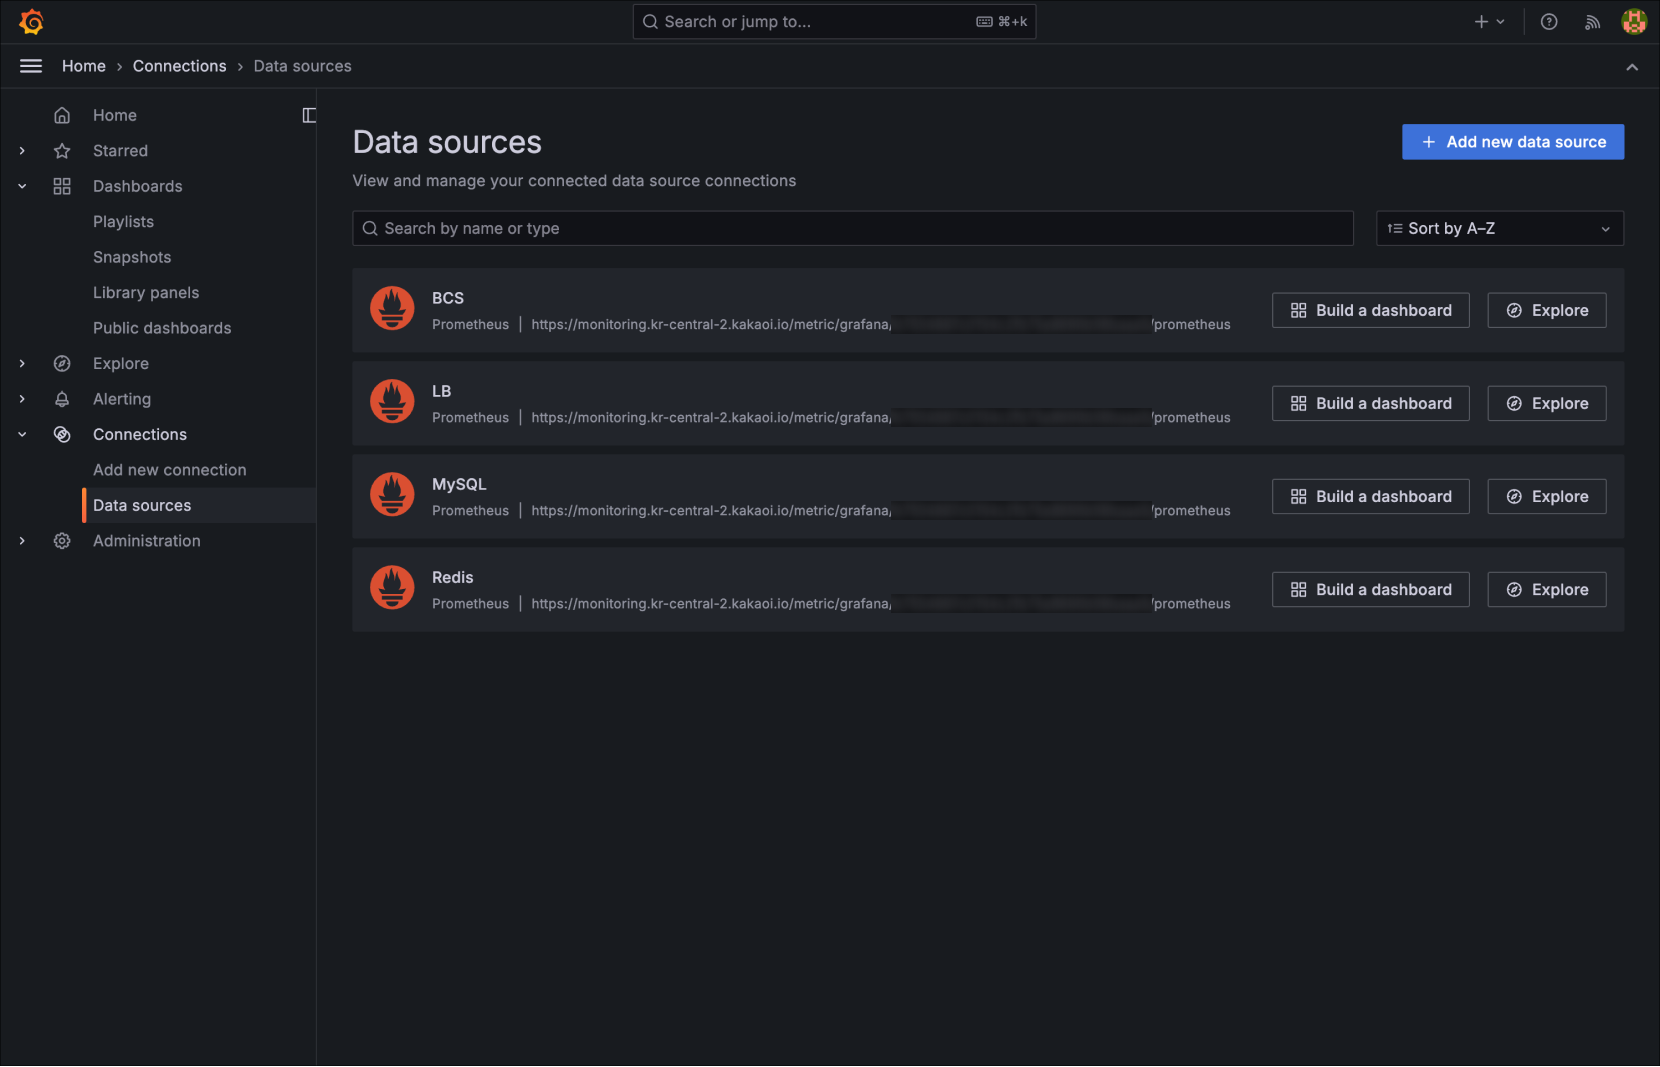
Prepared data sources
Step 2. Create dashboard using template
-
In Grafana, navigate to Dashboards > New > Import.
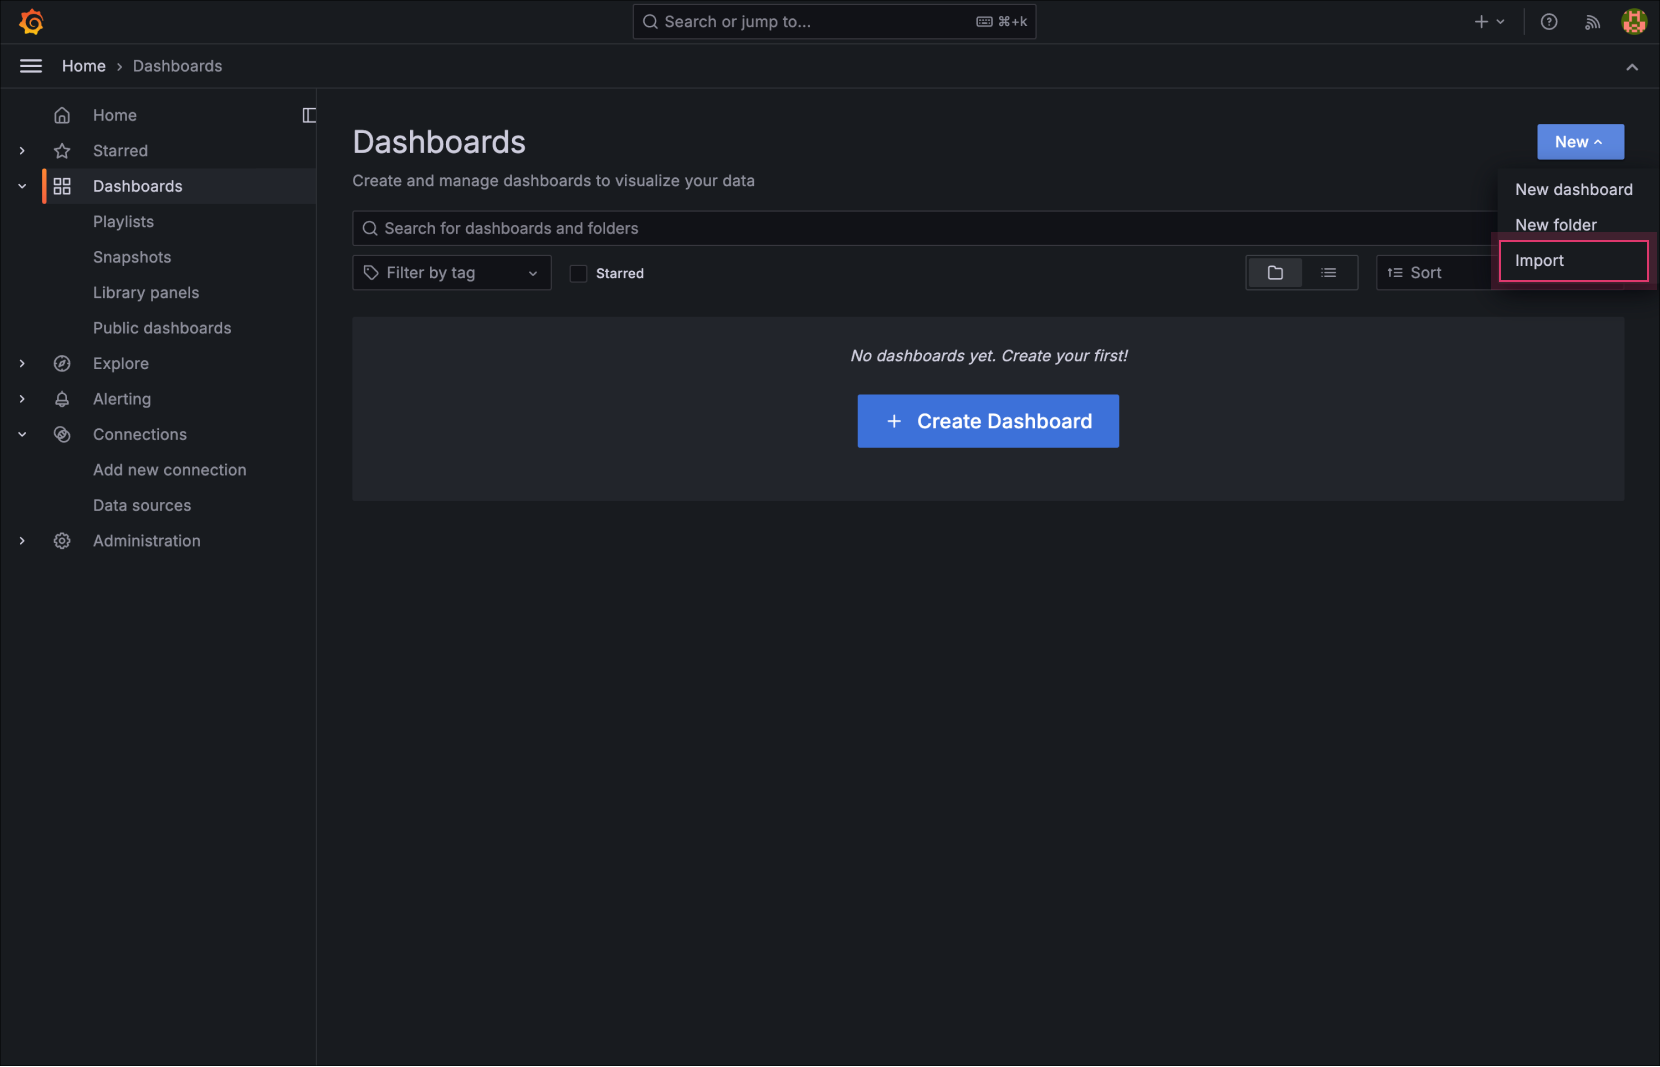
Dashboard Import -
Copy the ID or URL of the desired dashboard template from the table below and paste it into the input field. Select [Load].
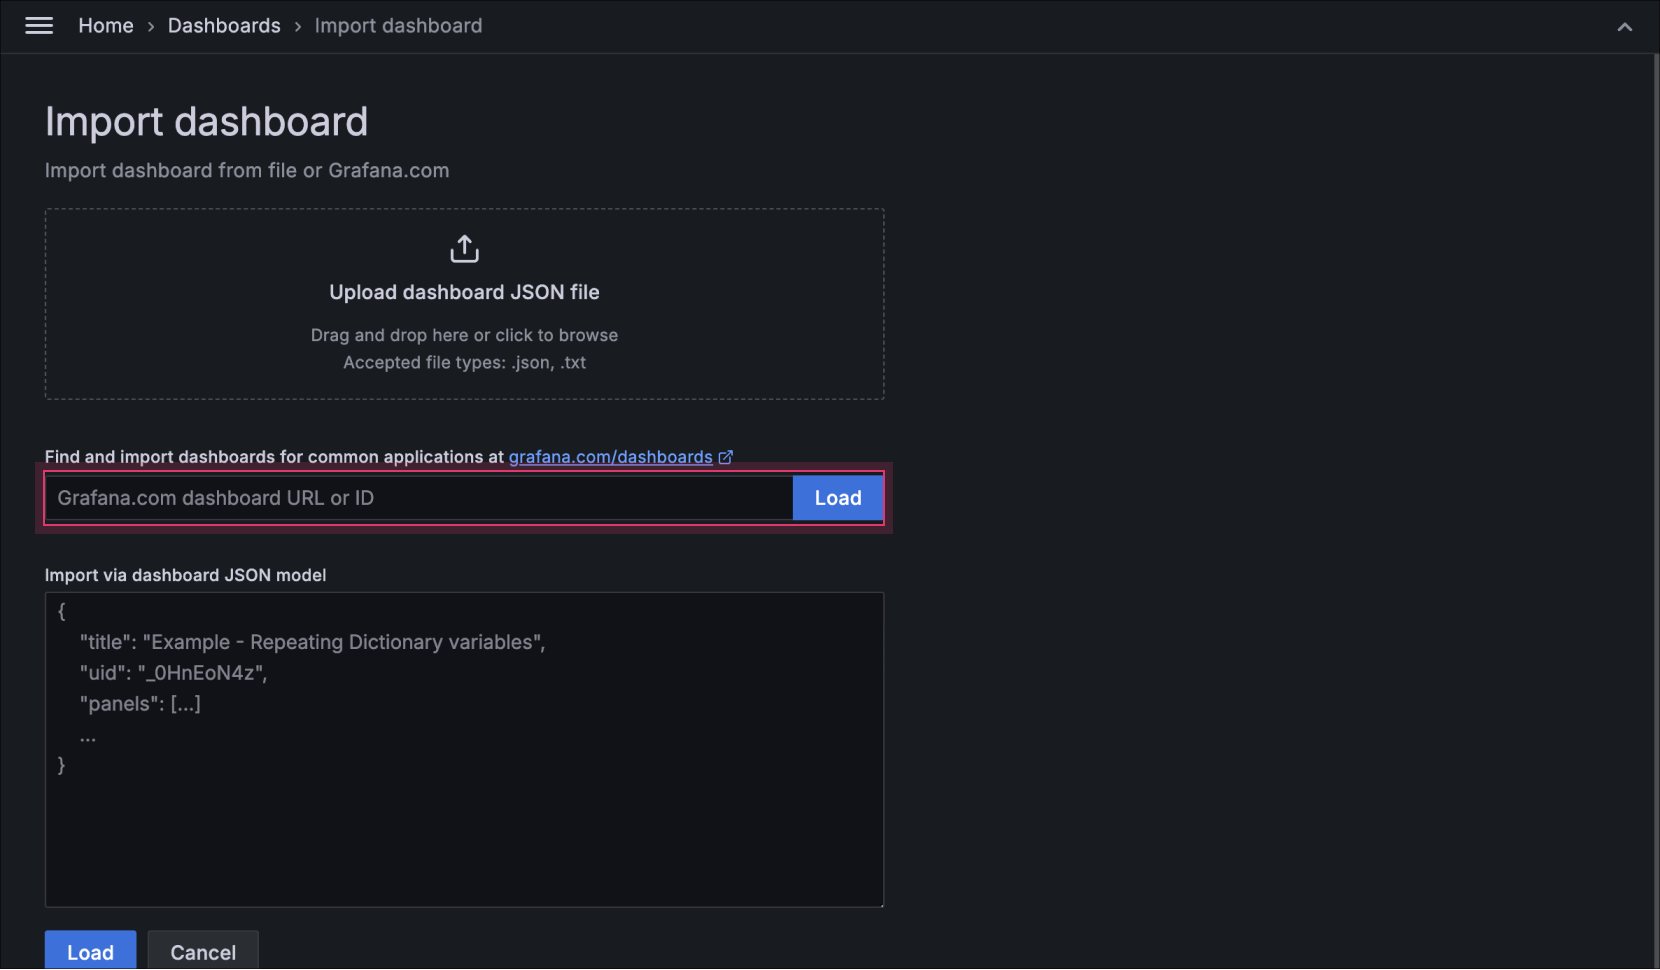
Upload dashboard JSON fileTemplate name ID Link KakaoCloud BCS Template 21123 바로가기 KakaoCloud Load Balancing Template 21124 바로가기 KakaoCloud MySQL Template 21125 바로가기 KakaoCloud PostgreSQL Template 23244 바로가기 KakaoCloud Redis Template 21126 바로가기
Select the BCS Dashboard template for this step.
-
Select the appropriate Data Source (
server-datasource) for the dashboard template.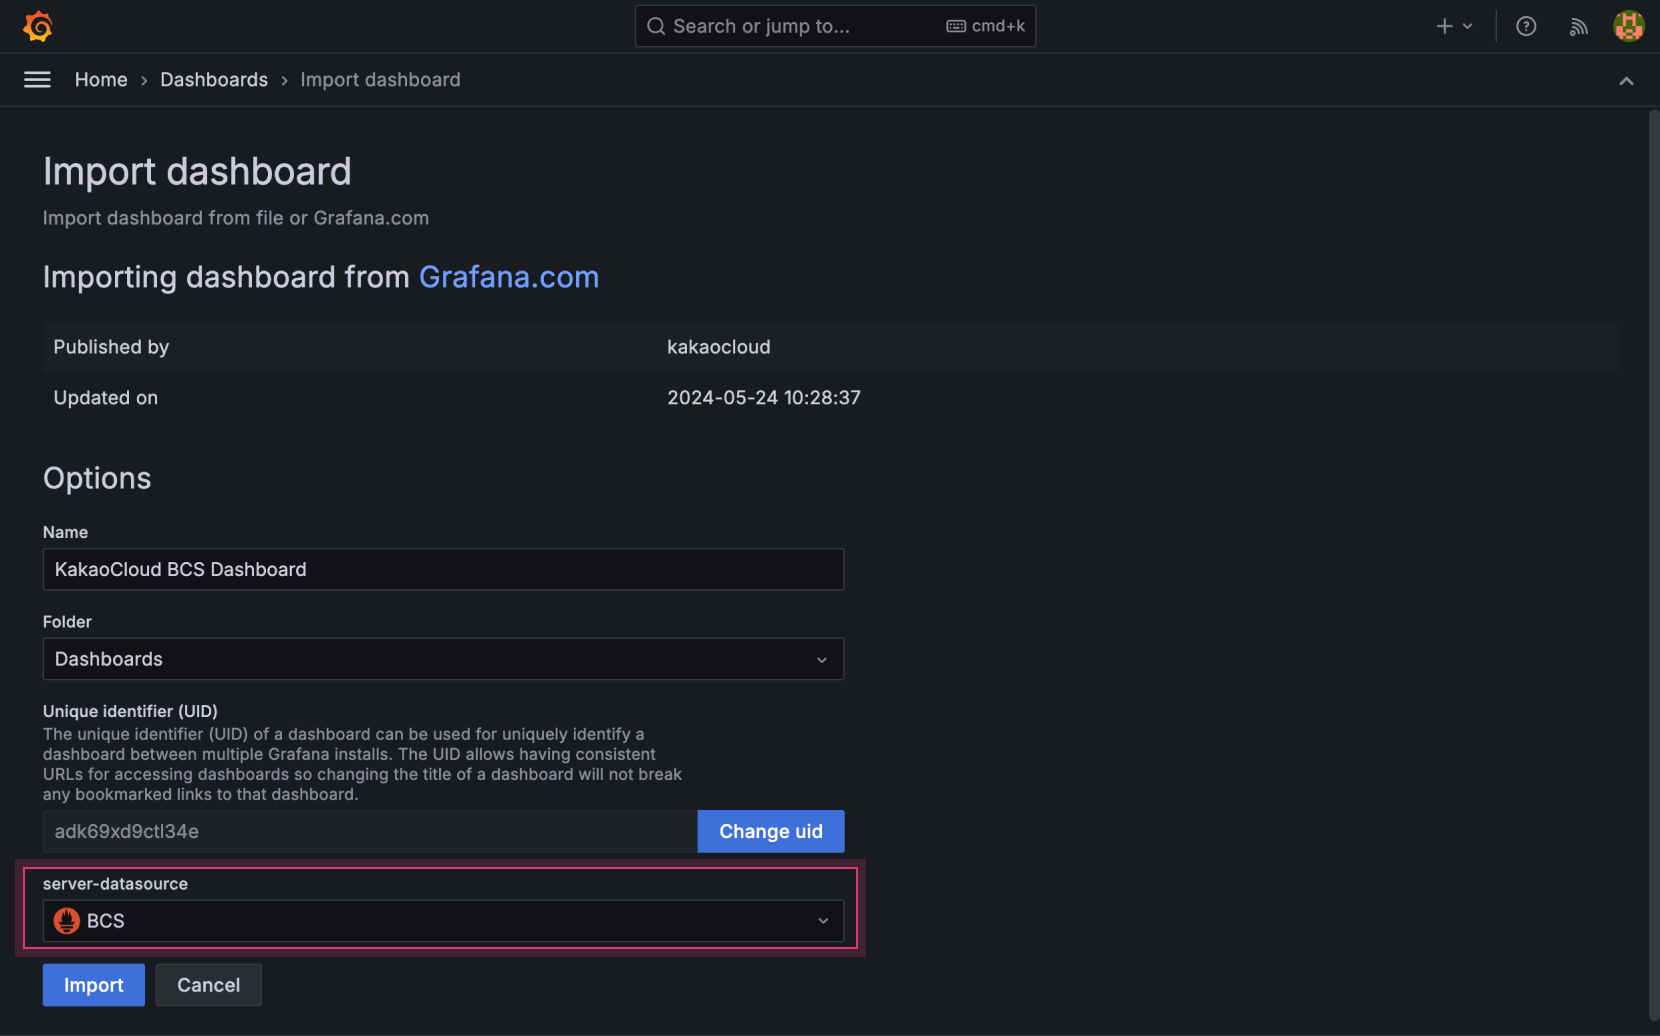
Select data source -
Select [Import] to create the dashboard.
-
Verify the metrics displayed on the dashboard. Use the tabs below to switch between different dashboards.
- BCS
- Load Balancing
- MySQL
- Redis
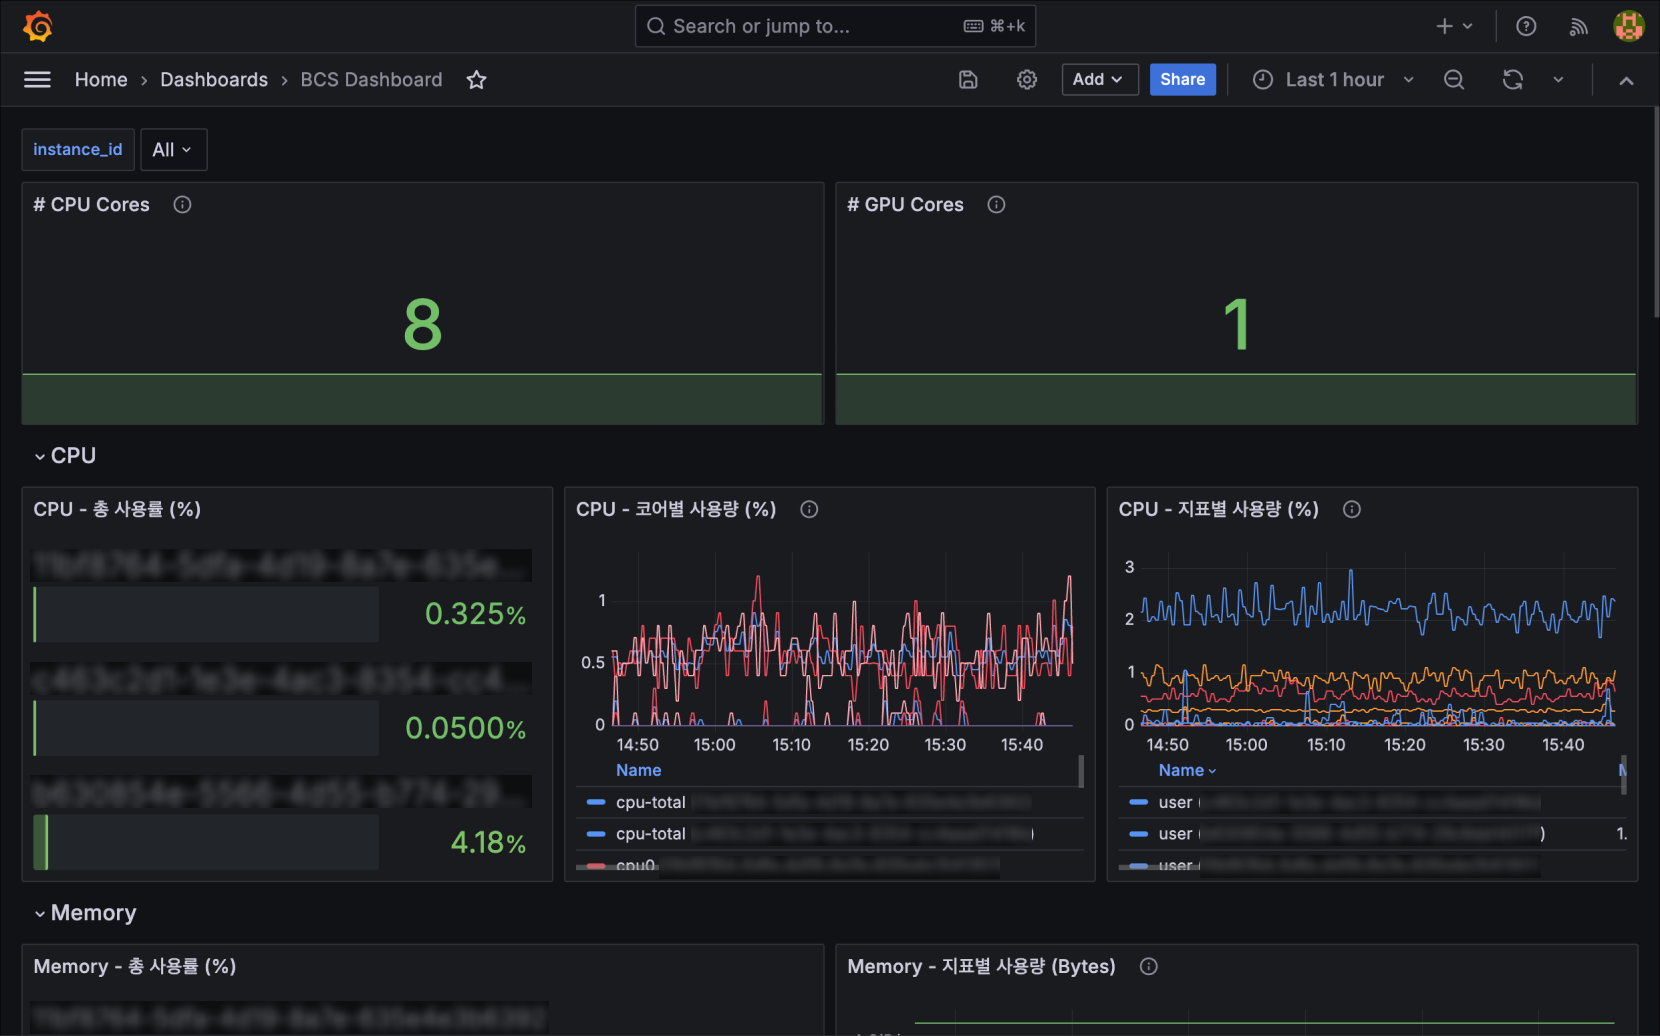
BCS Dashboard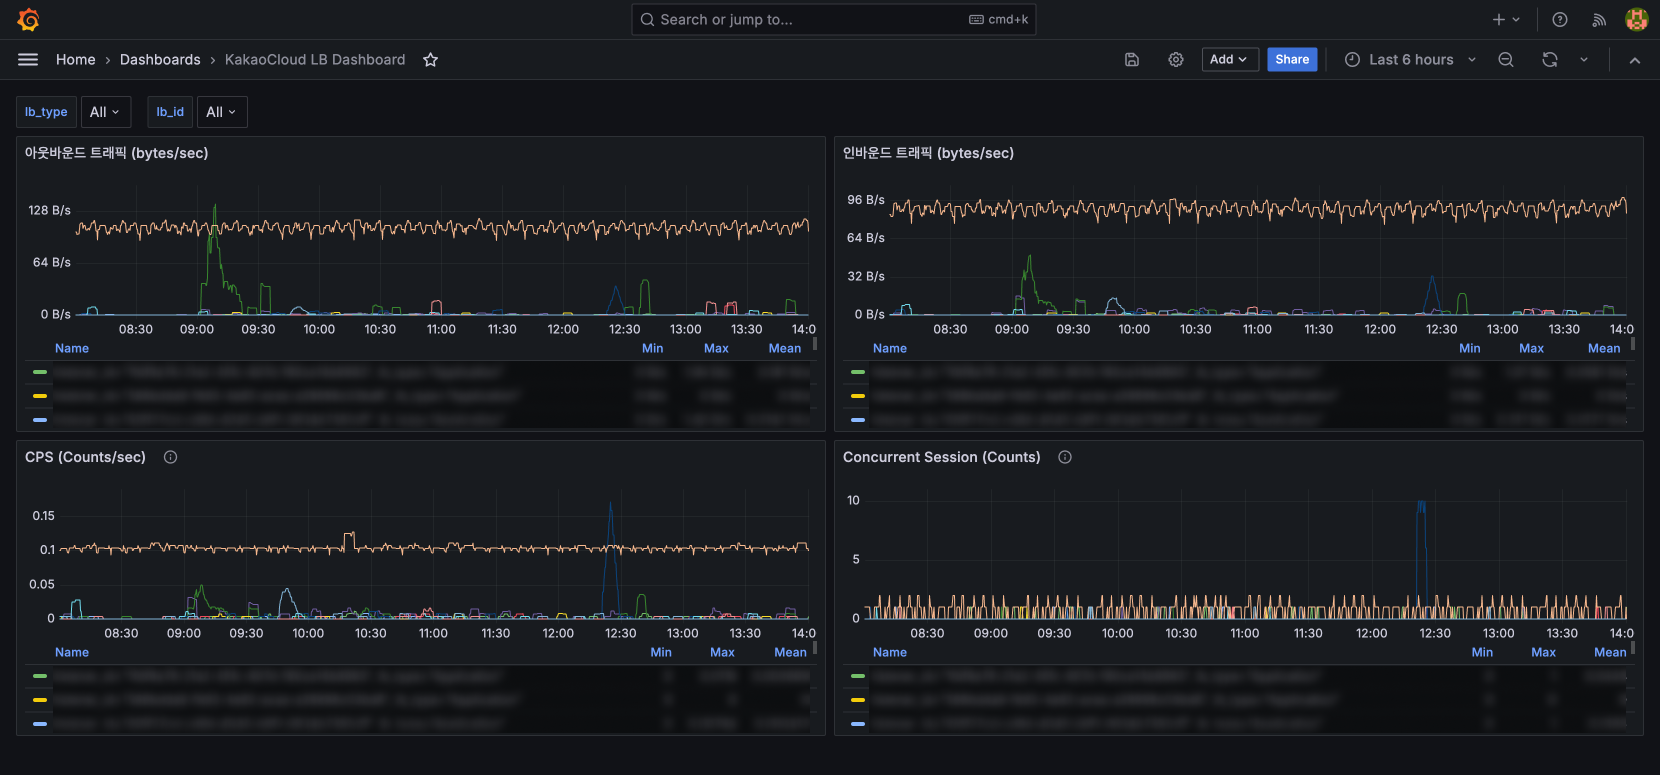
Load Balancing Dashboard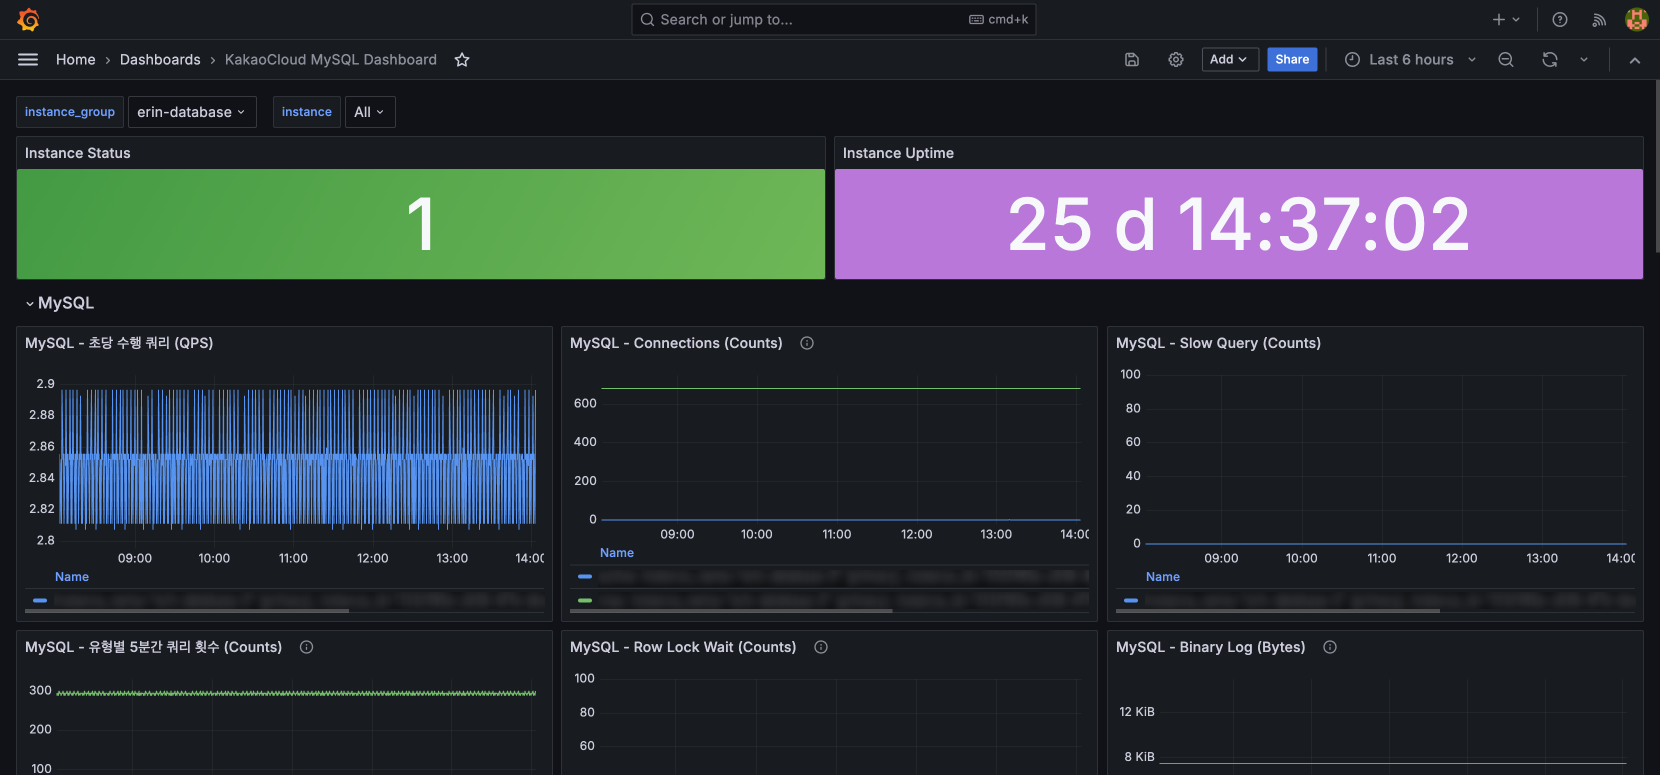
MySQL Dashboard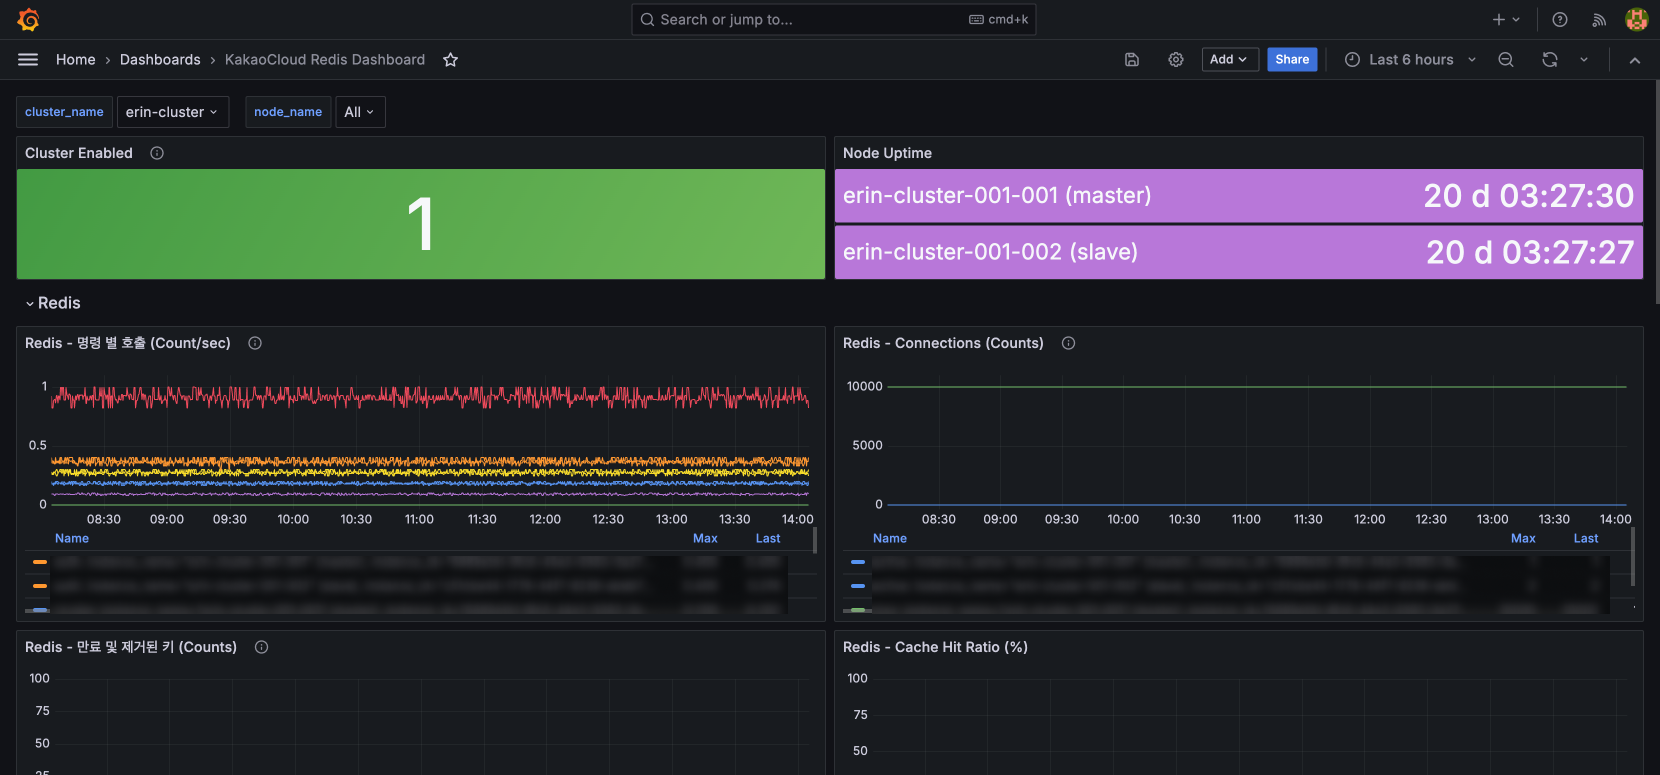
Redis Dashboard
KakaoCloud's Grafana dashboard templates can be easily customized to suit user preferences.
For more details, refer to the Metric Export guide.